

You’re offline. Open downloads
GDP
Automatically indexed from the existing article tag.
Theses, forecasts, models, and paths
No published research objects yet
This topic is ready for editors to connect a thesis, forecast, model, or research path.
Latest articles
 Article · related
When Must the Federal Reserve Expand Again? Modeling the Next $Trillions, 2027–2032
Pattern Nexus applies historical Fed balance-sheet data, reserve-capacity accounting, out-of-sample forecasting models and GDP-scaled intervention episodes to estimate how much the Fed may have to expand through 2032. The no-crisis illustrative reserve-support path rises from $6.748 trillion to about $8.18 trillion; a separate conditional large-event scenario is roughly $3.74 trillion over 12 months. Includes four original charts, source links and full model limitations.
Published Nov 9, 2026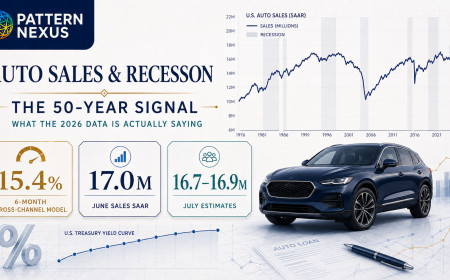 Article · related
Are Auto Sales Predicting a Recession? A 50-Year Regression and the 2026 Signal
Vehicle sales normally weaken before recession becomes obvious elsewhere. Pattern Nexus reconstructs every U.S. recession since 1976, builds auto-only and cross-channel recession models, audits prices, financing, delinquency and buyer concentration, and explains why strong mid-2026 sales reject an immediate recession call without proving broad household strength.
Published Aug 6, 2026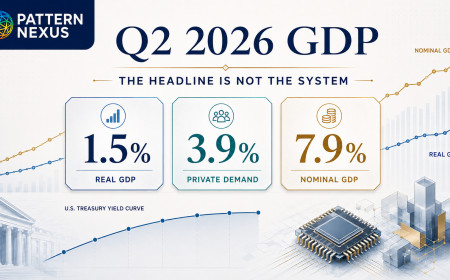 Article · related
GDP Slowed to 1.5%—But the U.S. Economy Did Not Weaken the Way the Headline Implies
Real GDP slowed to a 1.5% annual rate in Q2 2026, but the private domestic economy accelerated to 3.9% while nominal GDP grew 7.9%. This Pattern Nexus analysis separates the headline from the internal economy and explains what consumer spending, business investment, capital-goods imports, inflation, government accounting, Federal Reserve policy, and the 10-year Treasury signal actually mean.
Published Aug 4, 2026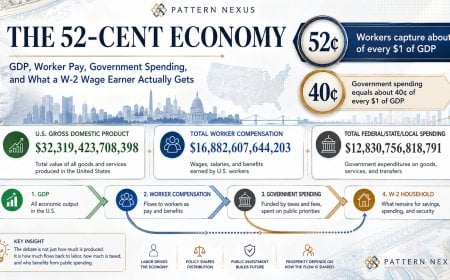 Article · related
The 52-Cent Economy: Where the American Output Dollar Actually Goes
America produces nearly $32 trillion a year, but the median W-2 worker experiences only a fraction of the aggregate output. This Pattern Nexus report maps GDP, total employee compensation, cash wages, government purchases, total government current expenditures, taxes, transfers, and the after-tax worker-capture problem. It tests the claim that only 10 cents of each productivity dollar returns to the people producing the system—and replaces the slogan with a defensible multi-layer accounting model.
Published Jul 19, 2026 Article · related
The 2075 GDP Rankings Aren’t About Power — They’re About Demographic Compounding
Goldman Sachs’ 2075 GDP projections aren’t a leaderboard of global power. They’re a demographic compounding map built on liquidity, population, and time. Here’s how to read it correctly.
Published Jan 5, 2026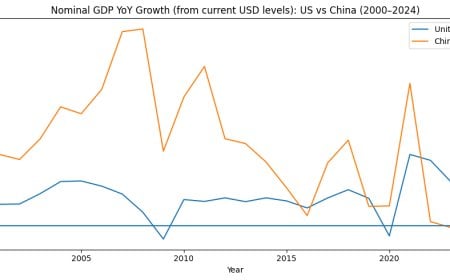 Article · related
Scale Is Destiny: Why China Didn’t Pass the U.S. — and Why That Matters
A data-driven breakdown of U.S. versus China economic growth from 2000–2024, showing why China failed to overtake the United States despite years of projections. Using GDP levels, growth rates, and scale mathematics, this report explains how demographics, housing collapse, trade regimes, and financial infrastructure reshaped the outcome — and why marginal U.S. growth now moves the global system.
Published Dec 24, 2025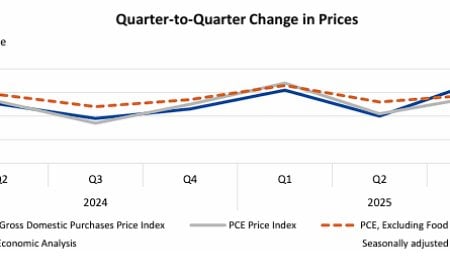 Article · related
The Household Maintenance Recession: America Is Falling Apart Quietly
Q3 GDP says the economy is strong. The data says households stopped fixing cars, homes, and appliances to survive. This is the household maintenance recession — and it’s invisible in GDP.
Published Dec 23, 2025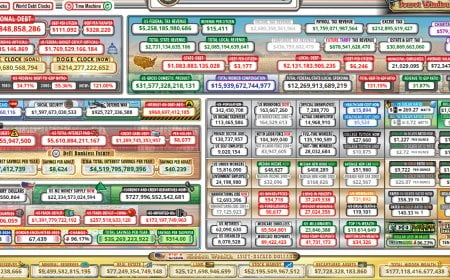 Article · related
Debt Without a Cliff: What the US Debt Clock Really Shows
A 35-year walkthrough of the US Debt Clock—from 1990 to 2029—showing how debt, GDP, and government spending really scale, why there is no magic “debt cliff,” and how this ties into CBDCs and tokenised Treasuries.
Published Nov 15, 2025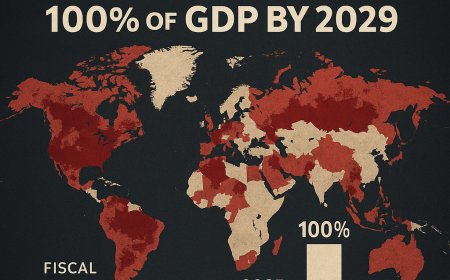 Article · related
🧭 IMF Warns Global Debt Could Exceed 100% of GDP by 2029
The IMF’s latest Fiscal Monitor warns that world public debt could climb beyond 100 percent of GDP by 2029 — a threshold unseen since the aftermath of World War II. Behind the numbers lies a structural problem: modern economies are addicted to debt-funded growth, and the world’s fiscal architecture is entering a critical phase.
Published Oct 18, 2025