
Skip to research
Pattern Nexus Pattern Nexus Pattern Nexus
Pattern NexusPattern Nexus
Menu
Data and visual research

Charts

Find visual analysis, chart previews and underlying sources.

Find the original analysis, citations and separately published chart or dataset records.
139published records
Visual research library

Charts in context

Explore chart-led reports with their original figures and explanations. Automatic classification does not manufacture chart observations.

Fed Total Assets (WALCL)
Chart: Fed Total Assets — the balance sheet explosionSource: FRED: WALCL
Chart-led research

How the Fed Quietly Stole 30% of Your Future (And How They’ll Use Stablecoins to Do It Again)

From 2020 to 2022, the Federal Reserve silently transferred 30–40% of your future purchasing power to asset owners via balance-sheet expansion, housing inflation, and the Cantillon effect. The next round of this game wi…

Context
62% relevance · 15 cited sources · 5 assets
Updated
Nov 15, 2025
Open original research and sources →
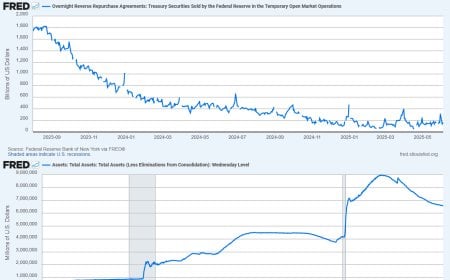
FRED chart: Overnight Reverse Repurchase Agreements (RRPONTSYD)
ON RRP outstanding. Spiked above $2T in 2022–23, then drained as T-bill yields rose in 2024–25.
Chart-led research

The Reverse Repo Trap: How the Fed Quietly Controls Liquidity & Markets

A deep dive into the Federal Reserve’s overnight reverse repo facility — why trillions parked at the Fed aren't “normal,” how it secretly tightens liquidity, affects Treasury auctions, impacts markets, and signals syste…

Context
62% relevance · 15 cited sources · 5 assets
Updated
Nov 9, 2025
Open original research and sources →