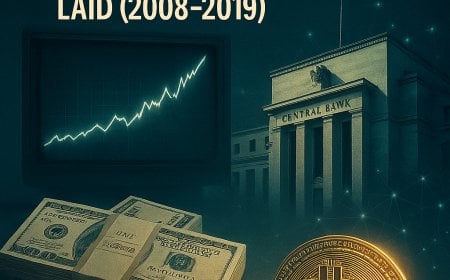
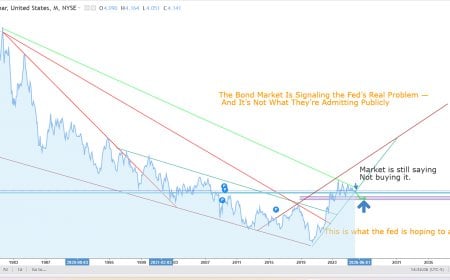
After the 2008 crisis, the global system didn’t deleverage — it migrated. Between 2008 and 2019, QE, ZIRP, swap lines, and new regulations turned central banks into the core liquidity engine, inflated asset prices, holl…
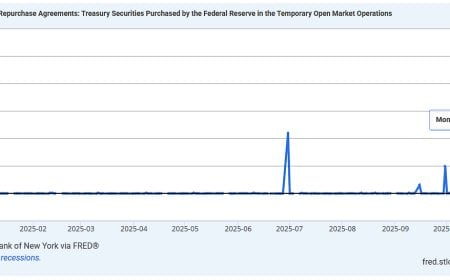
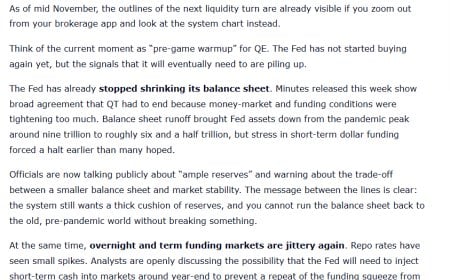
QT officially ended on December 1, 2025 — but the real story happened in the plumbing. With the RRP buffer nearly gone, SOFR volumes exploding, and the Standing Repo Facility pulling in Treasuries, agencies, and MBS, th…
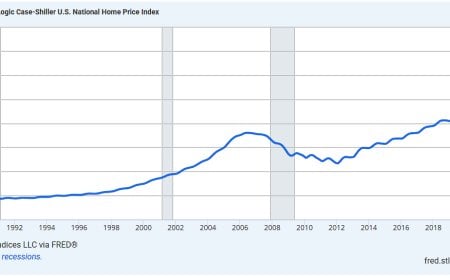
The National Association of Realtors is projecting a 14% rebound in existing-home sales for 2026 — but their forecast depends on a fragile monetary backdrop, a controlled collapse in mortgage rates, and a hidden liquidi…
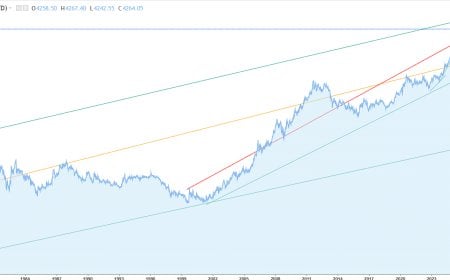
QT ends tomorrow and the Fed pivots to managing reserves with T-bills and MBS roll-off. Gold already snapped into a new liquidity rail, pricing faster debasement and rising bank stress.
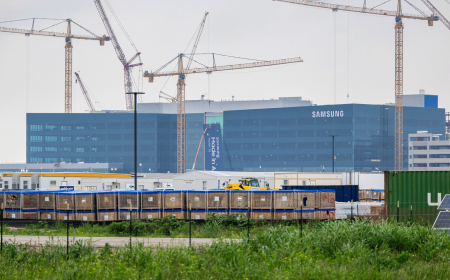
America is entering the largest industrial construction boom since WWII — LNG, data centers, chip fabs, tunnels — creating massive $100K+ trade opportunities.
Pattern Nexus isn’t just another macro or real-estate blog. It’s a systems-level lens that links AI, power, liquidity, housing, and geopolitics into one machine. This longform explains why there’s “no one else like this…
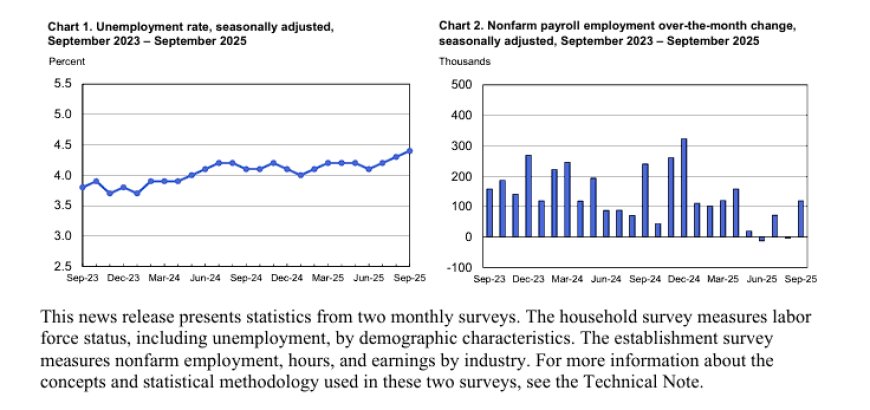
The delayed September 2025 jobs report shows 119k new jobs, 4.4% unemployment, and a labor market stuck in neutral—revealing the start of America’s Great Employment Plateau.
A deep, plain-language breakdown of how QE, fiscal policy, and the rising AI-industrial build-out are quietly pushing up the cost of housing, cars, power, and everyday life — and why prices never come back down even whe…
Foreclosures are quietly rising, rents are softening, and household budgets are breaking. A deep Pattern Nexus analysis of October 2025 foreclosure data, tenant stress, and the Great Housing Plateau.
From 2020 to 2022, the Federal Reserve silently transferred 30–40% of your future purchasing power to asset owners via balance-sheet expansion, housing inflation, and the Cantillon effect. The next round of this game wi…
The 10-year yield reveals the Fed’s real challenge: a shrinking debt-sustainability corridor the market refuses to accept. Here’s why the system can’t stay here.
If Pattern Nexus has been useful to you, help keep it growing.
Pattern Nexus is independently built and operated.
Most of the research remains publicly available,
but the data, servers, tools, research and time behind it all
have real costs.
Books, memberships and direct support help fund the next stage
without putting everything behind a paywall.