
Pattern Nexus Early Visibility Report — Week Four
A factual breakdown of what the platform’s fourth week reveals about traffic, distribution, user behavior, and cross-platform momentum — without hype, spin, or projections.
Pattern Nexus Early Visibility Report — Week Four
A factual breakdown of what the platform’s fourth week reveals about traffic, distribution, user behavior, and cross-platform momentum — without hype, spin, or projections.
Reader Distribution & Audience Composition (Week Four Snapshot)
Across the first four weeks, a clear picture has started to form around who is reading Pattern Nexus and how the audience is developing. The distribution is unusually broad for a new analytical platform, spanning multiple professional fields and more than fifty countries. Instead of clustering around a single niche, the readership has expanded along several domains at once:
- Finance and Markets: FX analysts, traders, wealth managers, banking professionals, and researchers.
- Engineering and Infrastructure: electrical, civil, mechanical, nuclear, and systems engineers.
- Energy and Grid Professionals: hydro compliance, oil and gas, renewables, grid operators, and energy analysts.
- Technology and Software: systems administrators, AI practitioners, cybersecurity professionals, and developers.
- Geopolitical, Academic, and Policy-Sector Readers: educators, researchers, university affiliates, government-adjacent roles, and regulatory professionals.
- Construction, Real Estate, and Field Operations: inspectors, builders, project managers, and operators.
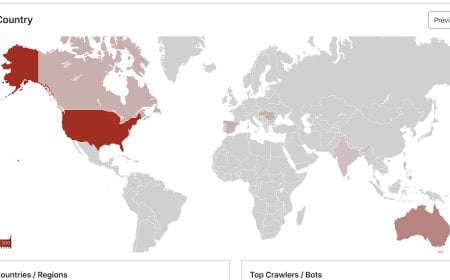
- International Distribution: consistent traffic from the United States, U.K., Australia, India, Canada, Singapore, Belgium, Romania, Germany, Vietnam, Malaysia, and dozens of other regions.
The audience reflects the same cross-domain nature as the content: readers who work inside different parts of the system — markets, energy, engineering, policy, infrastructure, and technology — but who intersect around a shared interest in understanding how these components interact.
This matters because most new publications develop in a narrow band: tech readers follow tech sites, market readers follow finance sites, policy readers follow geopolitics sites, and so on. Pattern Nexus has not followed that trajectory. Instead, it has formed a multi-disciplinary readership almost immediately, with a significant portion returning consistently.
Growth Curve Behavior
The growth curve has also deviated from typical early-stage patterns. Instead of a single early spike followed by a long plateau, Week Four indicates:
- a rising baseline level of daily traffic,
- recurring surges tied to high-density analytical posts,
- repeated algorithmic resurfacing on Facebook,
- and returning-user stabilization across multiple continents.
The result is a readership that is not only increasing but diversifying. New users tend to arrive through social discovery, while returning users behave more like an analytical audience — reading multiple articles, revisiting frameworks, and following systemic threads across categories.
This emerging pattern suggests that the platform is being adopted not as a news source or single-topic blog, but as a cross-domain research node — a place where complex systems are mapped across disciplines instead of in isolation.
Cloudflare Traffic — The Clearest View of Real Users
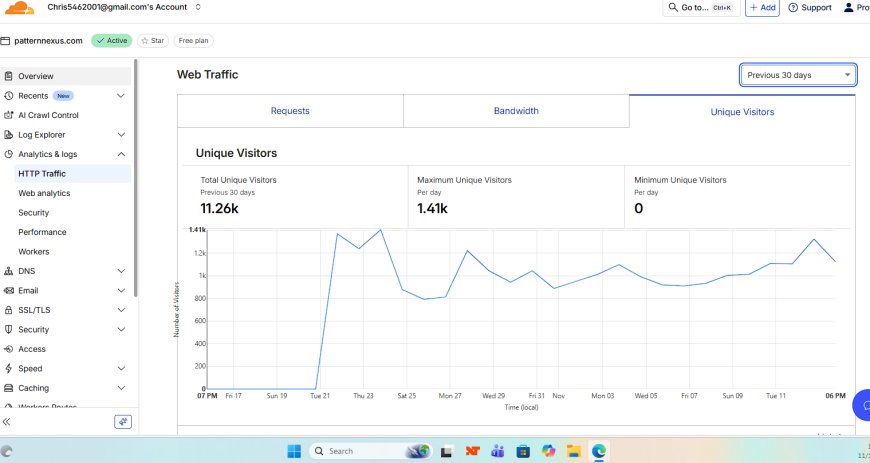
Cloudflare’s 30-day logs now show:
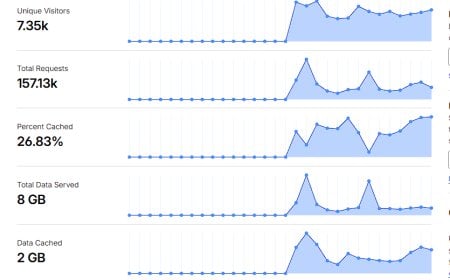
- 11.26K unique visitors across the last 30 days
- Daily peaks up to 1.41K unique users
- A clearly rising baseline, not just one-off spikes
Because Cloudflare filters out a large share of automated traffic, these numbers represent actual people hitting the site, not bots inflating totals.
The most important detail isn’t the peak; it’s the rising floor. Week 1 was dominated by volatile jumps. By Week 4, there is a visible base level of daily traffic that keeps trending higher. That usually indicates:
- direct visits and bookmarked entries,
- link-following from external shares,
- and growing algorithmic trust in the domain.
Cloudflare Web Analytics — Behavior Inside the Site
Cloudflare’s Web Analytics panel provides a second check on what people do after arriving at Pattern Nexus. Over the last 30 days, it reports:
- 4.03K visits
- 7.87K pageviews
- Traffic clustering around major article drops
- Gradually increasing day-to-day engagement
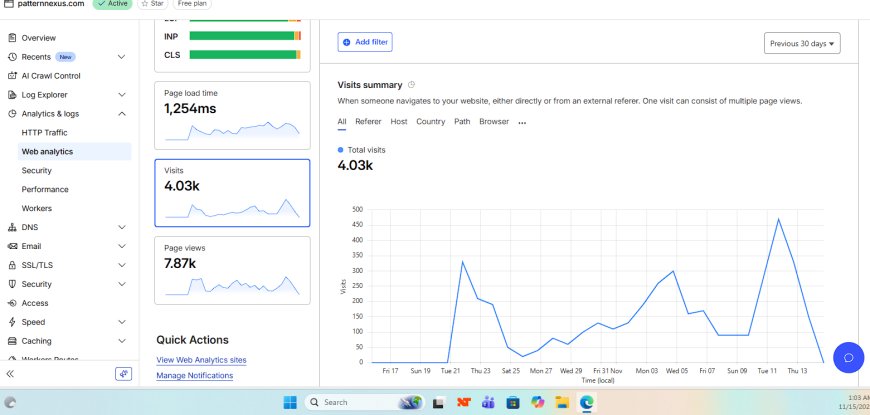
Because Cloudflare strips out a lot of background noise, this behavior reflects true on-page reading. The pattern matches what you would expect from a research-oriented site:
- sessions tied to long-form releases,
- readers moving between related articles,
- and an emerging core of people who treat the site as a recurring resource.
Facebook Insights — The External Visibility Driver
The Facebook professional dashboard remains the primary window into how content circulates before users ever reach the site. Over the past 60 days, it shows:
- 770,422 total views on the profile
- A sharp, positive trend in visibility over the period
- Multiple vertical spikes that push well above previous baselines
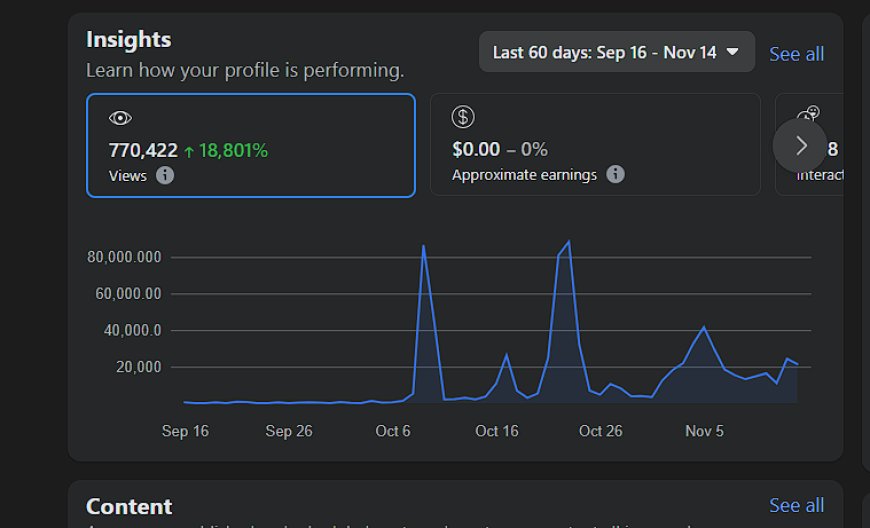
None of this was driven by boosts, ad campaigns, or cross-platform syndication. The spikes reflect certain posts breaking out organically, followed by a higher floor of daily visibility once the wave settles. That is typically what happens when a platform repeatedly surfaces high-density, high-signal content into feeds and users respond by sharing or commenting rather than just scrolling past.
GA4 — Returning Users & Geographic Penetration
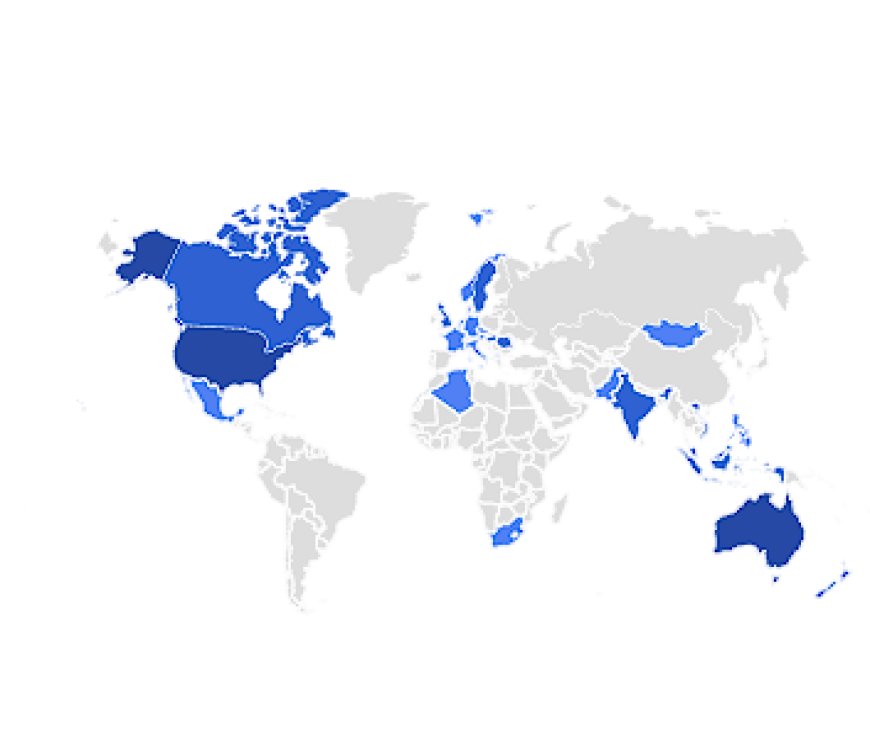
Google Analytics 4 adds another layer by showing who is coming back and where they are located. Over the past 28–30 days, the returning-user map highlights:
- United States – 77 returning users
- Australia – 27
- United Kingdom – 13
- Canada – 5
- India – 5
- Romania – 5
- Belgium – 4
- Additional recurring traffic from Europe, Asia, and elsewhere
The new vs. returning chart shows a similar pattern:
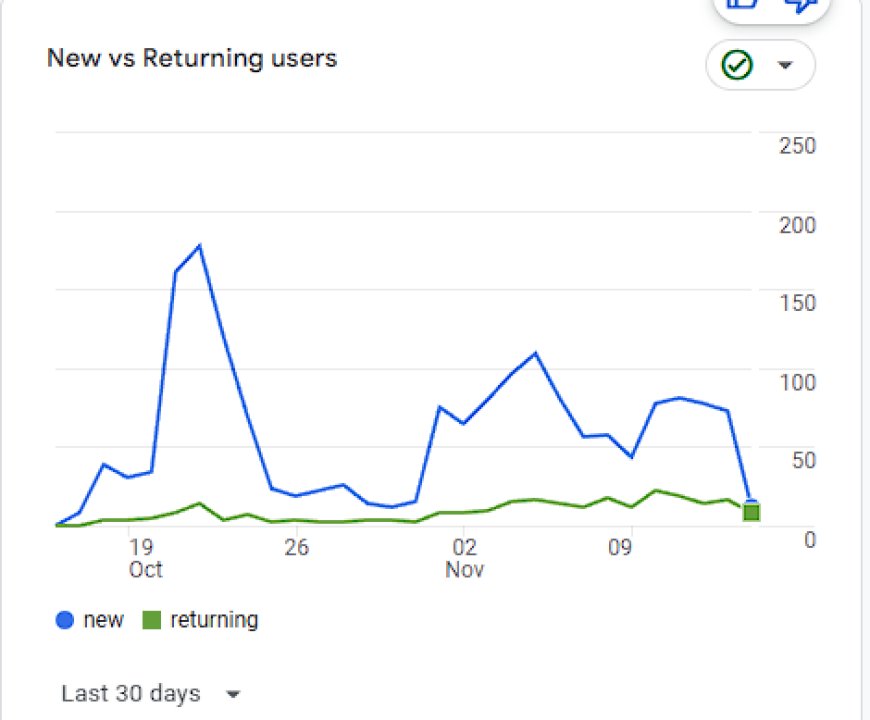
New visitors spike as content gets surfaced into feeds and shares. Returning visitors form a steady floor. That combination is what you expect from a research or analysis hub where readers come back specifically to work through multiple essays, not just follow a single headline.
Traffic Spikes and Behavioral Interpretation
Looking across Cloudflare, GA4, and Facebook together, the site now exhibits three consistent types of activity spikes:
- Analysis-driven surges – Major macro, market, or structural pieces generate elevated traffic for 24–48 hours as they circulate from one circle of readers to the next.
- Facebook-driven surges – Certain posts cross into the higher tiers of the feed algorithm, driving immediate bursts of inbound visitors.
- Multi-article session chains – A subset of users navigate through ten, fifteen, or even twenty pieces in a single session, which is characteristic of researchers, professionals, and system-level thinkers who are trying to understand the larger framework.
As these spikes repeat, they leave behind a higher baseline rather than returning to the original starting point. That’s the early shape of compounding—not in the marketing sense, but in the literal sense of a system that re-stabilizes at a higher level after each disturbance.
Cross-Platform Cohesion — A Key Structural Signal
The most important development in Week Four is that all major measurement tools now agree on the direction of travel:
- Cloudflare shows a rising floor of unique visitors.
- Cloudflare Web Analytics shows more visits and pageviews tied to key posts.
- Facebook shows higher recurring visibility and non-trivial spikes.
- GA4 shows an increasing core of returning users and broader geographic spread.
- Google Search Console continues to add queries and impressions for new pages.
When independent systems converge like this, it usually means the underlying trend is structurally real rather than an artifact of one particular dashboard.
Search Engine Visibility (GSC Update)
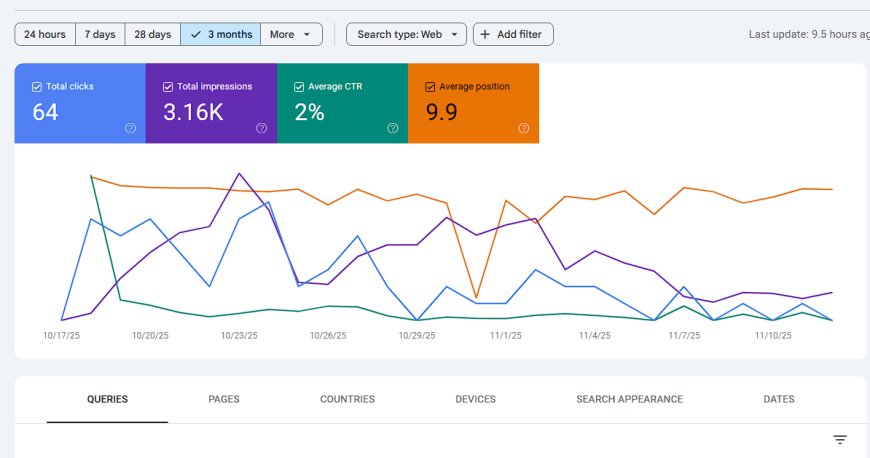
On the search side, Week Four is less dramatic than the initial indexing burst but still meaningful. Google Search Console continues to show:
- new queries appearing as more articles are published,
- both
httpsand legacyhttpvariants receiving impressions, - a slow but steady accumulation of clicks from organic search,
- and consistent crawling from multiple search-engine bots.
For a domain with no deliberate SEO work behind it, the continued indexing velocity remains above baseline.
Interpreting Week Four — Without Spin
The simplest honest characterization of Week Four is this:
This is not viral traffic. It’s not influencer traffic. It’s not hype-based traffic.
What the numbers show instead is a cross-domain analytical site building stable early momentum faster than the usual timelines for new platforms. Typical baselines for research publications look something like:
- 3–6 months for steady indexing
- 6–12 months for a few thousand monthly visitors
- 12–18 months for a meaningful returning-user floor
- 18–36 months for noticeable international penetration
Pattern Nexus is showing early strength on all four dimensions inside the first month. There is no guarantee that the slope continues at the same angle, but the floor is now clearly higher than when the site launched.
Why Week Four Matters
Three things solidified in Week Four:
- Distribution uniformity – Traffic is no longer purely “spike-based.” There is a recognizable everyday baseline.
- International retention – Readers from multiple continents are not just arriving once; they are coming back.
- Multi-article reading – The site behaves like a research hub where users move through interconnected essays rather than a single-post blog.
These characteristics are typical of platforms that go on to become durable reference points for a specific type of thinking—in this case, systems-level pattern mapping across macro, markets, energy, technology, and geopolitics.
Conclusion
Week Four confirms the core signal from the earlier report:
High-signal analysis tends to attract high-signal readership.
The growth so far has come without advertising, SEO campaigns, or distribution partnerships. It has been driven by readers who find value in dense, cross-domain explanations of how the system fits together and then pass that work along.
Week Five will provide the first full true-month comparison and a clearer view of compounding effects. For now, Week Four stands as another factual validation that the foundation is not just intact—it is quietly strengthening.
Data Sources
- Cloudflare Traffic Logs
- Cloudflare Web Analytics
- Facebook Professional Insights
- Google Analytics 4 (GA4)
- Google Search Console
- Server-side hosting logs (AWStats / related tools)
Menene Martaninka?
 Kamar
0
Kamar
0
 Karya
0
Karya
0
 Kauna
0
Kauna
0
 Ban dari
0
Ban dari
0
 Wao
0
Wao
0
 Bacin rai
0
Bacin rai
0
 Fushin
0
Fushin
0

Founder of Pattern Nexus. I research markets, macro, geopolitics, AI, history, ancient systems, and the patterns most people overlook. I’m also building Market Radar, a trading scanner designed to read pressure, risk, confirmation, and setup quality before chasing a move. Pattern Nexus is where I connect the dots between data, history, technology, and the bigger system playing out around us.


















Sharhu (0)