 Editor-written summary
A guided public index of 328 timestamped Pattern Nexus articles covering Federal Reserve liquidity, interest rates, the dollar, gold and silver, housing, real estate, markets, debt, banking, energy, trade, industrial buildout, and geopolitical transmission. Each section explains what readers will find, what they will learn, and where to begin.
Inside this report
- Pattern Nexus Macro Archive
- What this page contains
- Why this archive exists
 Editor-written summary
Originally written by Christopher Grenke in 2022, this paper examines artificial intelligence, trust, ethics, human values, algorithmic bias, accountability, and the potential consequences of increasingly advanced A.I. systems. It is being published in its original form without updating its arguments or conclusions to reflect later developments.
Inside this report
- Why Artificial Intelligence needs an ethical approach.
- Table of Contents
- Abstract
 Editor-written summary
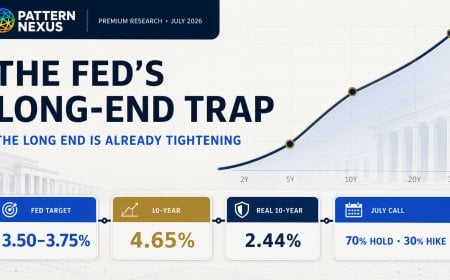
A full July 2026 data reconstruction of the Federal Reserve’s next policy path, showing how a 4.65% nominal 10-year, 2.44% real 10-year, Treasury supply, oil risk and uneven liquidity conditions create a hawkish-hold trap.
 Editor-written summary
A 2003–2026 reconstruction of Fed liquidity, gold, housing and NASDAQ data, plus an experimental stablecoin-augmented liquidity index.
Meta tags: liquidity conditions index, hard assets, gold, Federal Reserve balance sheet, Treasury General Account, reverse repo, M2, stablecoins, tokenized Treasuries, housing, NASDAQ, PCA
 Editor-written summary
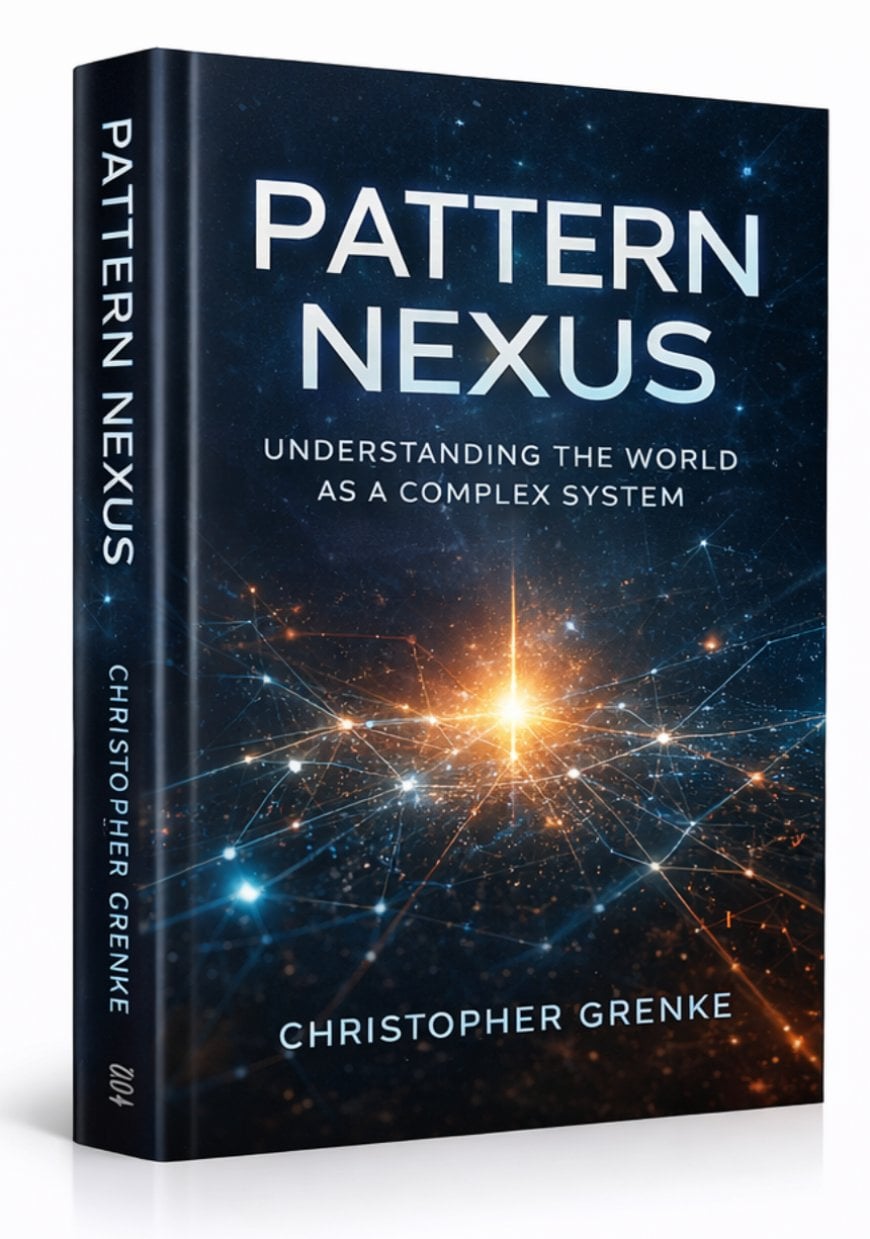
Read the complete 10-chapter digital edition of Pattern Nexus Worldview by Christopher Grenke. A systems-level examination of money, liquidity, markets, energy, AI, geopolitics, sovereignty, society, control systems, and the architecture shaping the modern world.
 Editor-written summary
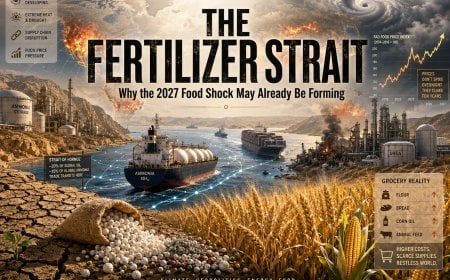
Fertilizer prices, Persian Gulf disruption, a potentially historic El Niño, expanding drought risks, weak currencies, and fragile food-import systems are converging ahead of the 2027 growing cycle. This extended Pattern Nexus analysis examines more than 50 years of population, grain production, fertilizer, energy, climate, inventory, and food-price data to determine whether the world is approaching another major food-inflation and political-instability cycle.
Inside this report
- The Thesis Is Directionally Correct, but the Causal Chain Must Be Precise
- The 50-Year Productivity Escape
- The Current Grain Balance Sheet Does Not Yet Show a Worldwide Physical Shortage
 Editor-written summary
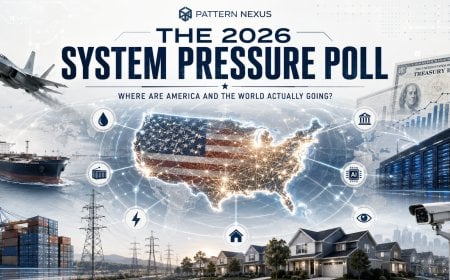
This is not another left-versus-right approval poll.
The Pattern Nexus System Pressure Poll examines the deeper structures shaping current events: war, energy, shipping corridors, debt, interest rates, tariffs, artificial intelligence, surveillance, housing, automation, institutional trust, and the emerging global order.
The daily headlines are downstream. The objective is to identify which systems people believe are actually driving events—and where those systems are taking the United States and the rest of the world.
 Editor-written summary
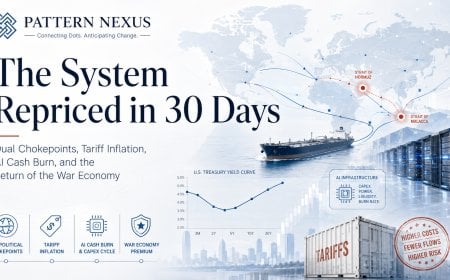
In thirty days, the operating assumptions underneath the global system changed. Two maritime chokepoints came under pressure, the United States expanded war financing and rebuilt its tariff architecture, inflation moved back upstream, long-term yields repriced, AI infrastructure crossed into cash-burn territory, strategic minerals became permissioned leverage, and political command structures began cracking. This Pattern Nexus analysis maps those events as one connected system rather than separate headlines.
 Editor-written summary
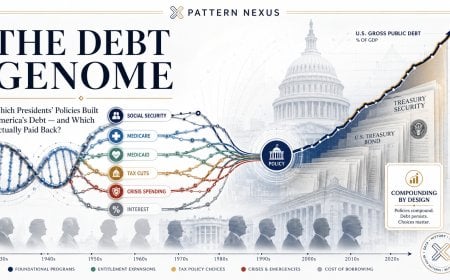
A 70-year counterfactual audit of presidential policy, inherited law, tax cuts, entitlements, crisis packages, and the compounding interest tail. The analysis separates who originated a policy from who expanded, extended, financed, or weakened it—and distinguishes Treasury cost from social return.
Inside this report
- The Debt Genome: Which Presidents’ Policies Built America’s Debt—and Which Actually Paid Back?
- The answer changes by debt mechanism
- Why This Is Premium
 Editor-written summary
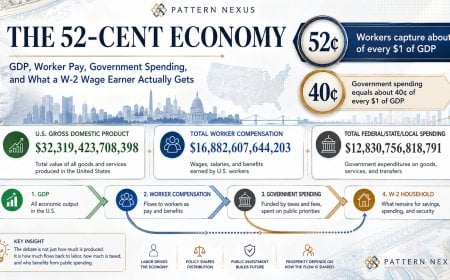
America produces nearly $32 trillion a year, but the median W-2 worker experiences only a fraction of the aggregate output. This Pattern Nexus report maps GDP, total employee compensation, cash wages, government purchases, total government current expenditures, taxes, transfers, and the after-tax worker-capture problem. It tests the claim that only 10 cents of each productivity dollar returns to the people producing the system—and replaces the slogan with a defensible multi-layer accounting model.
Inside this report
- The 52-Cent Economy: Where the American Output Dollar Actually Goes
- The Three Numbers and the First-Pass Math
- The Ratios Embedded in the Image
 Editor-written summary
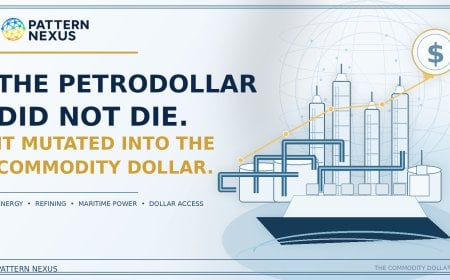
The old petrodollar was built around imported oil, dollar invoicing, military protection, and the recycling of global surpluses into American assets. The emerging commodity-dollar system is more direct: the United States produces record volumes of oil and gas, operates enormous refinery and export infrastructure, protects strategic waterways, controls critical financial rails, and can restrict access to global markets through sanctions, insurance, banking regulation, export controls, and maritime enforcement.
Inside this report
- The Petrodollar Did Not Die. It Mutated Into the Commodity Dollar
- The Export Surge Is Not a Side Story
- The Petrodollar Was Always Shorthand
 Editor-written summary
A deep Pattern Nexus regression and data analysis mapping where net worth levels from $100 to $1 trillion place an individual within the global and American wealth distributions. The research separates actual net worth from liquidity, accessible credit, gross capital control, leverage, and daily capital-producing capacity.
Where do you actually sit within the global wealth system—and how does that position change when we measure not only what you own, but how much capital you can access?
This research maps wealth levels from $100, $500, and $1,000 through $1 million, $1 billion, $100 billion, and the theoretical $1 trillion threshold. Global and American wealth distributions are analyzed separately using regression models, percentile estimates, Federal Reserve household data, international wealth-distribution research, and 17 original charts and visualizations.
The analysis distinguishes net worth from liquid wealth, available credit, collateral-backed borrowing capacity, and gross capital controlled. It then models how productive leverage can accelerate wealth growth, how destructive leverage can erase equity, and how much daily capital output different levels of wealth may generate.
Net worth measures ownership. Liquidity measures deployability. Credit measures reach. Leverage amplifies the result. Capital efficiency determines whether that amplification creates wealth or debt.
Inside this report
- The Capital Ladder: Where $100 to $1 Trillion Places You in the Global and American Wealth System
- The Four Wealth Hierarchies
- Hierarchy One: Net Worth