 Editor-written summary
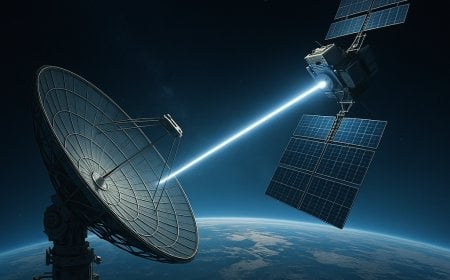
Star Catcher surpassed DARPA by beaming 1.1 kW at NASA, signaling the rise of space-based solar power — a new industry that will reshape global energy.
Inside this report
- Star Catcher Breaks DARPA’s Record — The Space Solar Race Just Entered a New Phase
- The Original Vision: Unlimited Solar Power From Space
- Why Star Catcher’s Demonstration Matters
 Editor-written summary
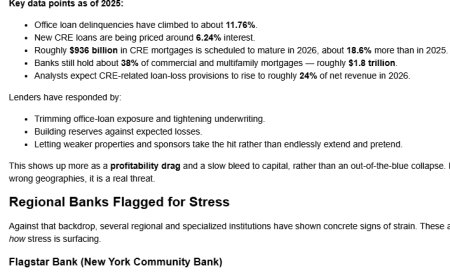
A Pattern Nexus structural analysis of banks and primary dealers facing stress as of November 21, 2025. Covers regional banks, commercial real-estate risks, dealer liquidity constraints, SRF usage, fraud-related credit shocks, and system-wide resilience signals.
Inside this report
- Banks and Primary Dealers Facing Stress as of Nov 21, 2025
- Background: How to Interpret Bank Stress in Late 2025
- Liquidity Backstops & Fed Plumbing
 Editor-written summary
A 40-year structural analysis of the US 10-Year Treasury futures market, showing how recessions consistently collide with long-term yield channels, why yield curve inversions continue to matter, and what today’s setup means for the next macro cycle. A full Pattern Nexus Lens breakdown.
Inside this report
- Can the 10-Year Treasury Predict Recessions?
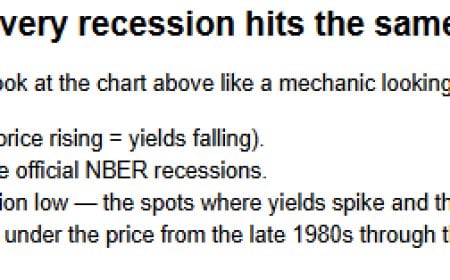
- The visual intuition: every recession hits the same “pressure rail”
- The classical story: yield curves and recession odds
 Editor-written summary
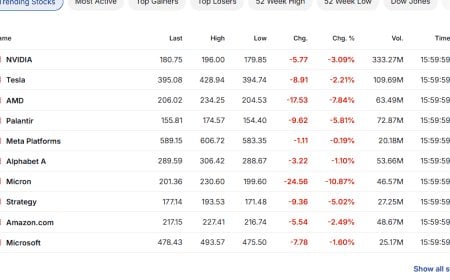
A strange day in markets: everything sold off while the dollar barely moved. Here's what actually happened through the Pattern Nexus lens.
Inside this report
- Risk-Off With No Headline: 11/20/2025 Market Wrap
- On This Page
- Big Picture: Everything Red, Dollar Flat
 Editor-written summary
Pattern Nexus isn’t just another macro or real-estate blog. It’s a systems-level lens that links AI, power, liquidity, housing, and geopolitics into one machine. This longform explains why there’s “no one else like this on the internet,” how it differs from names like Schiff, Colombo, Pozsar, Dalio, Balaji, Zeihan, and more, and how to use this framework to navigate the 2020s.
Inside this report
- Why Pattern Nexus Exists: The Missing Lens for Macro, AI, and Markets
- On This Page
- Why I’m Writing This
 Editor-written summary
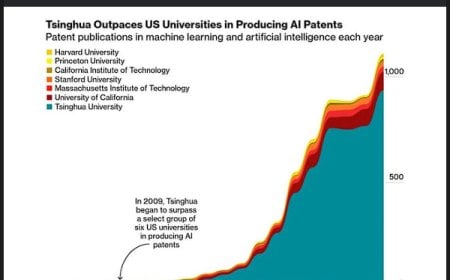
This article breaks down why Tsinghua University’s surge in AI patents doesn’t mean China is winning the AI race. Patent charts measure universities—not compute, chips, cloud infrastructure, power, or frontier model leadership. Using real data, we explain why the U.S. still dominates the AI-industrial stack in 2025 and what pressure points actually matter.
Inside this report
- The Patent Illusion: Why the U.S. Still Leads the AI Race (and Why That Tsinghua Chart Is Misleading)
- On This Page
- The Viral Tsinghua Patent Chart
 Editor-written summary
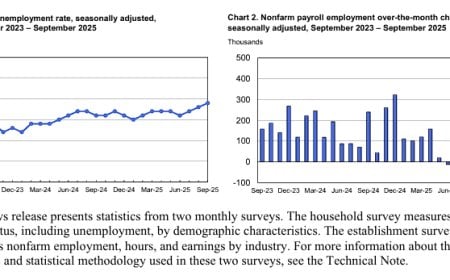
The delayed September 2025 jobs report shows 119k new jobs, 4.4% unemployment, and a labor market stuck in neutral—revealing the start of America’s Great Employment Plateau.
Inside this report
- Jobs on Pause: September 2025’s Delayed Report and the Great Employment Plateau
- On This Page
- What the September Jobs Report Actually Says
 Editor-written summary
A deep, plain-language breakdown of how QE, fiscal policy, and the rising AI-industrial build-out are quietly pushing up the cost of housing, cars, power, and everyday life — and why prices never come back down even when inflation cools.
Inside this report
- QE 2026: The Trigger, the Mechanics, and How the Next Liquidity Wave Hits Your Life
- Pattern Nexus Snapshot
- On This Page
 Editor-written summary
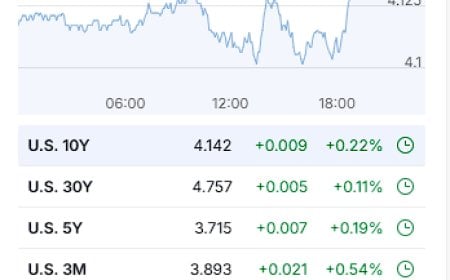
Nvidia crushed earnings and boosted guidance, but stocks barely moved as the 10-year pushed toward 4.15% and Fed minutes signaled caution. Full Pattern Nexus analysis.
Inside this report
- Market Wrap – November 19, 2025: Nvidia Smashes the “AI Bubble” Story While the 10-Year Tightens the Screws
- On This Page
- Cross-Market Snapshot – Green, but Reluctantly
 Editor-written summary
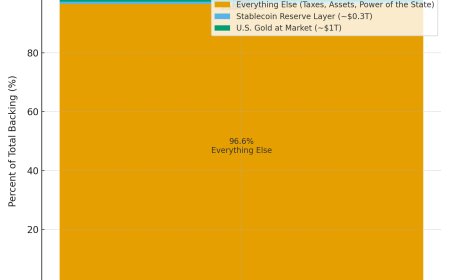
Gold hit $4,400 in 2025—but the U.S. still prices its hoard at $42. This article breaks down the real backing of the dollar: gold, stablecoins, and power.
Inside this report
- The $42 Illusion: Gold, Stablecoins, and the Hidden Backing of the Dollar
- On This Page
- The $42 Illusion on America’s Balance Sheet
 Editor-written summary
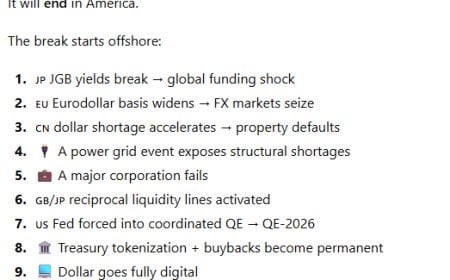
A speculative deep dive into the hidden stress points of 2025—from weak holiday sales and tenant distress to global funding cracks, AI-power strain, and Treasury fragility.
Inside this report
- What Breaks First? A Speculative Walkthrough of System Stress in 2025
- On This Page
- A Rare Speculation Warning
 Editor-written summary
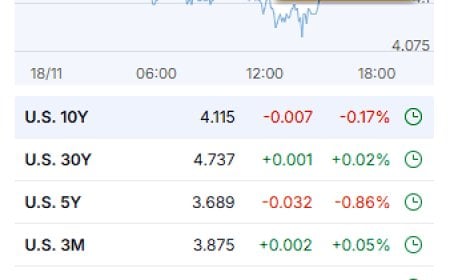
Tech stocks dragged the market lower as the Dow fell nearly 500 points, oil held above $60, and the 10-year drifted near 4.11% in a mixed macro session.
Inside this report
- Market Wrap – November 18, 2025: Tech Cracks, Oil Holds, and the 10-Year Drifts But Doesn’t Break
- On This Page
- Cross-Market Snapshot – Tech Drag, Mixed Signals