

10-year
Automatically indexed from the existing article tag.
Theses, forecasts, models, and paths
No published research objects yet
This topic is ready for editors to connect a thesis, forecast, model, or research path.
Latest articles
Fed Just Hiked Into a 5% 10-Year: Why the Next Liquidity Cycle May Arrive Faster
The Federal Reserve just raised the federal-funds target to 3.75%–4.00% while the 10-year Treasury closed at 5.01%, the 30-year at 5.35%, and the real 30-year at 3.09%. Pattern Nexus correctly identified the September hike risk and the developing QE/liquidity cycle, but underestimated the Fed’s willingness to raise rates against an already enormous debt and refinancing burden. This report asks the question almost nobody asks after a rate decision: what does the hike eventually break? It connects the September decision to the $40-trillion-plus federal debt structure, more than $1 trillion of annual federal net interest expense, Treasury issuance, long-end buybacks, Federal Reserve reserve-management purchases, hedge-fund leverage, the Treasury basis trade, private credit, housing, commercial real estate, household cashflow and the 2019 repo-market precedent. The conclusion is not that the Fed has deliberately chosen to create a crash. It is that monetary architecture now allows the Fed to tighten the price of credit while separately protecting reserves and market plumbing. The hike therefore does not invalidate the Pattern Nexus QE thesis. If long rates remain near current levels, it accelerates the transmission mechanism that can eventually force the next phase of liquidity support.
Published Sep 17, 2026 Article · related
QE 2026, Phase Two: When the Long End Forces Duration Control
The Fed already ended QT and expanded Treasury holdings through bill-focused reserve-management purchases, but that repaired the reserve layer without suppressing the long end. With the 10-year Treasury at 4.95%, the 30-year at 5.37%, real long yields near the Pattern Nexus red zone, Treasury doubling long-end buybacks, and August CPI limiting conventional easing, this report calculates the probability that QE 2026 moves into a second phase. It maps the likely program, the names it may use, the dates when it could expand, and the exact yield, reserve, auction, repo, leverage, and credit conditions that could force direct duration absorption.
Published Sep 11, 2026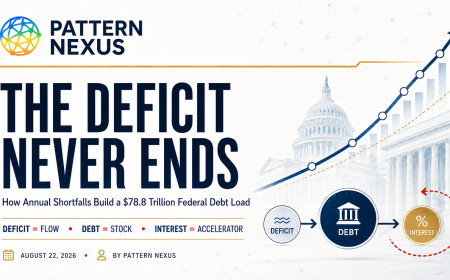 Article · related
The Deficit Never Ends: How Annual Shortfalls Build a $78.8 Trillion Federal Debt Load
Most people use “deficit” and “debt” as if they mean the same thing. They do not. This report uses two Pattern Nexus infographics and official CBO and Treasury data to map the annual federal deficit and total federal debt from 2020 through 2040, explain why interest creates a self-reinforcing feedback loop, and show why the 10-year and 30-year Treasury yields—not a political debt-clock slogan—are the market constraint that matters.
Published Aug 22, 2026 Article · related
From Liquidity Storm to Chokepoint War: Auditing 472 Pattern Nexus URLs — What Landed, What Missed, and What Comes Next
I audited the public Pattern Nexus record across 472 unique URLs and the saved full-text article export, then rebuilt the major calls from the original wording. This long-form report scores the liquidity/QT pivot, gold, the sub-3% 10-year miss, housing, stablecoin/Treasury rails, Venezuela, Iran/Hormuz, China/Taiwan, Greenland, AI power, robotics and the war economy, and finishes with a falsifiable map of what comes next.
Published Aug 20, 2026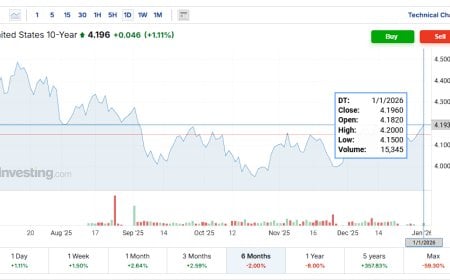 Article · related
The 10-Year Decoupling: Why Long Rates No Longer Follow Cuts
The U.S. 10-year Treasury is no longer responding to policy rate cuts. This article explains the structural decoupling between front-end easing and long-end yields, why this regime persists for months to years, and what conditions eventually force balance sheet expansion.
Published Jan 2, 2026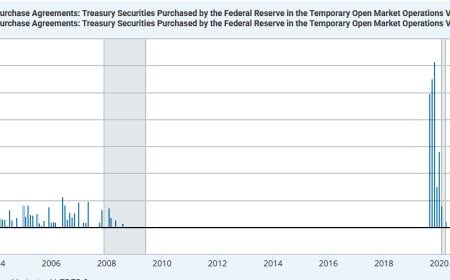 Article · related
The 10-Year Treasury Pattern and the Return of Repo Operations
The 10-Year Treasury has repeatedly stalled near long-cycle resistance while overnight repo operations have quietly returned after QT. This analysis examines how funding markets, balance-sheet capacity, and rate control interact beneath headline narratives.
Published Dec 29, 2025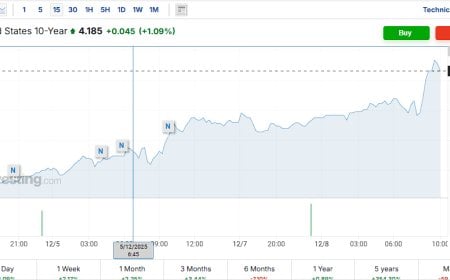 Article · related
GoGoGadget 10-Year: Why Yields Are Rising Into Rate Cuts
The U.S. 10-year just broke above the 4.15% zone even as futures price a near-certain Fed rate cut. This Pattern Nexus breakdown explains why long yields can rise into cuts, what the bond market is signaling about QT, term premium, and collateral stress, and how it fits the 2026 liquidity regime shift.
Published Dec 8, 2025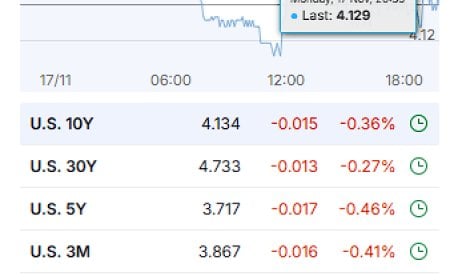 Article · related
Market Wrap – November 17, 2025: Everything Red, but the 10-Year Still Runs the Show
Broad selloff across equities, metals, and crypto, while the dollar firms and the 10-year Treasury continues to defy the Fed’s 2026 rate-cut script.
Published Nov 17, 2025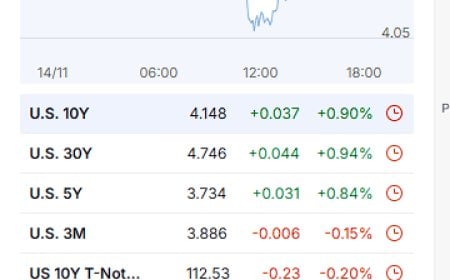 Article · related
The Weekly Market Wrap: The Week the 10-Year Stopped Listening
A volatile week across equities, bonds, commodities, and crypto. Stocks chopped, gold spiked then crashed, Bitcoin cooled off, and the U.S. 10-year Treasury defied the Fed yet again. A deep Pattern Nexus breakdown of what markets are really pricing: liquidity, deficits, AI capex, and the rising cost of capital.
Published Nov 15, 2025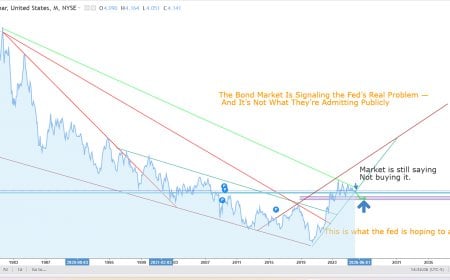 Article · related
The Bond Market Is Exposing the Fed’s Real Problem — And It’s Not Inflation
The 10-year yield reveals the Fed’s real challenge: a shrinking debt-sustainability corridor the market refuses to accept. Here’s why the system can’t stay here.
Published Nov 14, 2025 Article · related
Market Update — Nov 7, 2025: Quiet Session, Range-Bound Yields, Dollar Softens | Pattern Nexus
Stocks firmed into the Friday close as the Nasdaq dipped, volatility eased, commodities strengthened, and the 10-year yield held steady near 4.1%. A calm end to a volatile week with no major catalysts or policy developments.
Published Nov 7, 2025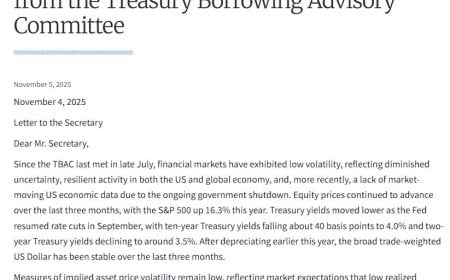 Article · related
The Treasury Just Drew Its Line in the Sand — And It’s at the 10-Year
The U.S. Treasury just made its clearest signal yet: the 10-year yield is the line in the sand. This isn’t just another bond market fluctuation — it's a structural defense of financial stability and government financing capacity. When yields approach critical levels, policy firepower follows. The era of passive markets is over — and the bond market is now the battlefield.
Published Nov 5, 2025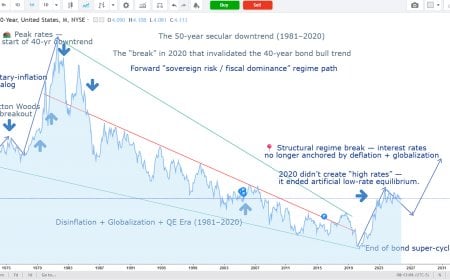 Article · related
The End of the 40-Year Bond Supercycle: Why Rates Didn’t Rise — The Regime Changed
The U.S. 10-year yield didn’t “go up” — the 40-year bond bull ended. This analysis shows how 2020 broke the secular disinflation regime and launched a sovereign-credit repricing cycle mirroring the 1970s.
Published Nov 3, 2025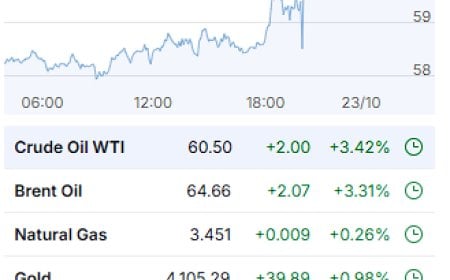 Article · related
Daily Recap – October 22, 2025: Markets Brace for a Data-Blind Fed and a Restless World
Markets wavered as the Fed faces a data blackout, gold and tech cooled off, and the Trump administration tightened sanctions on Russia while juggling crises abroad. markets, gold, 10-year yield, Fed rate cut, data vacuum, government shutdown, Trump, sanctions, Russia, Ukraine, Vance, Israel, Middle East, Nasdaq, Tesla, Netflix
Published Oct 23, 2025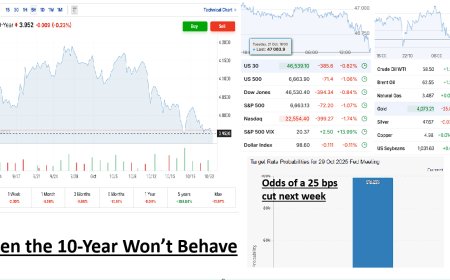 Article · related
When the 10-Year Won’t Behave: Why Markets and Gold Slipped Even With a Cut Looming
Stocks and gold pulled back even with a widely expected Fed rate cut days away. Here’s how the 10-year, earnings headlines, dollar strength, and profit-taking all intersected to drive today’s tape.
Published Oct 22, 2025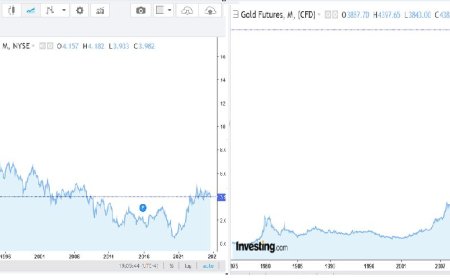 Article · related
Gold vs. the 10-Year Yield: Why Rate Cuts and Real Yields Point to the Next Inflation Wave
Gold is breaking new highs while the U.S. 10-year yield stalls near 4%. History shows gold moves first — and yields follow. Explore how falling real rates, policy shifts, and inflation expectations are aligning to signal the next major cycle in global markets.
Published Oct 20, 2025