

liquidity regime
Automatically indexed from the existing article tag.
Theses, forecasts, models, and paths
No published research objects yet
This topic is ready for editors to connect a thesis, forecast, model, or research path.
Latest articles
 Video · related
The Dollar Fortress — Audio-Video Edition
Episode 2 of the Pattern Nexus Audio-Video series explains how Bretton Woods, the Marshall Plan, capital controls, the IMF, the World Bank, and the 1951 Treasury–Federal Reserve Accord forged the first dollar-liquidity regime between 1947 and 1953.
Published Aug 16, 2026 Article · relatedThe Sun, Liquidity, and Financial Turning Points: The Regression Missed the Regime
A corrected Pattern Nexus analysis of solar cycles, liquidity, recessions, and financial tops from January 1987 through July 2026. The first monthly regression rejected a short-horizon trading signal. The properly specified regime test found that all four U.S. recession onsets in the sample occurred within twelve months of an official solar maximum or minimum, recession months were sharply concentrated around those extrema, and M2 growth was faster on official solar rising legs.
Published Aug 10, 2026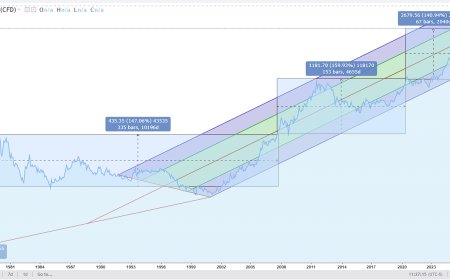 Article · related
Gold Isn’t Breaking Out — It’s Absorbing Policy Failure
Gold’s long-term rise is not a speculative breakout or inflation panic. It reflects repeated policy constraint, failed normalization, and the permanent reintroduction of liquidity to preserve funding stability. This report explains why gold has become system infrastructure inside the modern liquidity regime.
Published Dec 26, 2025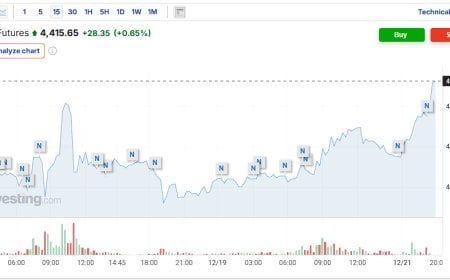 Article · related
Gold Didn’t Moon — It Repriced
Gold didn’t fail or stall after QT ended — it repriced early and is now consolidating at a higher structural level. An updated Pattern Nexus breakdown on gold’s role in the current liquidity regime.
Published Dec 21, 2025 Article · related
The Convergence: AI, Energy, and the Final Liquidity Regime (2020–2045?)
The last 150 years built an industrial machine, a dollar fortress, offshore dollar webs, a global leverage cycle, and a QE-driven digital dollar stack. Part 10 of the Pattern Nexus megaseries ties the arc together and maps where it’s likely heading next: an AI–energy industrial core, programmable dollars, hard-asset politics, and a final liquidity regime that decides who gets to adapt — and who gets left behind.
Published Dec 10, 2025 Article · related
The Fiscal-Monetary Fusion: Pandemic Money, Inflation Whiplash, and the Militarized Liquidity Regime (2020–2025)
COVID didn’t just trigger stimulus — it fused fiscal and monetary policy into a single war machine. Between 2020 and 2025, governments and central banks ran coordinated mega-deficits, bought their own debt at scale, ignited the first real inflation shock of the QE era, and then slammed rates higher into a fragile, over-financialized system — all while AI, energy constraints, and a new cold war turned liquidity into an explicit weapon.
Published Dec 8, 2025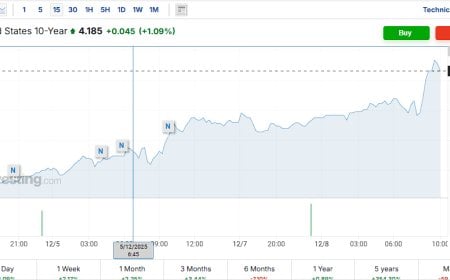 Article · related
GoGoGadget 10-Year: Why Yields Are Rising Into Rate Cuts
The U.S. 10-year just broke above the 4.15% zone even as futures price a near-certain Fed rate cut. This Pattern Nexus breakdown explains why long yields can rise into cuts, what the bond market is signaling about QT, term premium, and collateral stress, and how it fits the 2026 liquidity regime shift.
Published Dec 8, 2025 Article · related
The Asian Liquidity Supercycle: How Deregulation, Dollar Flows, and the Tech Boom Rewired Global Finance (1994–2001)
Between 1994 and 2001, the world entered a new liquidity regime driven by capital account liberalization, dollar-denominated borrowing, export surpluses, and the explosive rise of technology markets. From the Tequila Crisis and Asian Financial Crisis to the dot-com bubble, this era created the modern global liquidity supercycle — and exposed its fault lines.
Published Dec 4, 2025 Article · related
The 10-Year Isn’t Misbehaving — It’s Warning the System Is Out of Liquidity
The U.S. 10-year yield is rising into rate cuts — not because the market is irrational, but because the financial system is operating on the liquidity floor. This article explains how regional bank failures, QT exhaustion, and the September 18, 2024 rate-cut pivot created the wedge pattern now signaling the next major regime shift.
Published Dec 2, 2025 Article · related
Can the 10-Year Treasury Predict Recessions? A 40-Year Pattern Nexus Lens Analysis
A 40-year structural analysis of the US 10-Year Treasury futures market, showing how recessions consistently collide with long-term yield channels, why yield curve inversions continue to matter, and what today’s setup means for the next macro cycle. A full Pattern Nexus Lens breakdown.
Published Nov 20, 2025 Article · related
America’s New Map of Power: Data Centers, Grid Shortfall, and the AI Industrial Build-Out
A single map of U.S. data centers reveals the real AI-industrial build-out: clustered power demand, a 40–50 GW grid shortfall, forced nuclear restarts, and a new liquidity regime that makes QE-style support inevitable.
Published Nov 13, 2025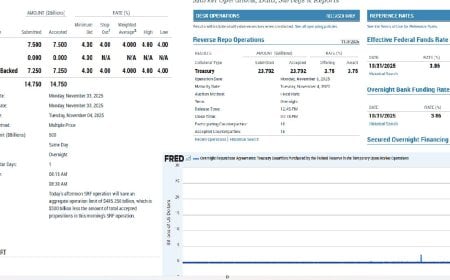 Article · related
The Quiet Repo Surge: $14.75B SRF Tap + $30B Liquidity Pulse Signals the New Regime
In three trading days, the Fed silently pushed nearly $45B through the repo window — including a $14.75B SRF tap and a ~$30B overnight repo spike. This wasn’t panic. It was collateral lubrication for America’s reindustrialization cycle — compute, power, copper, grid. The new liquidity regime is here.
Published Nov 3, 2025