

Data Analysis
Automatically indexed from the existing article tag.
Theses, forecasts, models, and paths
No published research objects yet
This topic is ready for editors to connect a thesis, forecast, model, or research path.
Latest articles
 Video · related
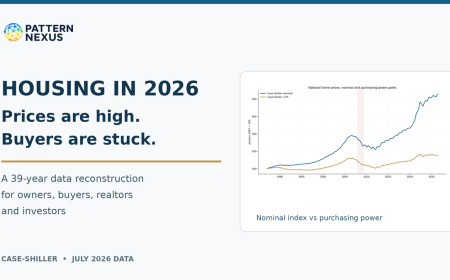
Housing in 2026: Prices Are High, but the Market Is Barely Moving
The July Case-Shiller index reached another nominal high, but inflation, financing costs and weak sales tell a different story for the marginal buyer. Pattern Nexus reconstructs national prices from 1987, tests pre-2008 and 2019 inventory baselines, separates vacant homes for sale from rental vacancies, compares a 2019 and 2026 purchase payment, checks credit and construction, maps metro divergence and scores earlier PN housing claims. Includes 18 original charts and a practical guide for housing stakeholders.
Published Sep 30, 2026 Article · related
The Capital Ladder: Where $100 to $1 Trillion Places You in the Global and American Wealth System
A deep Pattern Nexus regression and data analysis mapping where net worth levels from $100 to $1 trillion place an individual within the global and American wealth distributions. The research separates actual net worth from liquidity, accessible credit, gross capital control, leverage, and daily capital-producing capacity. Where do you actually sit within the global wealth system—and how does that position change when we measure not only what you own, but how much capital you can access? This research maps wealth levels from $100, $500, and $1,000 through $1 million, $1 billion, $100 billion, and the theoretical $1 trillion threshold. Global and American wealth distributions are analyzed separately using regression models, percentile estimates, Federal Reserve household data, international wealth-distribution research, and 17 original charts and visualizations. The analysis distinguishes net worth from liquid wealth, available credit, collateral-backed borrowing capacity, and gross capital controlled. It then models how productive leverage can accelerate wealth growth, how destructive leverage can erase equity, and how much daily capital output different levels of wealth may generate. Net worth measures ownership. Liquidity measures deployability. Credit measures reach. Leverage amplifies the result. Capital efficiency determines whether that amplification creates wealth or debt.
Published Jul 10, 2026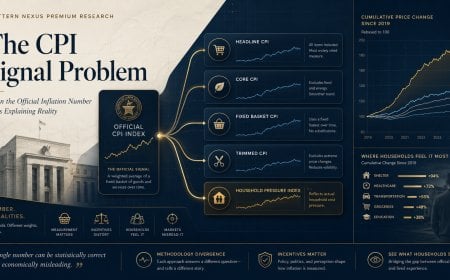 Article · related
The CPI Signal Problem: When the Official Inflation Number Stops Explaining Reality
A Pattern Nexus data analysis audit using official BLS CPI data from 1960 through April 2026 to compare headline inflation against fixed-basket, current-method, and trimmed-basket frameworks.
Published Jun 10, 2026