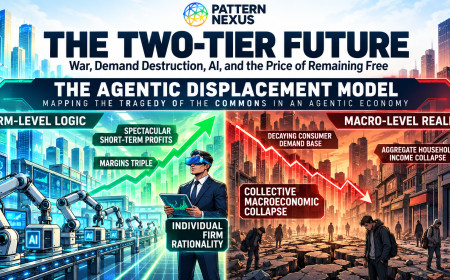
For years, I followed pieces of a possible two-tier economic future, then moved away from believing they would come together. In September 2026, the Iran oil shock, Ukraine refinery attacks, demand destruction, long-rat…
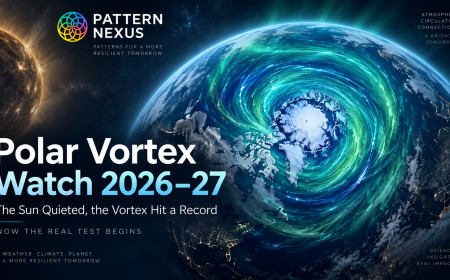
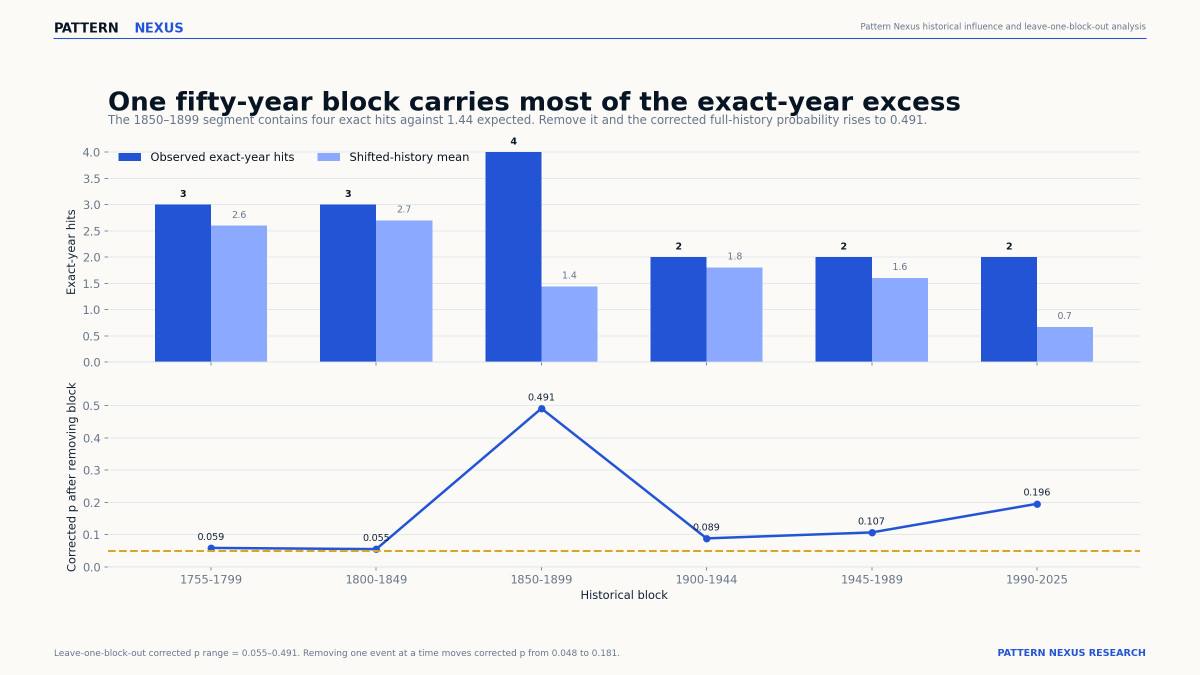
The early-season Arctic vortex has now crossed from unusual into a verified date-matched record at 10 hPa. At the same time, NOAA reports very low solar activity and weakening coronal-hole high-speed-stream forcing, whi…
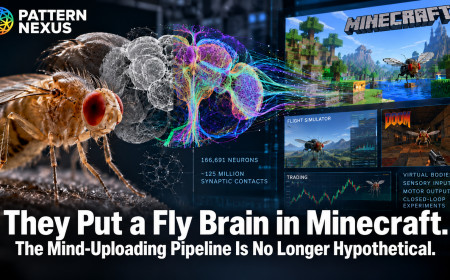
A complete fruit-fly central nervous system can now be mapped at synaptic resolution, instantiated as a computational network and wired into virtual worlds. Minecraft, Doom and flight-controller demos are not digital fl…
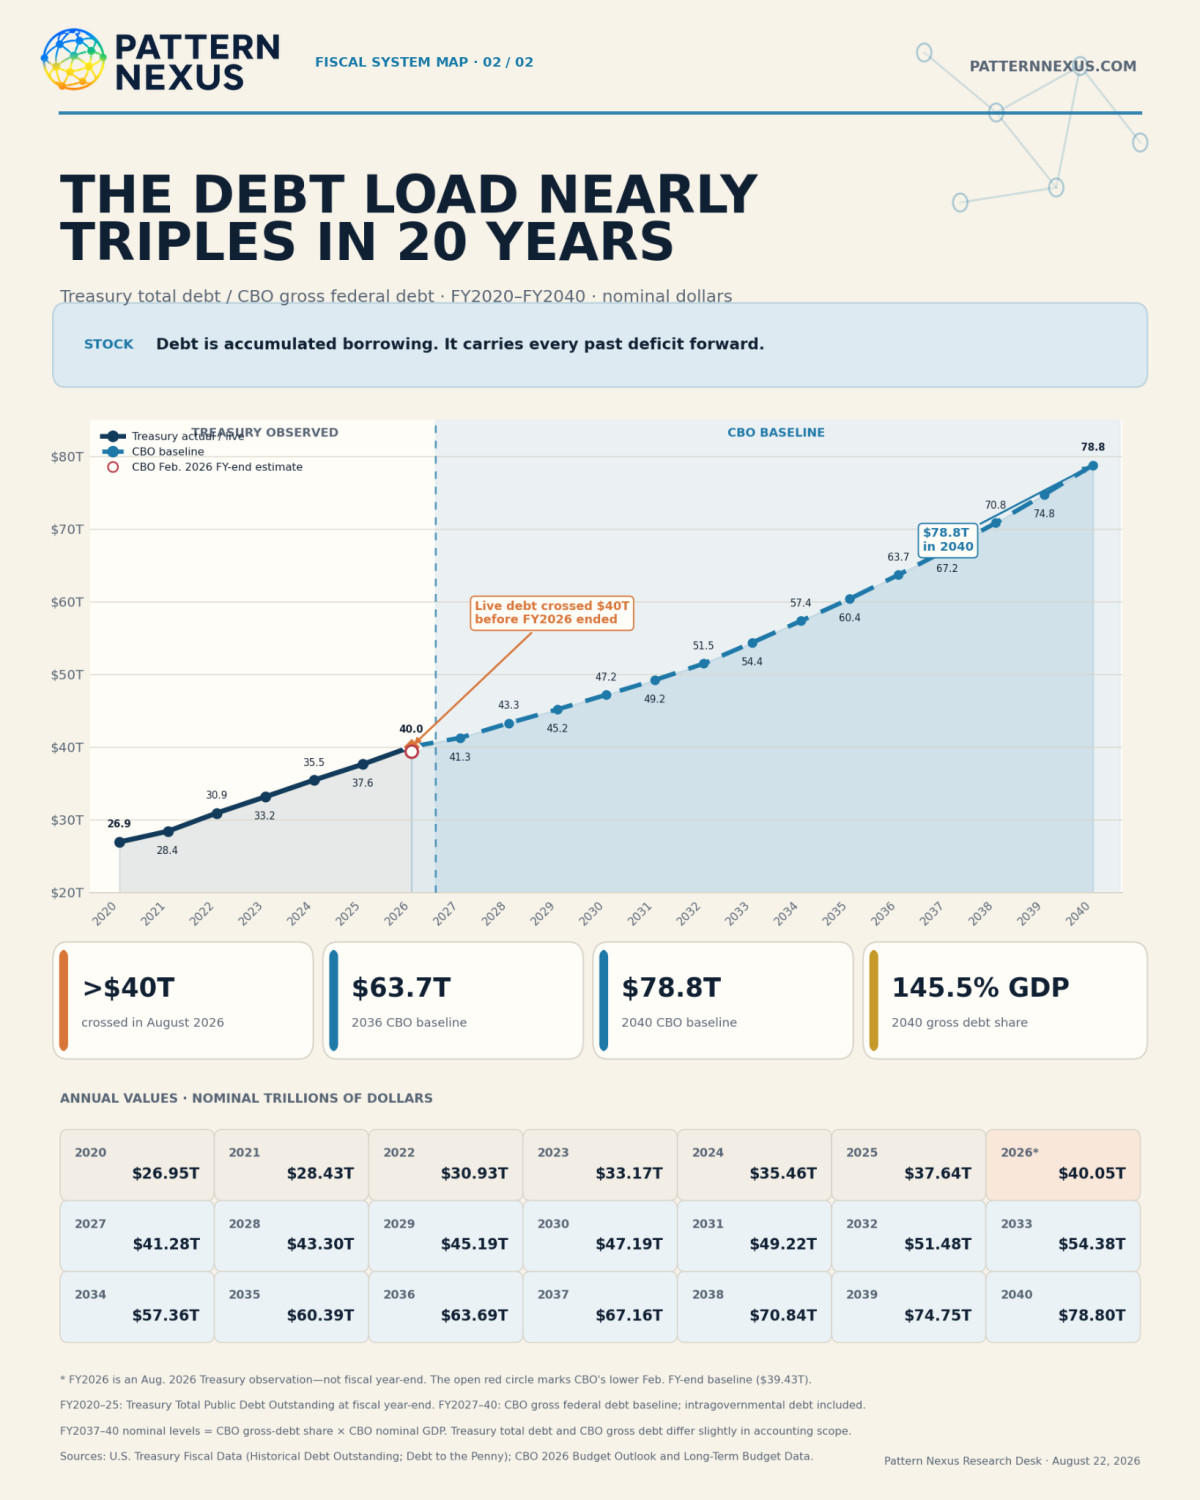
The Fed already ended QT and expanded Treasury holdings through bill-focused reserve-management purchases, but that repaired the reserve layer without suppressing the long end. With the 10-year Treasury at 4.95%, the 30…
Context
62% relevance · 15 cited sources · 2 assets
Updated
Sep 11, 2026
Open original research and sources →Figure 1. Actual deficits for 2020–2025, CBO’s updated 2026 estimate, the February baseline for 2027–2036, and Pattern Nexus calculations for 2037–2040 using CBO’s published deficit share of GDP and nominal GDP series.Chart-led research
Most people use “deficit” and “debt” as if they mean the same thing. They do not. This report uses two Pattern Nexus infographics and official CBO and Treasury data to map the annual federal deficit and total federal de…
Context
62% relevance · 7 cited sources · 1 asset
Updated
Aug 22, 2026
Open original research and sources →Figure 1. The core proxy follows the centre issuing the dominant settlement asset and hosting the deepest cross-border financial network. It is not presented as literal world GDP.Chart-led research
I rebuilt the solar-recession thesis around the dominant global financial core instead of a modern U.S. sample: Amsterdam and the guilder, London and sterling, then New York and the dollar. Across 375 years, the data re…
Pattern Nexus is researched, written, coded, and operated by one person for more than 80,000 monthly readers. This guide explains free registration, Premium access, the Pattern Nexus Worldview book, direct donations, an…
AI companies are assembling a cognitive-and-physical labor system designed to outscale human work. This forecast maps the 6–18 month robotics crossover, three displacement paths, the break in wage-based demand, and the …
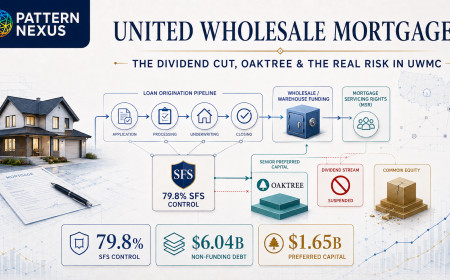
I rebuilt the UWM panic from the ownership structure outward: who actually received the distributions, what the dividend suspension retains, why the $451.9 million quarterly loss does not describe the core origination b…
Context
62% relevance · 16 cited sources · 2 assets
Updated
Aug 8, 2026
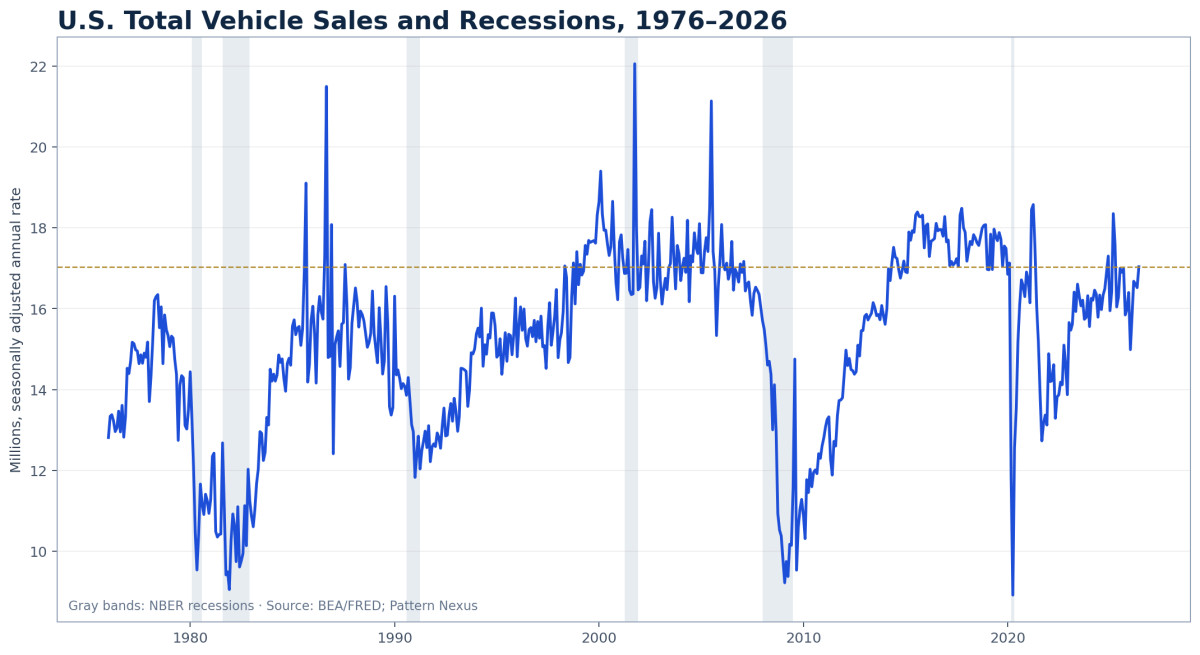
Open original research and sources →Figure 1. Total vehicle sales and NBER recessions. Sales weaken in every recession, but supply shocks, strikes, policy changes and temporary rate shocks can produce non-recession declines. Source: BEA, NBER/FRED and Pattern Nexus calculations.Chart-led research
Vehicle sales normally weaken before recession becomes obvious elsewhere. Pattern Nexus reconstructs every U.S. recession since 1976, builds auto-only and cross-channel recession models, audits prices, financing, delinq…
Context
62% relevance · 15 cited sources · 1 asset
Updated
Sep 13, 2026
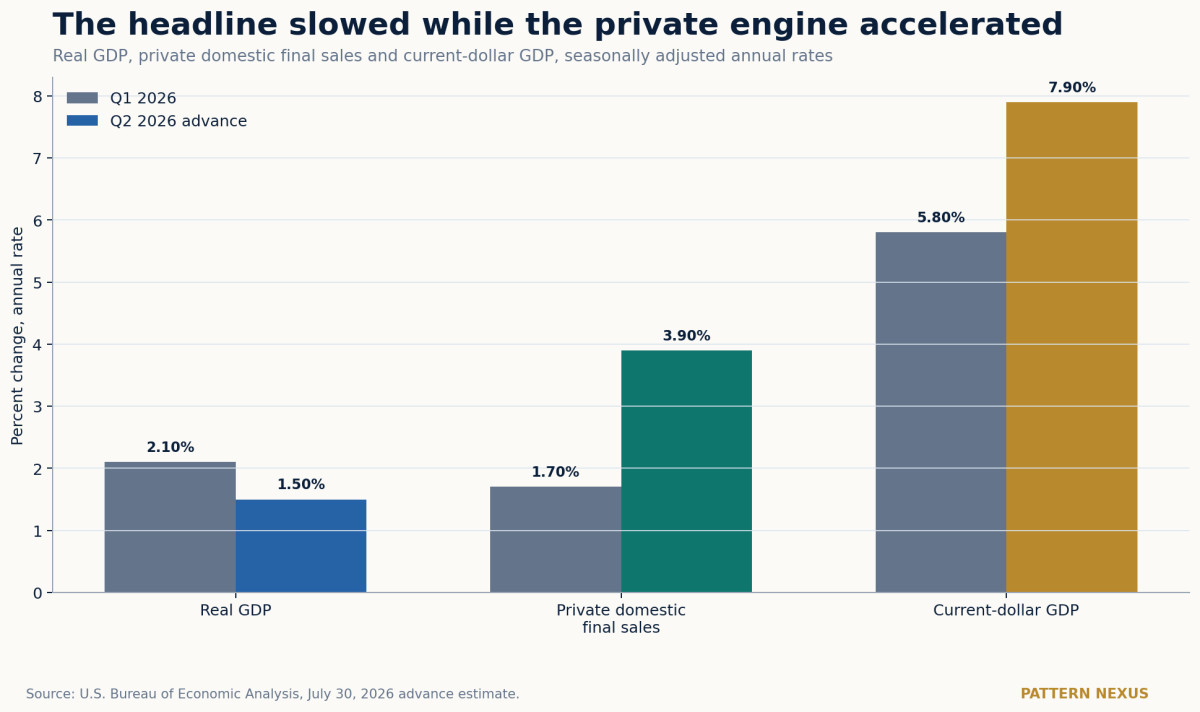
Open original research and sources →Figure 1. Real GDP slowed, but the private domestic engine and current-dollar economy accelerated. Source: BEA; Pattern Nexus chart.Chart-led research
Real GDP slowed to a 1.5% annual rate in Q2 2026, but the private domestic economy accelerated to 3.9% while nominal GDP grew 7.9%. This Pattern Nexus analysis separates the headline from the internal economy and explai…
Context
62% relevance · 6 cited sources · 1 asset
Updated
Aug 4, 2026
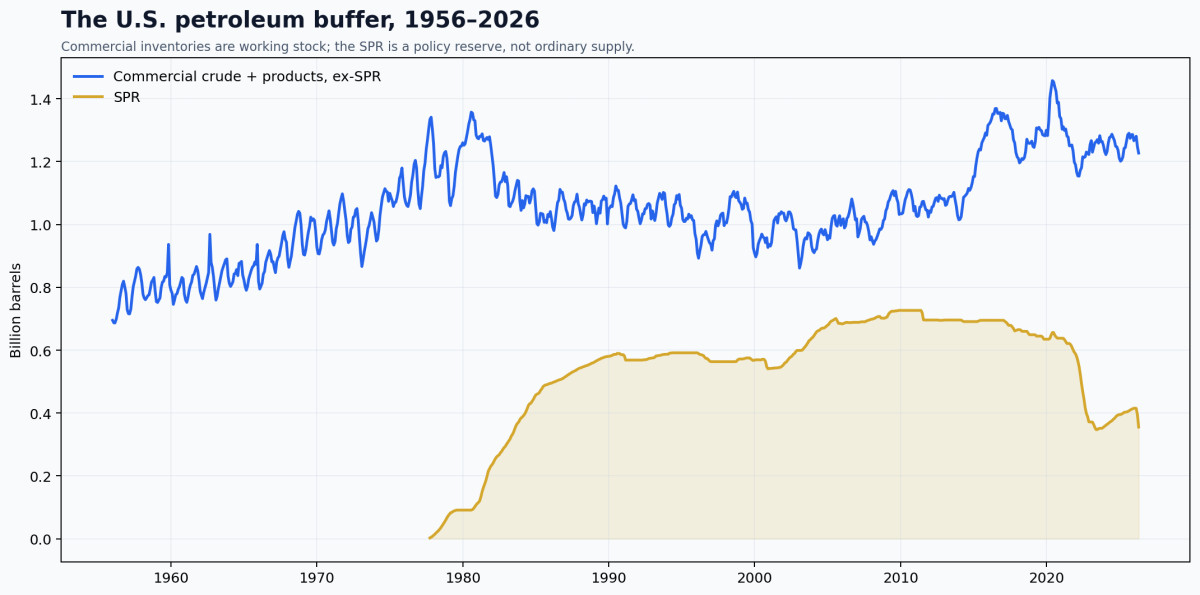
Open original research and sources →Figure 1. U.S. commercial crude and product inventories excluding the SPR, with the SPR shown separately. Source: EIA; Pattern Nexus calculations.Chart-led research
A full Pattern Nexus reconstruction of U.S. and global oil inventories from the 1970s through the 2026 war shock, including original regressions, depletion scenarios, strategic reserves, refinery constraints, inflation,…
If Pattern Nexus has been useful to you, help keep it growing.
Pattern Nexus is independently built and operated.
Most of the research remains publicly available,
but the data, servers, tools, research and time behind it all
have real costs.
Books, memberships and direct support help fund the next stage
without putting everything behind a paywall.