
Polar Vortex Now: Stratospheric Deformation, NatGas Risk, and the ERCOT Night-Ramp Stress Test
A unified live update tying today’s polar vortex structure (10 hPa), surface cold delivery, and ERCOT’s real-time constraints into the NatGas risk frame and the broader Pattern Nexus circulation-control model.
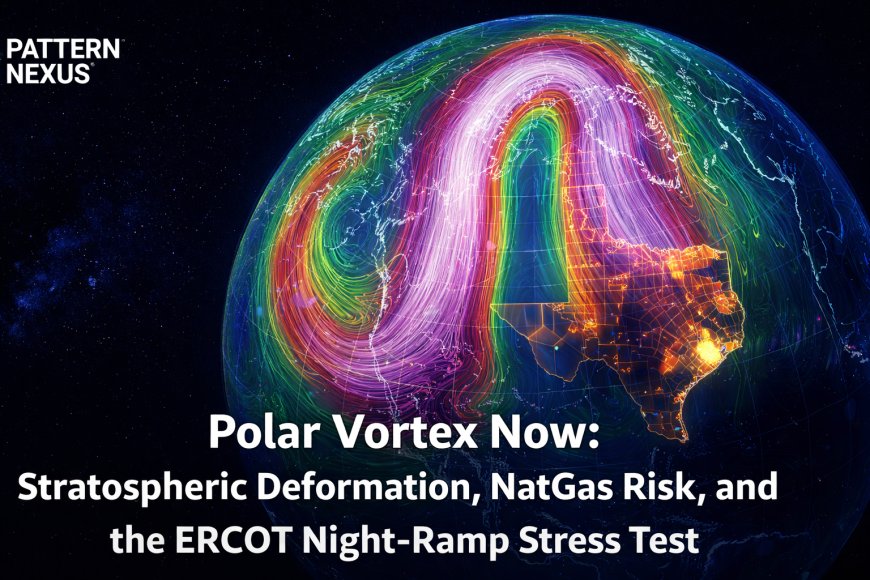
![[HERO_IMAGE_ALT: Polar vortex deformation over the Arctic linked to Texas grid stress]](https://patternnexus.com/uploads/images/202601/image_870x_697511c894bd7.jpg)
Midday grid stability can coexist with real outages and real night risk. Solar and wind can mask stress until the evening regime arrives: solar goes to zero, wind can fade or swing, heating load ramps, and forced outages suddenly matter. The polar vortex is upstream of that regime risk because it shapes the cold delivery pattern that drives demand and exposes fuel fragility.
This piece ties three prior Pattern Nexus articles into one live chain with current snapshots and ERCOT evidence.
The polar vortex is a constraint layer. When it deforms at 10 hPa, the probability of a leaky, meridional jet regime rises. That translates into surface cold delivery, then into demand shock, then into fuel and grid buffer compression. It is one system with multiple layers.
The Thread: What This Consolidates
The earlier vortex pieces were not “weather content.” They were an attempt to track an upstream control surface and map it forward into real constraints: natural gas volatility, regional basis stress, and grid reliability windows.
The circulation/control-system piece added the deeper frame: averages are narrative. Regimes are reality. A system can shift into more volatile states even if a single headline metric (like “mean temperature”) moves in one direction.
This article merges those frameworks into one live chain with current snapshots and ERCOT dashboard evidence. The goal is to keep this understandable while staying honest about uncertainty: we can’t “know” the next move, but we can map buffers, ramps, constraints, and thresholds.
Live Snapshot: Jan 24, 2026
Today is a clean demonstration of why institutions can sound “right” and still be useless. People are losing power while the system can still be stable in the grid-physics sense. Those are not contradictions. They are different layers of the same machine.
- Outages are real and large in generation terms, which matters for the evening regime.
- Reserves can still look healthy midday, especially when wind and solar are carrying load.
- The risk window is later when solar goes to zero and heating demand ramps.
- Markets often front-run the risk via scarcity pricing and day-ahead ramps.
The rest of this article is simply mapping that chain: vortex geometry to surface delivery to gas and grid constraints.
Polar Vortex Now: 10 hPa Geometry
This is not a clean, symmetric, pole-centered donut. The structure is stretched and displaced, with a pronounced elongated circulation corridor that hints at a leaky regime and lobe organization. That does not guarantee a split event. It does mean the containment ring is not “quiet.”
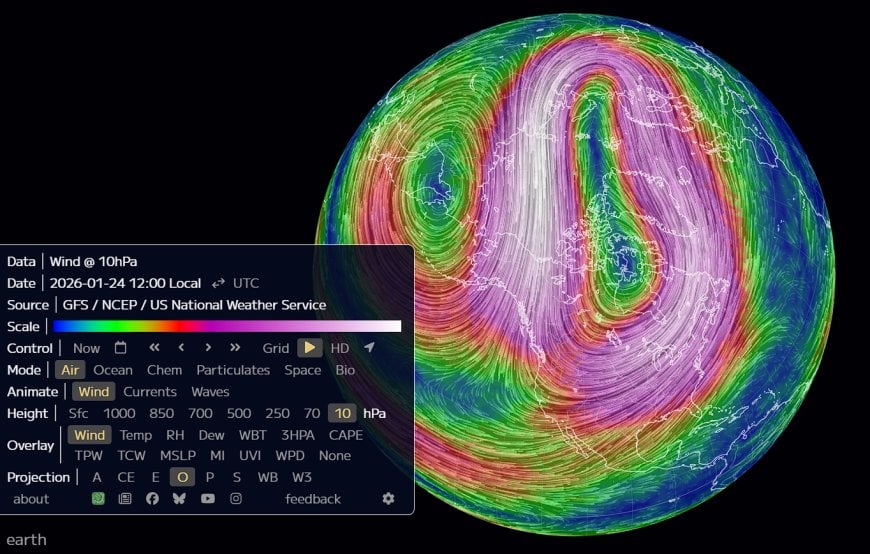
The practical takeaway is simple: when the upper structure is distorted, downstream regimes become more likely to wobble into meridional flow patterns that deliver cold southward and stress energy systems.
Surface Delivery: Where the Cold Actually Landed
The surface snapshot is the translation layer. The stratosphere sets the regime bias. The troposphere and surface show where the cold actually arrived, and therefore where demand shock and infrastructure stress are most likely to show up.
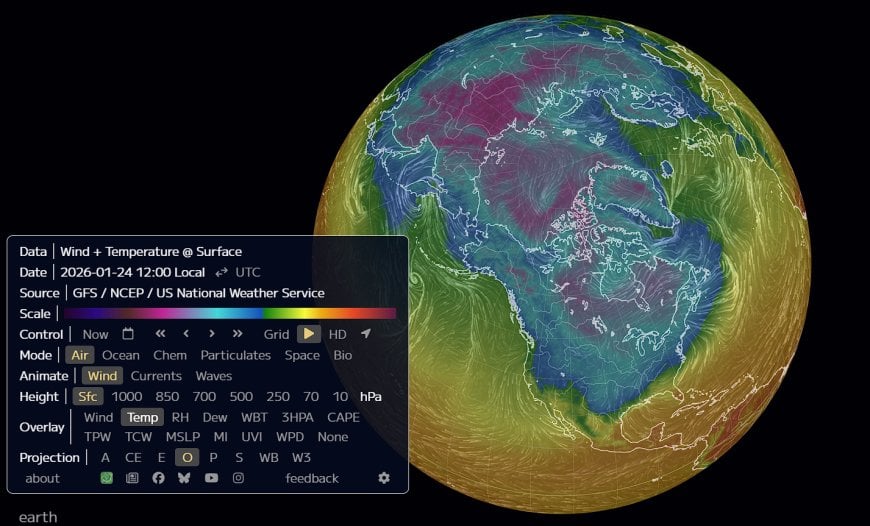
For energy, the cold is never just “cold.” It is load, it is gas deliverability, it is equipment performance, and it is a volatility multiplier.
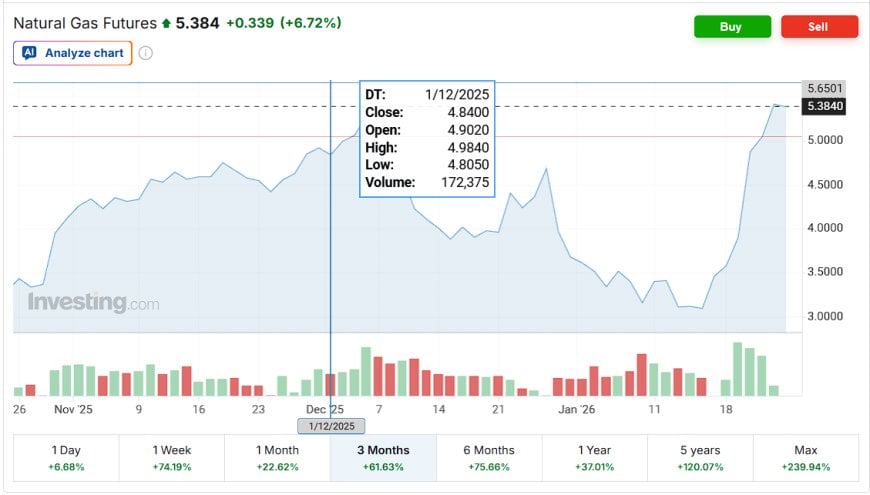
Energy Translation: NatGas Risk and Basis Reality
The NatGas risk frame is not “buy cold.” It’s a constraint and volatility setup. Cold outbreaks can spike demand while simultaneously degrading supply deliverability through freeze-offs, pressure drops, and localized infrastructure issues. That combination is why gas and power can jump nonlinearly.
The public argues about the headline price. Operators and traders watch basis and deliverability. The question is not “how cold,” it’s “how constrained.”
- Demand shock increases load and heating pull
- Supply fragility reduces deliverable volumes even if theoretical capacity exists
- Basis stress appears where pipes, compressors, and local constraints bind
- Power becomes the downstream expression of all of it
ERCOT: The Night-Ramp Stress Test
Texas is the cleanest case study because it is structurally constrained: limited interties, steep evening ramps, and heavy dependence on dispatchable response once solar drops.
The most important mental model is regime switching. Midday conditions do not tell you the evening risk. Midday is often the mask. Night is the test.
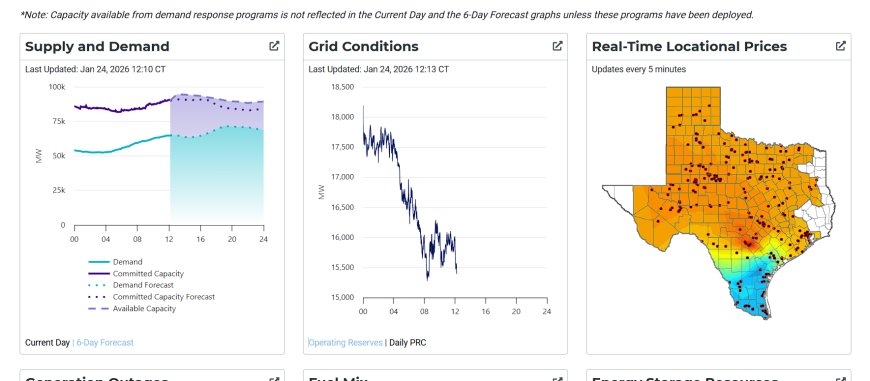
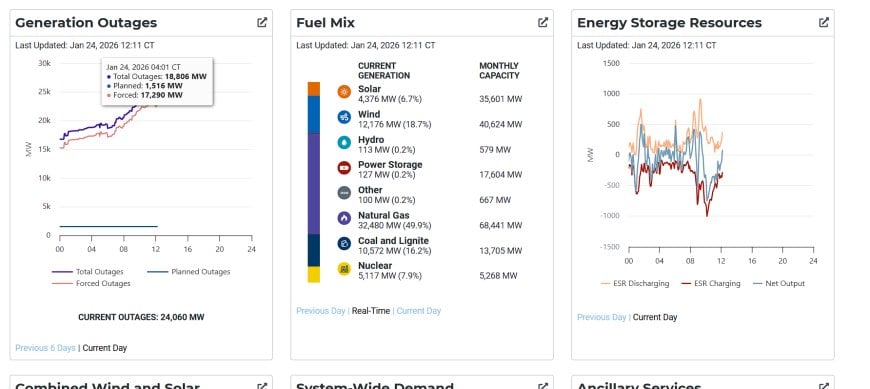
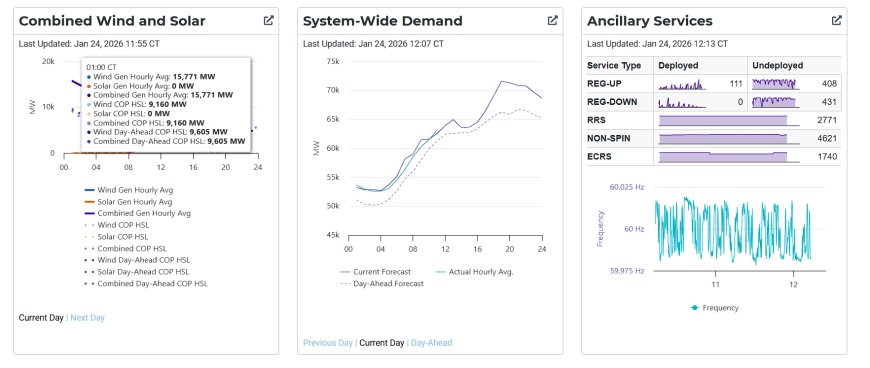
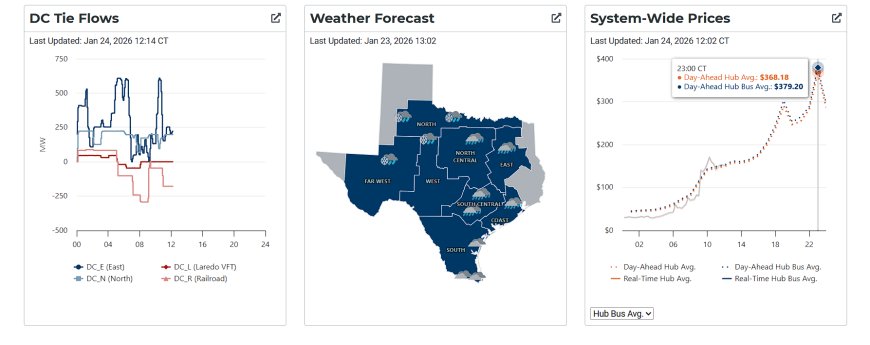
This is why the conversation gets confused. People see “the grid is fine” and then see outages and assume somebody is lying. The system can be stable while many components fail, especially distribution-level failures and localized constraints. The question is whether reserves compress into emergency behaviors when the evening regime arrives.
Signals to Watch Tonight
If you want one clean dashboard checklist for the evening window, it is this. These are the signals that map to constraint behavior.
- Wind persistence after sunset (does it hold, fade, or swing)
- Solar cliff (it goes to zero, the question is what replaces it)
- Operating reserves trajectory (the buffer compresses fast when ramps hit)
- Forced outage trend (flat is survivable, rising is danger)
- Ancillary headroom (how much control margin remains)
- Frequency behavior (tight oscillation vs sustained stress signatures)
- Prices (scarcity pricing is not proof of collapse, it is a real-time fear gauge)
The main risk stack is straightforward: forced outages plus a weak wind regime plus an evening load ramp. If those three align, reserves compress and ERCOT shifts from normal operations into emergency management.
Climate as Circulation: The Control-System Frame
This is why the “warming vs cooling” debate is low-resolution. The system risk is dominated by circulation regimes, coupling between layers, and the frequency of shock patterns that land on infrastructure.
The stratosphere matters because it influences the persistence and geometry of winter regimes below. When the polar containment structure is distorted, the downstream flow can become more meridional, more variable, and more capable of delivering cold into places where energy systems are not built for prolonged constraint.
In control-system terms, we are watching the upstream controller wobble, then watching downstream systems burn buffer to stay stable.
Scenario Stack: What This Pattern Can Do Next
This is the honest way to frame it without pretending certainty. These are regime outcomes, not single-point forecasts.
Scenario 1: Contained wobble
Upper-level deformation persists but coupling is weak. Cold is episodic. Markets overreact and then fade. ERCOT sees stress pockets but holds reserves comfortably.
Scenario 2: Downward coupling and persistence
The regime shifts into a more persistent meridional pattern. Cold delivery expands. Energy volatility increases through repeated ramps. ERCOT spends more time near buffer thresholds.
Scenario 3: Coupling plus infrastructure fragility
Cold coincides with higher forced outages and fuel deliverability issues. The system does not “collapse” as one dramatic moment. It enters constraint behaviors: conservation calls, demand response, scarcity pricing, and targeted outages where weak nodes fail.
Pattern Nexus Lens
The polar vortex is upstream control geometry. ERCOT is downstream constraint management. Between them sits the delivery layer: jet regime and surface pattern. Once you see that chain, the contradictions disappear. “Stable frequency” and “people losing power” can coexist. The system can be stable while components fail. The question is always the buffer: how much reserve margin remains when the regime switches at night.
FAQ
Does deformation guarantee a split?
No. Deformation is a stress signature. It changes probabilities and increases regime volatility potential. The critical part is whether disruption couples downward and how lobes organize.
Why focus on 10 hPa?
It is a clean diagnostic layer for polar circulation structure. It shows containment versus distortion without surface noise.
Why tie this to ERCOT?
Because ERCOT is a stress-test lab. Limited interties and steep evening ramps make constraint behavior visible in real time.
Is this a repeat of 2021?
Do not anchor on one historical event. Track reserves, outages, wind persistence, and deliverability. Those are the regime truth signals.
Sources
- Pattern Nexus: Polar Vortex Deformation (Dec 2025)
- Pattern Nexus: Polar Vortex Watch Part 2 (NatGas risk frame)
- Pattern Nexus: Climate as Circulation (control-system frame)
- ERCOT: Public dashboards (grid conditions, reserves, prices, outages)
- earth.nullschool.net (GFS/NCEP visualization used for snapshots)
Institutions talk in forecasts. Systems operate in regimes. If you want early warning, you watch control geometry and buffers. The vortex is upstream geometry. ERCOT reserves are downstream buffers. The night ramp is where theory meets constraint.
Qual è la tua reazione?
 Mi piace
0
Mi piace
0
 Non mi piace
0
Non mi piace
0
 Amore
0
Amore
0
 Divertente
0
Divertente
0
 Wow
0
Wow
0
 Triste
0
Triste
0
 Arrabbiato
0
Arrabbiato
0

Founder of Pattern Nexus. I research markets, macro, geopolitics, AI, history, ancient systems, and the patterns most people overlook. I’m also building Market Radar, a trading scanner designed to read pressure, risk, confirmation, and setup quality before chasing a move. Pattern Nexus is where I connect the dots between data, history, technology, and the bigger system playing out around us.













Commenti (0)