
Feb 26, 2026 Tape: Nvidia Blinks, Tariff Chaos Returns, and the Curve Quietly Flattens
Tech sold off even after Nvidia “beat,” VIX woke up, tariffs re-entered the equation, and the yield curve steepened. Here’s the systems-level read-through, plus the underbelly: private credit, multifamily stress, and BNPL drift.
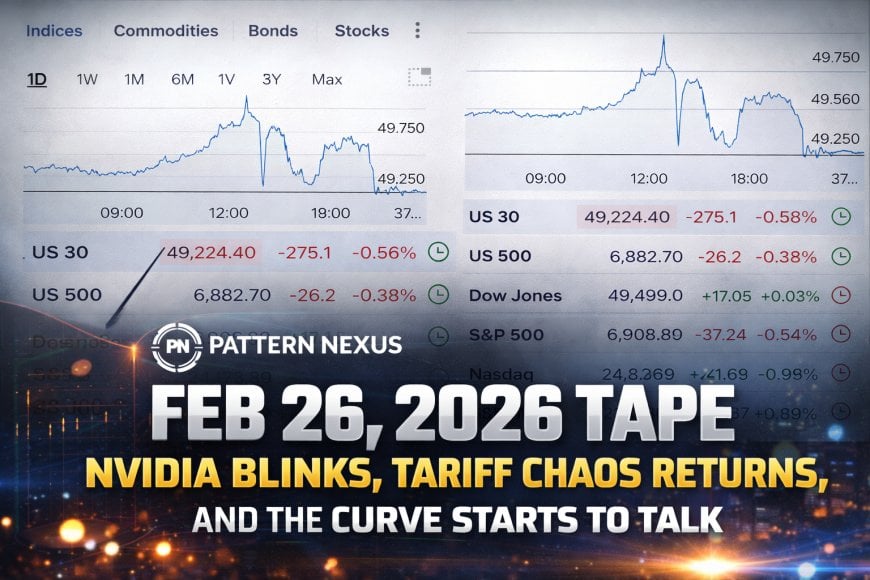

Today was a clean signal day inside a loud headline world. Nasdaq rolled and Nvidia got hit even after a beat because the AI trade is entering the “prove it” phase. VIX woke up. Gold and silver stayed bid. The 10Y drifted down into ~4% while the front end stayed sticky, and the curve flattened across the week (10s2s compressed roughly from +72 bps on 02/02 to about +60 bps on 02/26; 10s3m compressed roughly from +60 bps to about +34 bps). Meanwhile the Supreme Court tariff hit re-opened policy uncertainty, oil stayed hostage to U.S.–Iran risk premium headlines, and the real stress layer is still where it’s been: opaque credit and non-bank leverage (private credit), multifamily refi math, and consumer payment rails drifting worse at the margin.
When the “best company in the best theme” beats and still gets sold, you’re not watching fundamentals anymore. You’re watching positioning and expectations unwind.
Tariff policy uncertainty is not “politics.” It’s a volatility injector into rates, FX, margins, and capex planning. The system hates rule ambiguity.
Private credit is modern shadow risk: big enough to matter, opaque enough to surprise. When it breaks, it won’t announce itself. It will show up as funding stress, forced selling, and sudden repricing.
The Snapshot: What the Screens Said
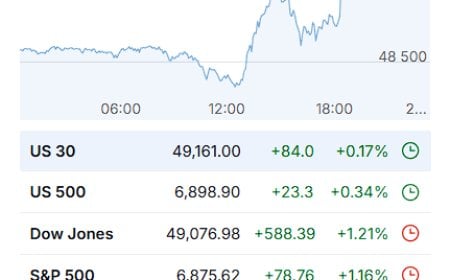
I’m starting with the raw tape because it matters more than anyone’s narrative. The screens show a classic “tech-led risk-off pulse” with everything else acting more measured. That’s not a meltdown. That’s a crowded expression getting repriced.
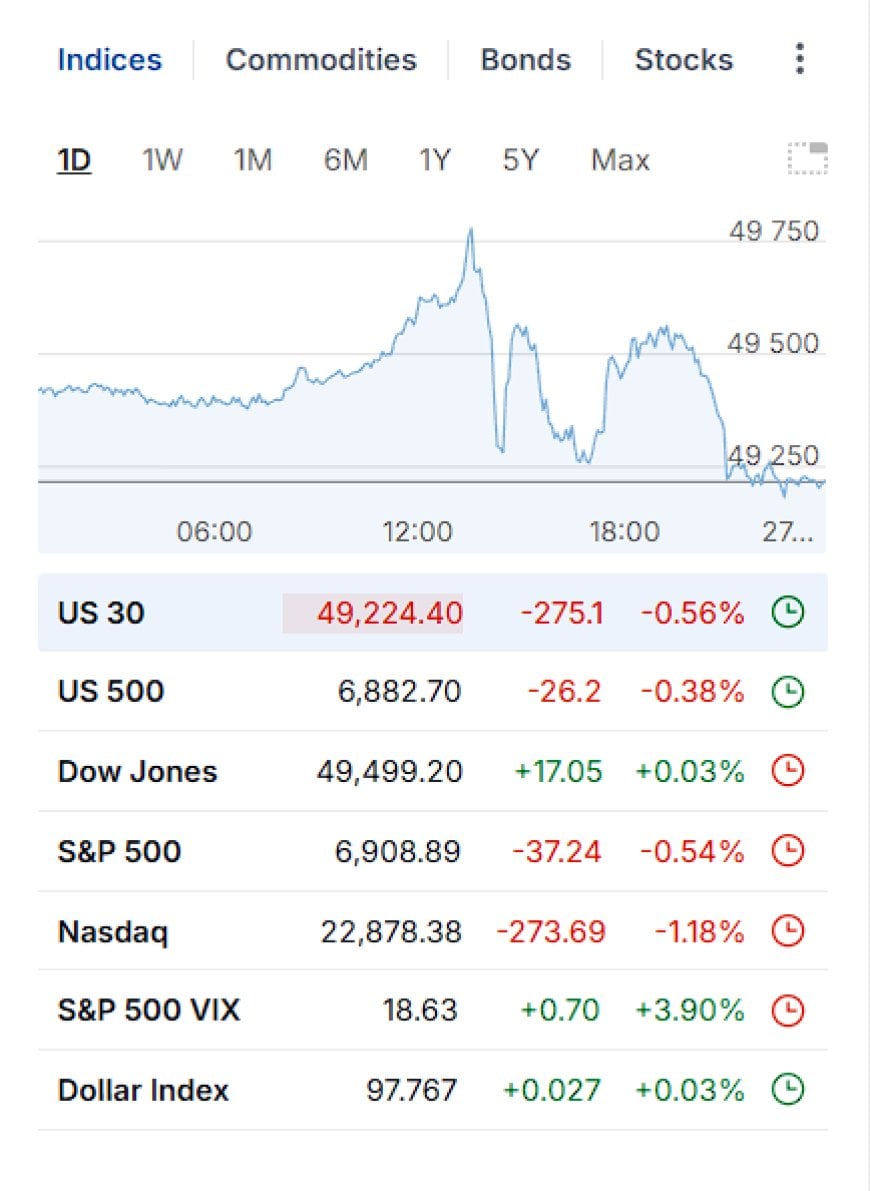
Key tells from that panel: Nasdaq is the stress barometer right now, not the Dow. VIX rising toward the high-teens is a complacency check, not a panic event. DXY not ripping tells you this wasn’t a full “flight to USD” liquidation, more like controlled de-risking where the market sells what it’s crowded in.
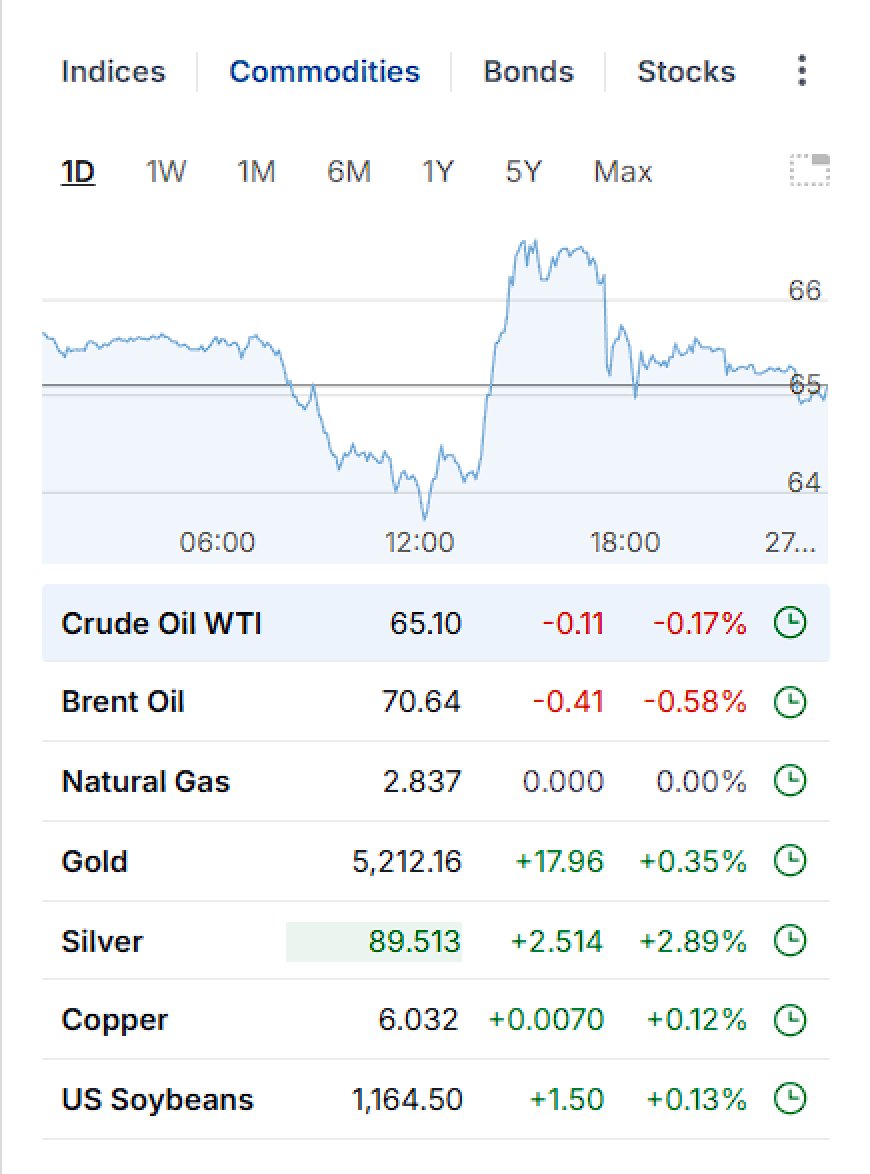
Gold holding up while tech bleeds is not “doom porn.” It’s hedging behavior. Silver is the louder tell: when silver starts acting like a volatility/liquidity hedge instead of a sleepy industrial cousin, the system is pricing regime uncertainty.
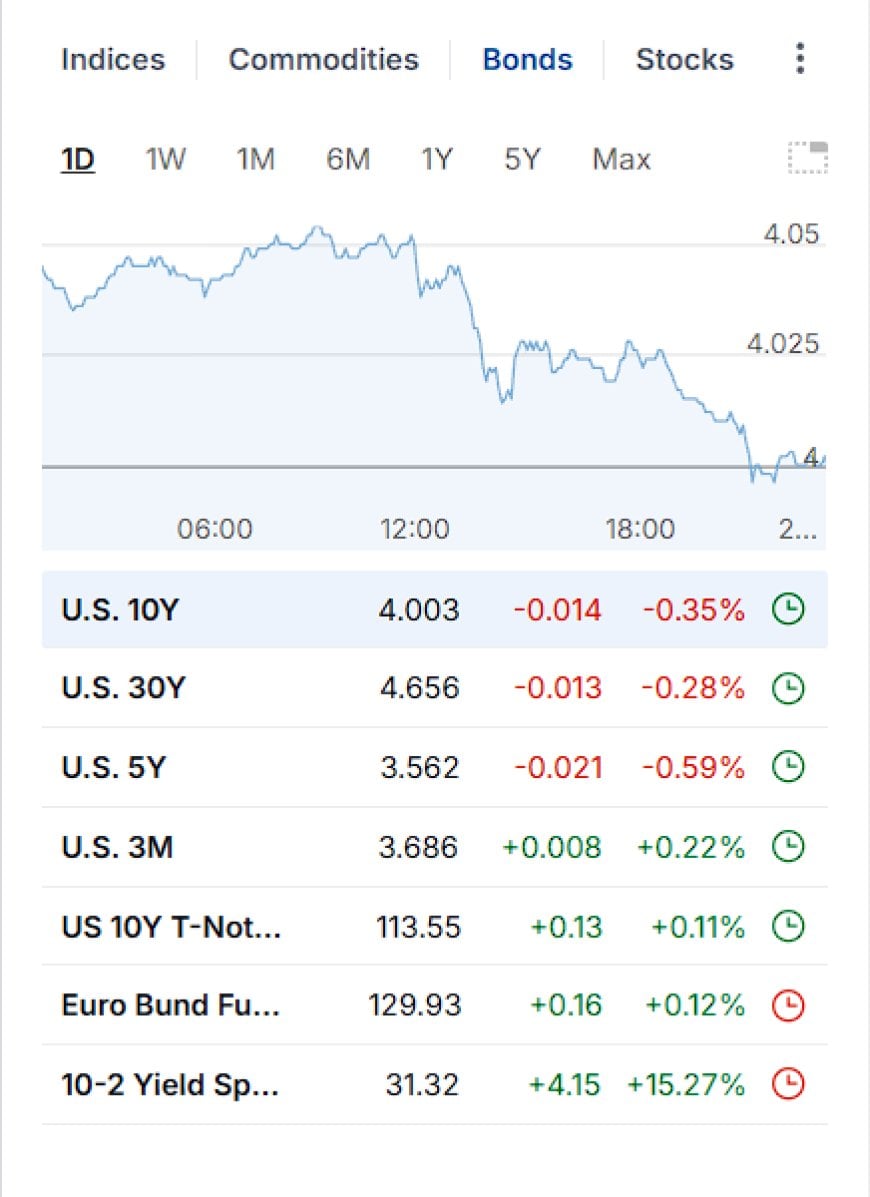
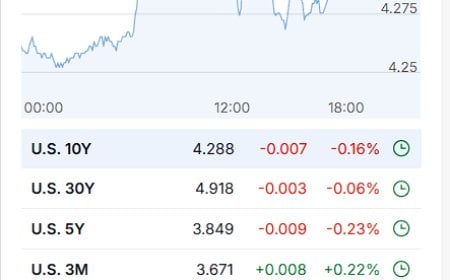
The bond panel is the tell, but the correct framing is flattening, not steepening. Using our curve table: 10s2s compressed from roughly +72 bps on 02/02 (4.29% minus 3.57%) to roughly +60 bps on 02/26 (4.02% minus 3.42%). 10s3m compressed from roughly +60 bps to roughly +34 bps. That’s a bull-flattening signature: duration getting bid on growth caution while the front end stays policy-anchored.
Our SPY snapshot shows ~$689.30 with ~90.6M volume and a 5-day move that’s basically flat net. That’s how regime transitions look: violent rotations under the surface while the index tries to “hold together.”
The Drivers: Earnings, Tariffs, Oil, and the Fed Box
Four drivers ran the week into today: earnings (Nvidia and enterprise software), tariff regime uncertainty (policy rules shifting), oil’s geopolitical risk premium, and the Fed’s policy box (minutes + inflation prints + growth noise).
Earnings: Nvidia beat, and the market still said “prove it”
Nvidia delivering and still getting sold is a positioning story. The trade was crowded, expectations got weaponized, and the marginal buyer started acting tired. In early-cycle leadership, beats levitate price. In maturity-phase leadership, beats become the minimum requirement, and the market demands something extra: durability, pricing power, margins, capital return, and a narrative that survives a tighter macro.
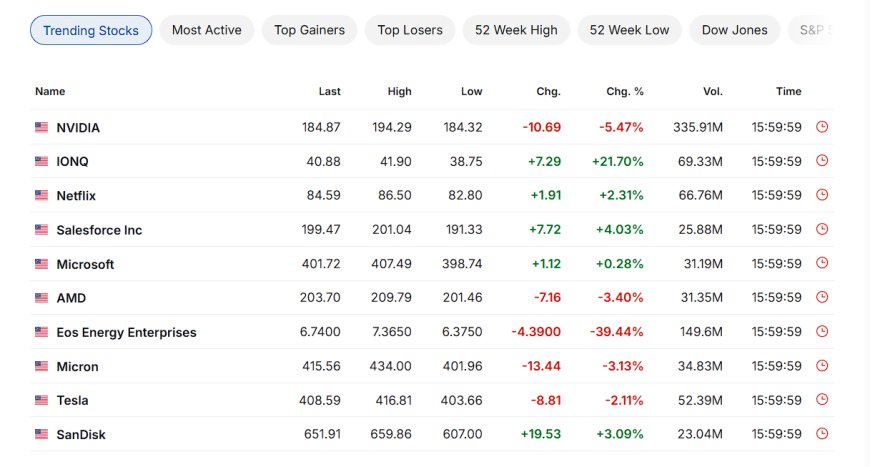
That screenshot is the entire vibe: NVDA down hard, AMD down, Tesla down, but Salesforce green and some speculative names ripping. That’s not a unified liquidation. That’s leadership conflict inside the market.
Enterprise software: CRM held up, but the market is judging “AI monetization” like a courtroom
Enterprise software is where hype meets budgets. When the macro gets noisy, “cool product” isn’t enough. The market starts interrogating forward revenue, renewal math, and whether AI is actually landing in production at scale or still living in pilot-land. This is why guidance sensitivity feels brutal: we’re late enough in the cycle that multiple compression can hit fast even when results are fine.
Tariffs: the rules engine changed, and markets hate rule ambiguity
The Supreme Court striking down the earlier sweeping tariffs was not just a legal headline. It’s a volatility injector because it scrambles the rules that businesses hedge against. Then the follow-on “what replaces it” phase matters even more: companies can’t plan capex, sourcing, pricing, or margins in a world where the rules may shift again next week.
In a calm market, tariff policy is “politics.” In a late-cycle market, tariff policy is a macro variable: it hits rates (growth/inflation mix), FX (relative competitiveness), equities (margin uncertainty), and credit (refi math + cash flow variance).
Oil: geopolitical risk premium whiplash
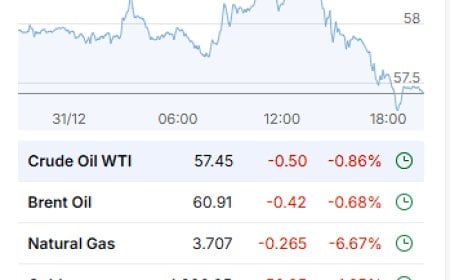
Oil stayed pinned to U.S.–Iran headlines. That’s why crude can feel sticky even when inventory builds hit: the market is pricing tail risk of disruption, then unpricing it the moment diplomacy headlines show up. Optionality is the product.
The Fed box: inflation isn’t dead, growth is noisy, and minutes don’t “solve” anything
The Fed is stuck in a control problem: cut too early and you re-ignite inflation, hold too long and you tighten into weakening demand. The minutes are a “permission signal,” not a crystal ball. The real-time vote is the curve, and this week the vote was flattening, not steepening. That’s the bond market leaning “growth cools faster than inflation dies,” even as the front end stays anchored by policy expectations.
- Nvidia: beat + strong outlook, but the stock response screamed expectations were crowded.
- Tariffs: policy uncertainty re-entered the tape and spilled into rates, FX, and risk premium.
- Oil: geopolitics kept the risk premium alive; headlines moved price more than inventory.
- Fed box: minutes + inflation data + noisy growth kept “cuts” in tension with reality.
The Underbelly: Private Credit, Multifamily Stress, and BNPL Drift
If you want the real “clown world” layer, it’s not in the headline indexes. It’s in credit structure. The system has been migrating risk out of banks and into non-bank channels for years. That’s not automatically bad. It becomes fragile when transparency drops, leverage rises quietly, and the refi window tightens.
Private credit: the “great divide” is the setup
The debate itself is the signal. When smart money is split, it usually means exposures are hard to map and outcomes are path-dependent. Private credit is big enough to matter and opaque enough to surprise. If the cycle turns, the first visible symptom won’t be a press release that says “private credit broke.” It will be second-order effects: forced selling, gated vehicles, bank exposure headlines, and sudden repricing in risk assets.
Multifamily: refi math is a real economy transmission channel
Multifamily stress is clean: floating-rate resets, operating cost inflation, cap-rate repricing, and refinancing windows. This is the part of the economy that doesn’t get saved by “AI optimism.” If cash flows don’t clear the new cost of capital, assets get repriced and lenders get picky.
BNPL: not a bomb by itself, but a persistent stress leak
BNPL is a consumer behavior signal. It tends to expand when households are smoothing costs and drift toward delinquency when the margin gets tight. It’s not necessarily systemic alone, but it’s a useful sensor for the same cohort that snaps first when rates bite and labor conditions soften.
You can have Nvidia down hard while penny names print +50% to +115% in the same session. That divergence is not “healthy risk appetite.” It’s fragmented liquidity: serious capital hedges and de-risks, while the casino still runs on the side.
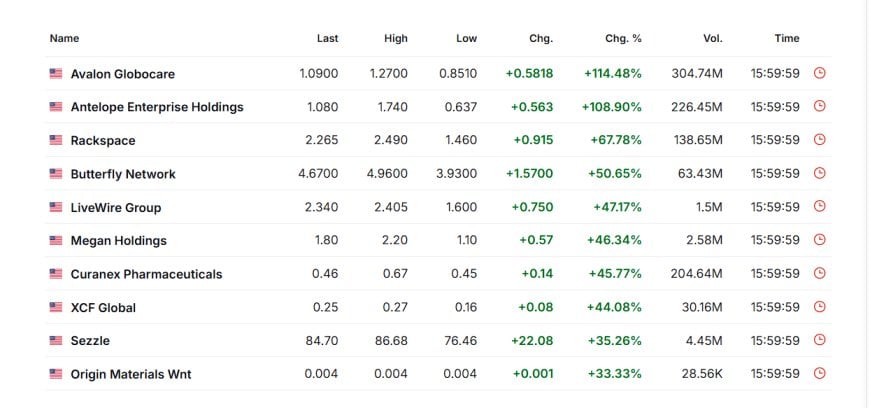
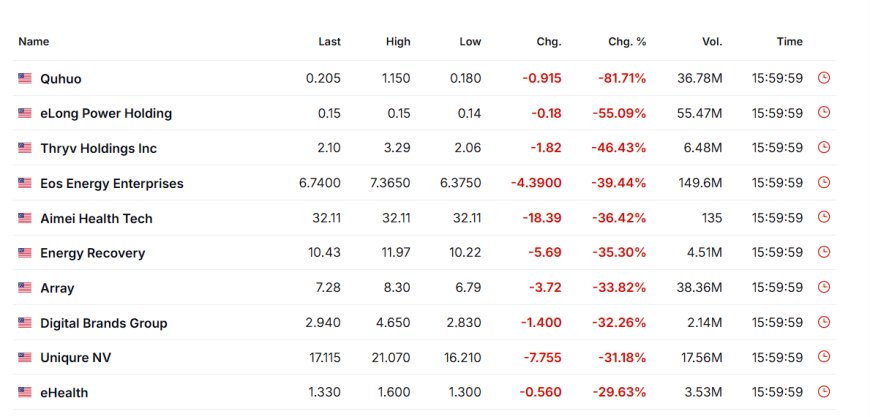
When you see this kind of dispersion, it’s a reminder: the “market” is not one thing. It’s multiple liquidity pools interacting. And the plumbing matters more than the headlines.
Pattern Nexus Lens
Here’s the systems framing: we’re watching a control system try to stabilize while its inputs keep changing. Earnings are the sensor feed (real activity, margins, demand). Tariffs and geopolitics are external shocks (rules change, energy constraints). The Fed is the controller (rates, liquidity expectations). Credit is the hidden state (where stress accumulates before it becomes visible).
Today’s tape says the controller is constrained. Inflation hasn’t fully cleared. Growth data is noisy. Policy rules are moving. So the system does what systems do: it pushes risk into corners, hedges the tail, and starts repricing leadership. That’s why Nvidia can beat and still get sold while metals stay firm and the curve flattens.
The regime is shifting from narrative-led multiple expansion to proof-led capital allocation. The bond market is bidding duration on a “growth cools first” signal, while the credit underbelly keeps thickening in non-bank channels where transparency is worst.
FAQ
Why did Nvidia drop if earnings were strong?
Because the trade was crowded and the bar is no longer “beat.” The bar is “beat, guide, and also convince the market about durability and capital allocation.” When expectations are extreme, good news can still be a sell signal.
So what does the flattening curve mean here?
It means the long end drifted down faster than the front end. That’s typically the market bidding duration because it’s less confident in forward growth, while the front end stays anchored by Fed policy expectations. It’s not “cuts are guaranteed next week.” It’s “late-cycle caution + policy box.”
What am I watching next?
Nvidia follow-through and whether semis stabilize, breadth and whether rotation persists, oil headline risk premium, tariff policy clarity, and whether credit stress leaks into new places (spreads, delinquencies, refi windows).
Sources
Anchors for the week’s drivers: earnings, tariff policy, inflation/growth, Fed minutes, oil geopolitics, and credit/real estate stress indicators.
- Reuters: U.S. Supreme Court strikes down Trump’s global tariffs
- Reuters: U.S. Customs to stop collecting tariffs deemed illegal; replacement tariff policy shift
- Federal Reserve: FOMC Minutes (Jan 27–28, 2026)
- BEA: Personal Income and Outlays (Dec 2025) including PCE inflation
- BEA: GDP (Q4 and year 2025) advance estimate
- Reuters: Oil settles little changed; supply worries persist ahead of U.S.–Iran dynamics
- Reuters: Oil eases as Iran signals deal willingness; headline-driven risk premium
- Reuters: Oil settles lower after choppy session as U.S.–Iran talks developments are tracked
- Bloomberg: UBS worst-case private credit defaults scenario
- Bloomberg: Private credit “great divide” debate
- Multifamily Dive: Multifamily loan delinquencies and apartment distress
- Richmond Fed: Economic Briefs (2026) including BNPL-related research context
- VantageScore: CreditGauge (Jan 2026) on early-stage credit stress and delinquencies
คุณมีปฏิกิริยาอย่างไร?
 ชอบ
0
ชอบ
0
 ไม่ชอบ
0
ไม่ชอบ
0
 รัก
0
รัก
0
 ตลก
0
ตลก
0
 ว้าว
0
ว้าว
0
 เศร้า
0
เศร้า
0
 โกรธ
0
โกรธ
0

Founder of Pattern Nexus. I research markets, macro, geopolitics, AI, history, ancient systems, and the patterns most people overlook. I’m also building Market Radar, a trading scanner designed to read pressure, risk, confirmation, and setup quality before chasing a move. Pattern Nexus is where I connect the dots between data, history, technology, and the bigger system playing out around us.












ความคิดเห็น (0)