Polar Vortex Watch 2026–27: Early Arctic Organization Is Now Pressing Historical Extremes
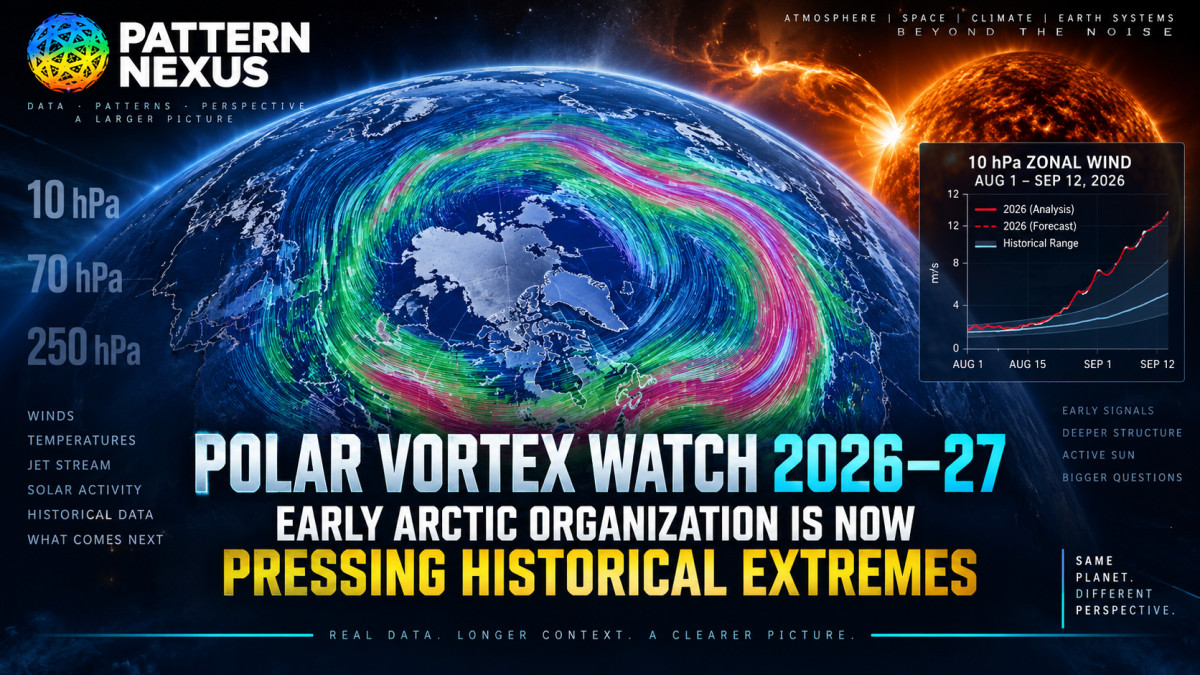
What started as an unusual late-August structural signal is becoming something much harder to dismiss. The 10-hPa Arctic winds have moved above the historical 90th percentile, the September 12 projection reaches 10.22 m/s against a date-matched historical maximum of 10.29 m/s, organization is now visible lower in the stratosphere near 70 hPa, and the broader 250-hPa jet is showing a strongly wrapped Arctic pattern. This is a full Pattern Nexus rerun of the wind, temperature, geometry, vertical structure, historical rarity, and active solar backdrop.
 Pattern Nexus Research
Polar Vortex Watch 2026–27: The Signal Is Expanding Down the Column
Five days ago the strongest evidence was geometry. Now the conventional 10-hPa wind series has moved into the upper historical envelope, the polar cap remains cooler than average, and September 6 GFS views show the organized circulation appearing deeper in the stratosphere while the upper-tropospheric jet wraps around the Arctic.
This is no longer just a strange-looking early-September 10-hPa map.
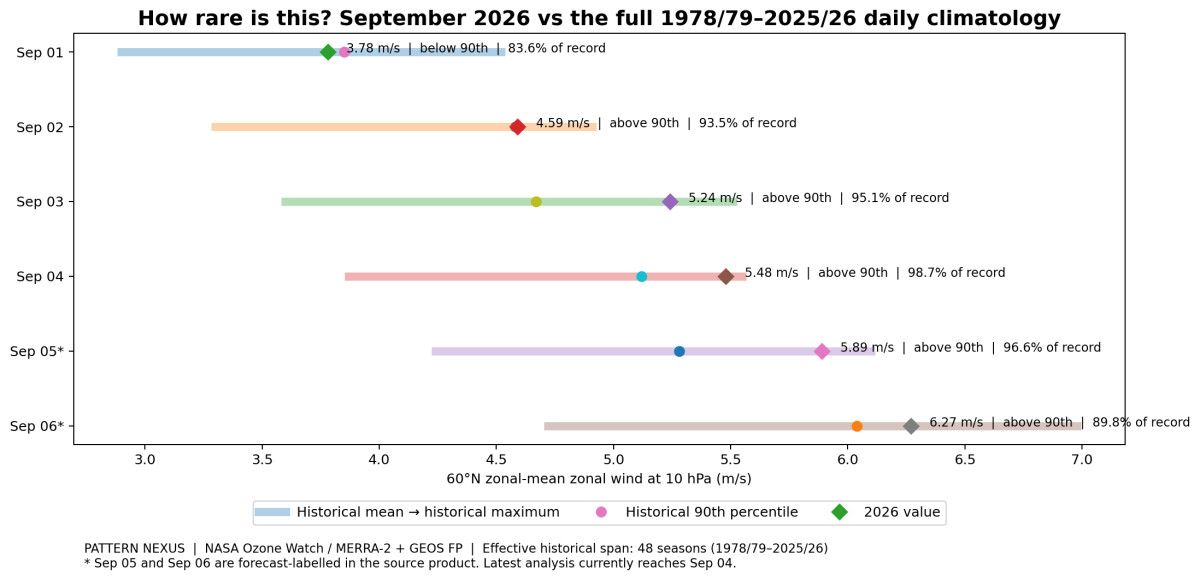
- The conventional wind metric has now caught up with the geometry signal. NASA Ozone Watch shows 60°N, 10-hPa zonal-mean winds at 5.48 m/s on September 4, above the historical 90th percentile of 5.12 m/s and only 0.07 m/s below the date-matched historical maximum of 5.55 m/s.[1]
- The acceleration happened quickly. The same series rose from 3.78 m/s on September 1 to 4.59 on September 2, 5.24 on September 3 and 5.48 on September 4.[1]
- The thermal background is still supportive. The latest available 10-hPa 60–90°N temperature analysis is 229.32 K on September 3, 1.13 K below the historical mean for the date.[2]
- The visual signal now extends beyond the original 10-hPa frame. September 6 GFS / Earth Nullschool views show a coherent 10-hPa circulation, a recognizable organized structure at 70 hPa, and a strongly wrapped 250-hPa upper-tropospheric jet.
- The 250-hPa map is not the stratospheric polar vortex. It matters because it shows the broader hemispheric circulation taking on an annular, wrapped form at the same time the stratospheric signal is becoming more developed.
- The solar backdrop stayed active. NOAA SWPC’s September 6 forecast says isolated G1 geomagnetic-storm periods are likely if the September 5 CMEs impact Earth as forecast; solar radiation had been above S-scale thresholds and R1 radio blackouts were observed during the prior 24 hours.[3]
- The question has changed. I am no longer asking only whether the upper-stratospheric circulation looks early. I am asking whether we are watching an unusually early, increasingly vertically developed high-latitude circulation regime.
This is a full rerun of the September 1 Pattern Nexus polar-vortex investigation, not a cosmetic update. The original article found that the standard wind metric was only modestly early while the geometry screen was much more unusual. Five days later the wind-strength branch has materially changed, and the circulation now deserves to be looked at as a developing vertical system rather than as one isolated 10-hPa snapshot.
Five days changed the argument
When I wrote the first article, the important observation was not that winds existed over the Arctic in early September.
Of course they existed.
The point was the shape.
The circulation already looked centered, smooth and organized in a way that I did not expect this early. I went back through the same date in prior years, then we ran the actual numbers instead of arguing from screenshots.
The result was split.
The conventional 60°N, 10-hPa wind metric said the seasonal transition was only a little ahead of normal.
The geometry said something more interesting was happening.
That was September 1.
Now the wind metric itself is moving into the same direction.
And the structure is showing up lower in the atmospheric column.
The conventional 10-hPa metric is no longer giving me a boring answer
This is the biggest numerical change since the first article.
NASA Ozone Watch’s 60°N, 10-hPa zonal-mean wind series shows 3.78 m/s on September 1 against a historical mean of 2.90 m/s. That was elevated, but it was not extraordinary.
Then the line accelerated.
September 2: 4.59 m/s. Historical 90th percentile: 4.58.
September 3: 5.24 m/s. Historical 90th percentile: 4.67.
September 4: 5.48 m/s. Historical 90th percentile: 5.12. Historical maximum for the date: 5.55.
That means the latest actual analysis in the retrieved series is sitting only 0.07 m/s below the date-matched historical maximum.
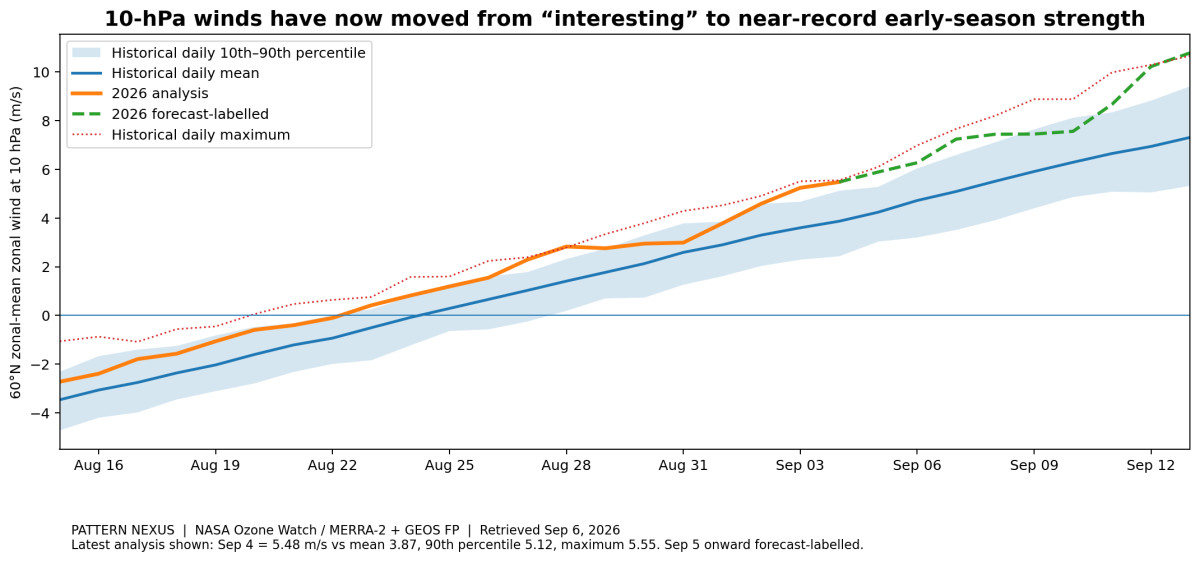
The forecast-labelled side continues higher, but I am not treating those future values as observations. I do not need to. The important change has already happened in the analyzed data.
On September 1 I could honestly say the geometry was the more interesting branch while the wind-speed branch was only modestly early.
That statement is already outdated.
The original geometry signal did not disappear
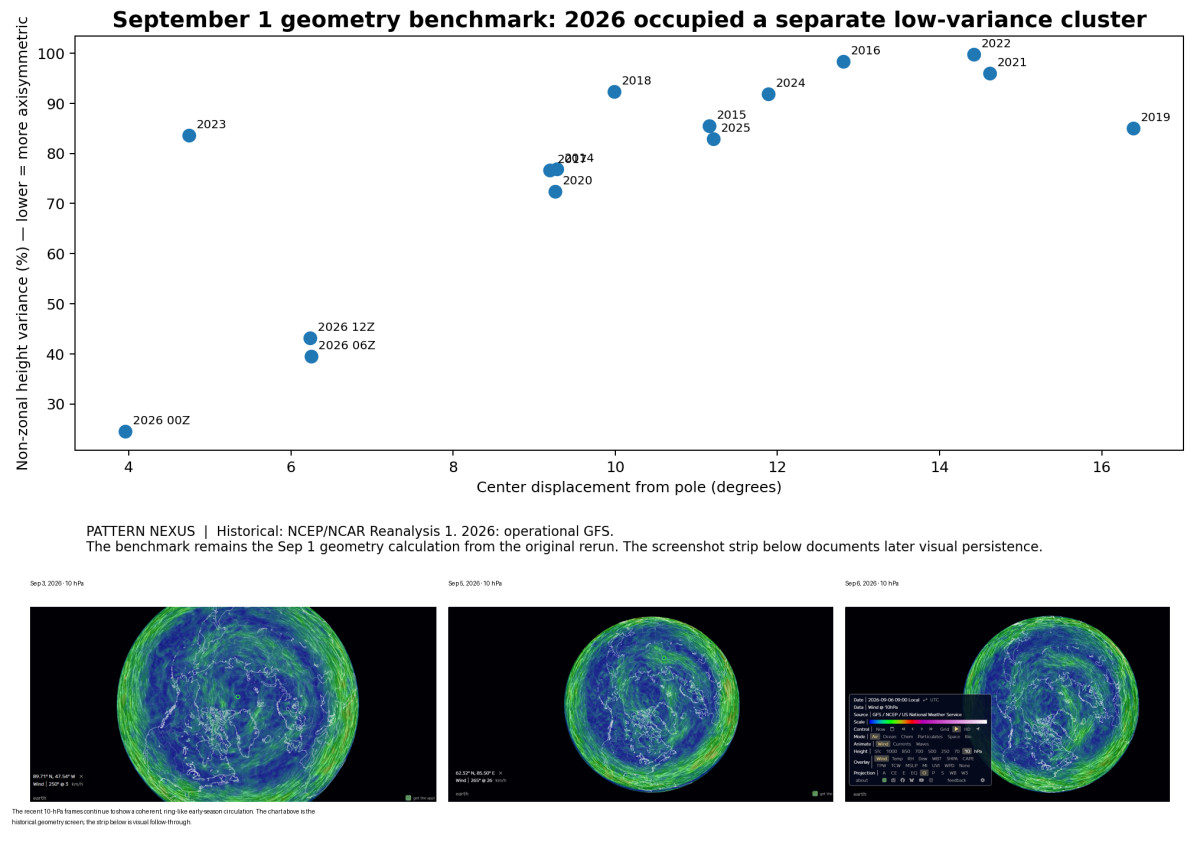
The September 1 geometry screen remains the starting point because it captured what the eye saw before the scalar wind number became extreme.
Using the same broad Arctic domain, the 2026 GFS height field occupied a completely different part of the centering-versus-symmetry space from the twelve September 1 historical comparison years.
The midnight 2026 field had a center displacement of 3.96 degrees and a non-zonal height-variance fraction of 24.5 percent. The twelve historical September 1 fields ranged from 72.4 to 99.7 percent on that same non-zonal measure.
That is why the original article kept coming back to shape.
The new development is that I no longer have to choose between “interesting geometry” and “ordinary wind strength.”
The two branches are beginning to converge.
The polar cap remains cooler than the date-matched mean
The thermal side is not as extreme as the geometry signal, and I do not need it to be.
The latest available NASA Ozone Watch 10-hPa 60–90°N temperature analysis is September 3 at 229.32 K.
The historical mean for that date is 230.45 K.
That puts the polar cap about 1.13 K below the date-matched mean.
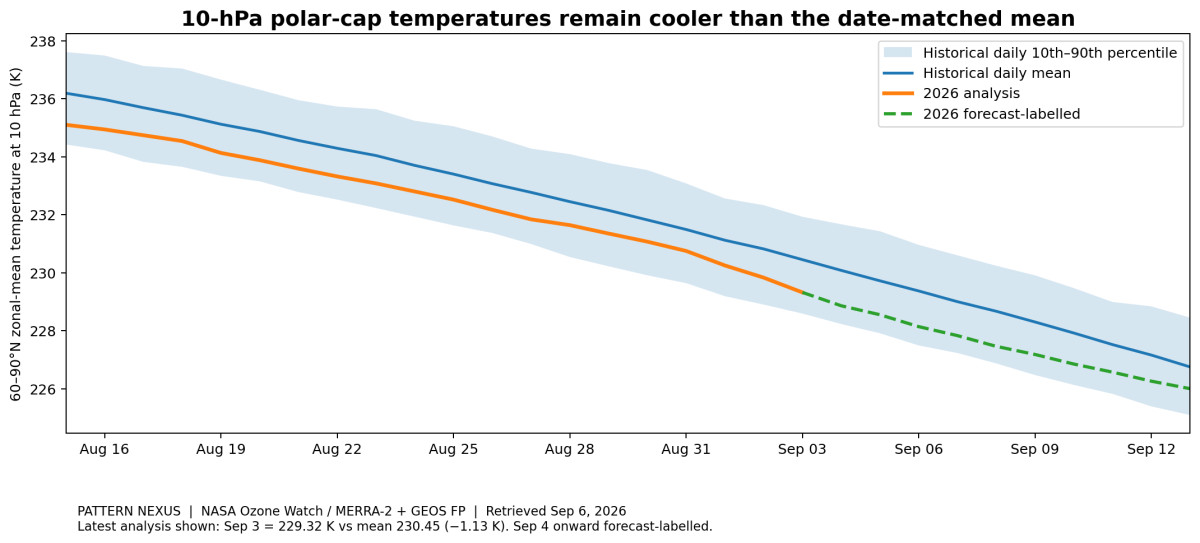
Cold polar temperatures increase the thermal contrast that supports the developing wintertime westerly circulation.
That does not mean one kelvin below average explains the entire event.
It means the background state is still leaning in the same direction.
This is the part that changed the story for me this morning
The September 6 10-hPa map still shows the organized upper-stratospheric circulation.
Then I dropped the level to 70 hPa.
There is now a recognizable organized high-latitude circulation there too.
That matters because the seasonal polar vortex develops from the upper stratosphere downward. Seeing the structure become visible at a lower stratospheric level means the original signal may be developing depth instead of remaining a shallow upper-level feature.
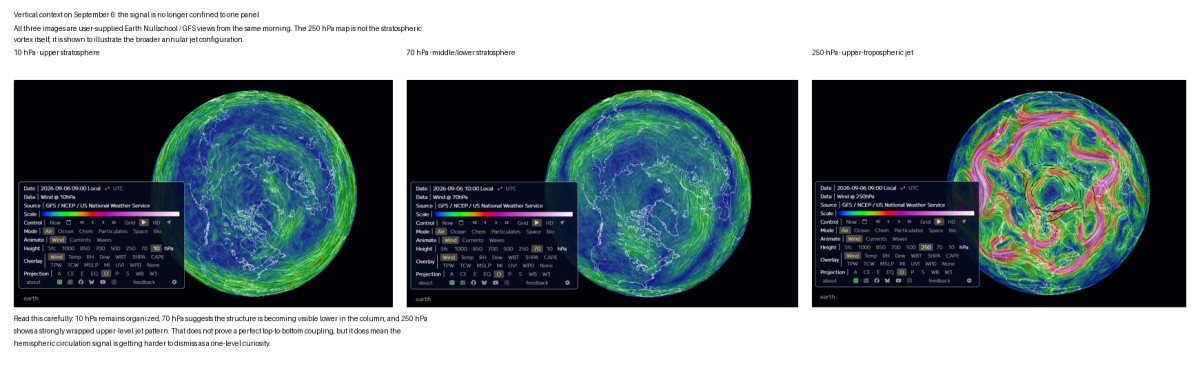
I am intentionally not calling this proof of perfect top-to-bottom coupling.
That is not what these screenshots alone establish.
What they establish visually is that the unusual organization is no longer confined to the same single level where I first noticed it.
That is enough to make the vertical structure the next major branch of the investigation.
The 250-hPa ring is not the stratospheric vortex — but it still matters
I want this distinction written clearly because it is easy to overstate what the lower panel means.
At 250 hPa we are in the upper troposphere.
That panel is showing the upper-level jet structure, not the stratospheric polar vortex itself.
But look at the geometry.
The stronger flow is wrapping around the Arctic in a broad annular structure while the inner polar region is comparatively quieter.
That does not prove the 10-hPa vortex has physically “transferred” all the way to 250 hPa.
It does tell me that the larger Northern Hemisphere circulation is also presenting an unusually coherent high-latitude ring at the same time the stratospheric signal is strengthening.
That is why I care about the panel.
The atmosphere is not a set of unrelated horizontal slices.
The question is whether these layers are beginning to organize into the same broad regime.
And the Sun did not exactly calm down while this was happening
This entire line of investigation started with the Sun.
I wrote privately in July that if the solar side did not calm down, autumn and winter were going to get interesting.
That is what made me look downstream in the first place.
The latest official NOAA space-weather material keeps that branch alive.
SWPC’s 3-Day Forecast issued September 6 says isolated G1 geomagnetic-storm periods are likely if the CMEs from September 5 impact Earth as forecast.
The same product says solar radiation during the prior 24 hours was above S-scale storm thresholds.
It also reports R1 radio blackouts during the prior 24 hours, with the largest at 1518 UTC on September 5.[3]
I am not writing that as proof that three CMEs made the vortex tighten.
That would be a much bigger causal claim than the current data can carry.
I am writing it because the Sun remains the upstream signal that triggered this watch, and the solar environment is still active while the atmospheric signal is becoming more organized.
That is exactly when I keep watching both systems.
The evidence stack is much stronger than it was on September 1
| Branch | September 1 | September 6 rerun |
|---|---|---|
| 10-hPa geometry | Markedly more axisymmetric than the twelve-year comparison | Visual coherence persists through Sep 6 |
| 10-hPa wind | Above average but not extreme | Latest analysis above 90th percentile, almost at date-matched maximum |
| Polar-cap temperature | Cooler than average | Still cooler than average |
| Vertical structure | Mainly an upper-stratospheric observation | Recognizable organization now visible at 70 hPa; broader annular upper-level jet at 250 hPa |
| Solar backdrop | Recent geomagnetic / flare activity already part of the watch | New Sep 5 CME activity plus S-scale radiation and R1 radio-blackout observations in NOAA forecast |
That is why I am not treating this as another incremental screenshot update.
Something has changed in the evidence stack.
The full historical envelope shows how quickly this moved from unusual toward the edge of the record
The NASA Ozone Watch climatology used here reaches back through the 1978/79 season, giving roughly 48 seasons of date-matched historical context. That matters because I do not want to call something rare simply because it looks strange on a map.
On September 1 the 2026 10-hPa wind was still just below the historical 90th percentile. By September 2 it had crossed that threshold. September 3 and September 4 moved farther into the upper historical envelope, with the September 4 analysis reaching 5.48 m/s against a date-matched historical maximum of 5.55 m/s.
The longer progression is even more useful because it shows the entire seasonal transition instead of only a handful of September dates. The August values begin close to the normal seasonal climb. The separation becomes obvious late in the month, crosses the 90th-percentile boundary in early September, and the forecast-labelled path continues toward the historical daily maximum by September 12.
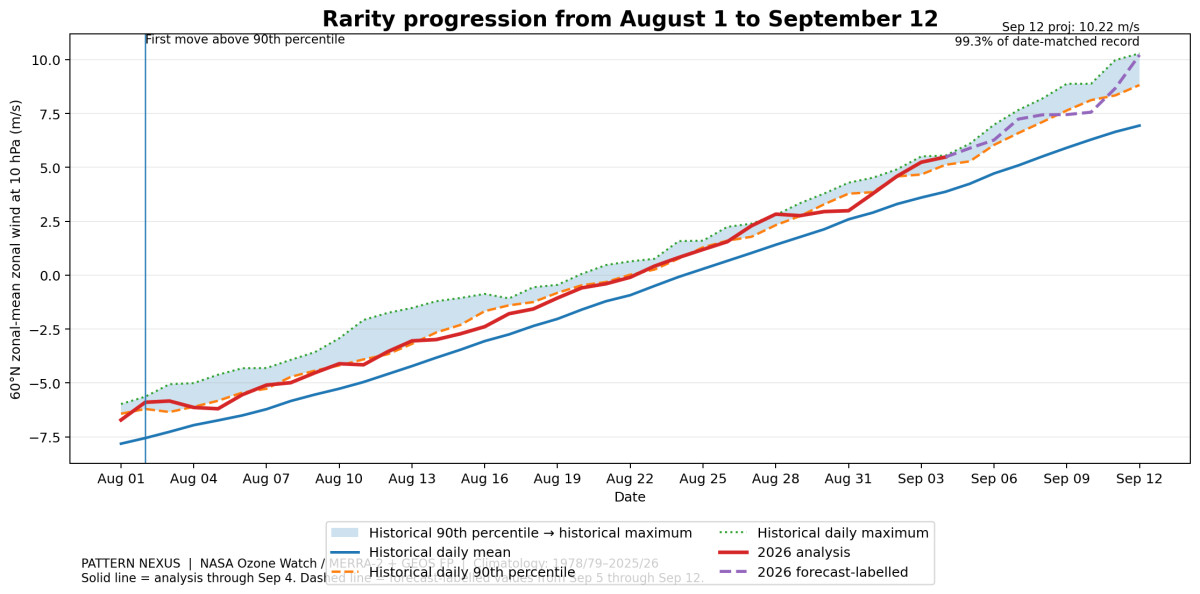
That distinction matters. I am not counting the September 12 projection as a record that has already happened. I am showing where the current forecast path sits relative to nearly five decades of date-matched history.
If the analyzed values continue following that path, the rarity question becomes much less subjective.
The next seven to fourteen days are the real test
I am watching four things now.
One: persistence. Does the 10-hPa structure stay coherent, or does it break apart as quickly as it formed?
Two: depth. Do 30, 50, 70 and 100 hPa become progressively more organized?
Three: wind strength. Do the actual analyzed values follow the forecast path toward 7, 8 and eventually 10 m/s, or does the model outrun reality?
Four: the Sun. Do the CME impacts, particle environment and geomagnetic response add another pulse while the atmospheric circulation is already organizing?
If the answers keep lining up, this becomes a much more important early-season event than the original article could establish.
And if two weeks from now the circulation is tighter, deeper and still sitting near the top of the historical wind envelope, then we are going to have to stop talking about this as a visual curiosity and start talking about where it ranks in the actual historical development record.
What this does and does not establish
Is the September 6 vortex unprecedented?
That is not established yet. The current wind analysis is near the historical daily maximum for September 4, and the original geometry screen was highly unusual relative to the twelve-year September 1 comparison. A formal record claim requires a same-system historical rerun across multiple levels and dates.
Does the 70-hPa map mean the vortex is moving downward?
It is consistent with deeper seasonal organization, because the stratospheric polar vortex develops from higher levels downward. The screenshot alone does not quantify propagation speed or prove dynamical downward coupling.
Is the 250-hPa ring the polar vortex?
No. At 250 hPa the map is showing the upper-tropospheric jet. It is included because the broader hemispheric circulation is also strongly wrapped around the Arctic.
Did the CMEs cause the vortex?
This article does not establish that. The solar activity is part of the timing and upstream watch because there are researched solar-atmosphere pathways, but event-specific causation requires additional data.
What is most important now?
Persistence and vertical development. If the same organized structure strengthens across 10, 30, 50, 70 and 100 hPa over the next one to two weeks, the historical comparison becomes much more consequential.
Data and source record
- [1] NASA Ozone Watch — 60°N Zonal Mean Zonal Wind, 10 hPa, 2026. Product notes that data starting August 1, 2026 are from GEOS FP and provides climatology through 2025/26.
- [2] NASA Ozone Watch — 60–90°N Zonal Mean Temperature, 10 hPa, 2026.
- [3] NOAA / NWS Space Weather Prediction Center — 3-Day Forecast issued September 6, 2026 at 1230 UTC.
- [4] NOAA PSL / NCEP-NCAR Reanalysis 1 — historical 10-hPa geopotential-height fields used in the September 1 Pattern Nexus geometry comparison.
- [5] NOAA NOMADS GFS — current 10-hPa analysis fields used in the September 1 Pattern Nexus geometry comparison.
- [6] Earth Nullschool / GFS screenshots supplied for September 3, September 5 and September 6, 2026, including 10 hPa, 70 hPa and 250 hPa views.
Five days ago I had an unusually organized Arctic geometry signal that the conventional wind metric did not fully confirm. Today that is no longer true. The wind series has moved into the upper historical envelope, the cooler polar-cap background persists, the 10-hPa structure is still there, and the September 6 map stack now shows recognizable organization lower in the stratosphere with a strongly wrapped upper-tropospheric jet around it. I am not calling the final winter from six days of September data. I am saying the thing I started watching because of the Sun is becoming more coherent, more measurable and more vertically developed instead of fading away. That is why the next one to two weeks matter.
คุณมีปฏิกิริยาอย่างไร?
 ชอบ
0
ชอบ
0
 ไม่ชอบ
0
ไม่ชอบ
0
 รัก
0
รัก
0
 ตลก
0
ตลก
0
 ว้าว
0
ว้าว
0
 เศร้า
0
เศร้า
0
 โกรธ
0
โกรธ
0

Founder of Pattern Nexus. I research markets, macro, geopolitics, AI, history, ancient systems, and the patterns most people overlook. I’m also building Market Radar, a trading scanner designed to read pressure, risk, confirmation, and setup quality before chasing a move. Pattern Nexus is where I connect the dots between data, history, technology, and the bigger system playing out around us.

ความคิดเห็น (0)