If you support the work I’m doing here at Pattern Nexus, please consider donating or subscribing. Subscribers receive an ad-free version of the website, along with other benefits. Lately, we’ve been experiencing an increasingly large number of cyberattacks.
About this fundraiser
If you support the work I’m doing here at Pattern Nexus, please consider donating or subscribing. Subscribers receive an ad-free version of the website, along with other benefits. Lately, we’ve been experiencing an increasingly large number of cyberattacks.
AI companies are assembling a cognitive-and-physical labor system designed to outscale human work. This forecast maps the 6–18 month robotics crossover, three displacement paths, the break in wage-based demand, and the …
I rebuilt the UWM panic from the ownership structure outward: who actually received the distributions, what the dividend suspension retains, why the $451.9 million quarterly loss does not describe the core origination b…
Vehicle sales normally weaken before recession becomes obvious elsewhere. Pattern Nexus reconstructs every U.S. recession since 1976, builds auto-only and cross-channel recession models, audits prices, financing, delinq…
Context
62% relevance · 15 cited sources · 1 asset
Updated
Aug 6, 2026
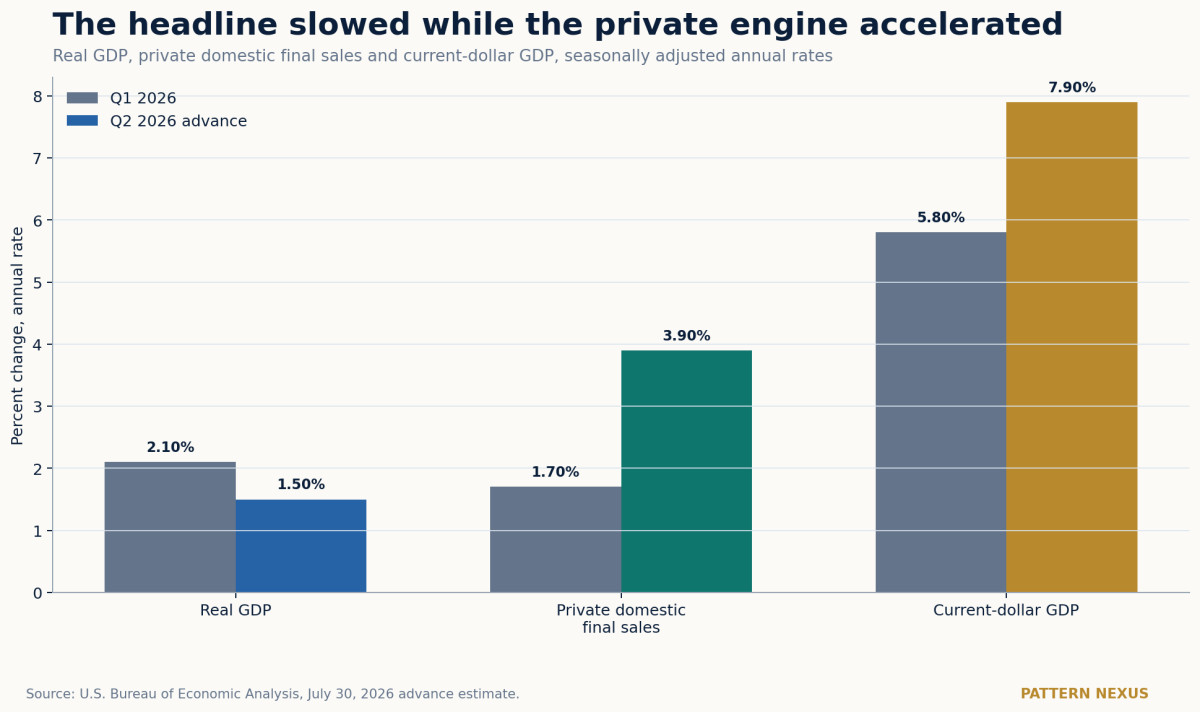
Open original research and sources →Figure 1. Real GDP slowed, but the private domestic engine and current-dollar economy accelerated. Source: BEA; Pattern Nexus chart.Chart-led research
Real GDP slowed to a 1.5% annual rate in Q2 2026, but the private domestic economy accelerated to 3.9% while nominal GDP grew 7.9%. This Pattern Nexus analysis separates the headline from the internal economy and explai…
A full Pattern Nexus reconstruction of U.S. and global oil inventories from the 1970s through the 2026 war shock, including original regressions, depletion scenarios, strategic reserves, refinery constraints, inflation,…
A full July 2026 data reconstruction of the Federal Reserve’s next policy path, showing how a 4.65% nominal 10-year, 2.44% real 10-year, Treasury supply, oil risk and uneven liquidity conditions create a hawkish-hold tr…
A 2003–2026 reconstruction of Fed liquidity, gold, housing and NASDAQ data, plus an experimental stablecoin-augmented liquidity index.
Meta tags: liquidity conditions index, hard assets, gold, Federal Reserve balance s…
Context
62% relevance · 13 cited sources · 13 assets
Updated
Jul 26, 2026
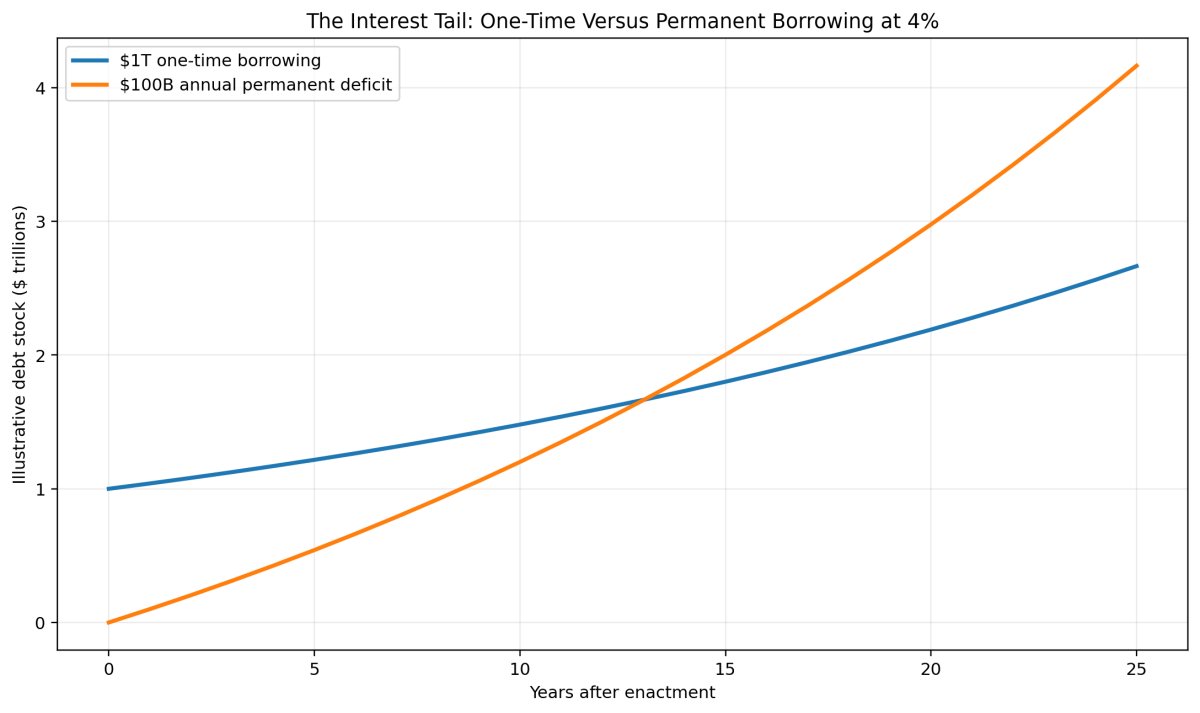
Open original research and sources →Figure 1. Illustrative—not a historical score. At a constant 4 percent financing rate, a one-time $1 trillion borrowing becomes about $2.67 trillion after 25 years. A permanent $100 billion annual deficit accumulates to about $4.17 trillion, including roughly $1.67 trillion of i…Chart-led research
A 70-year counterfactual audit of presidential policy, inherited law, tax cuts, entitlements, crisis packages, and the compounding interest tail. The analysis separates who originated a policy from who expanded, extende…
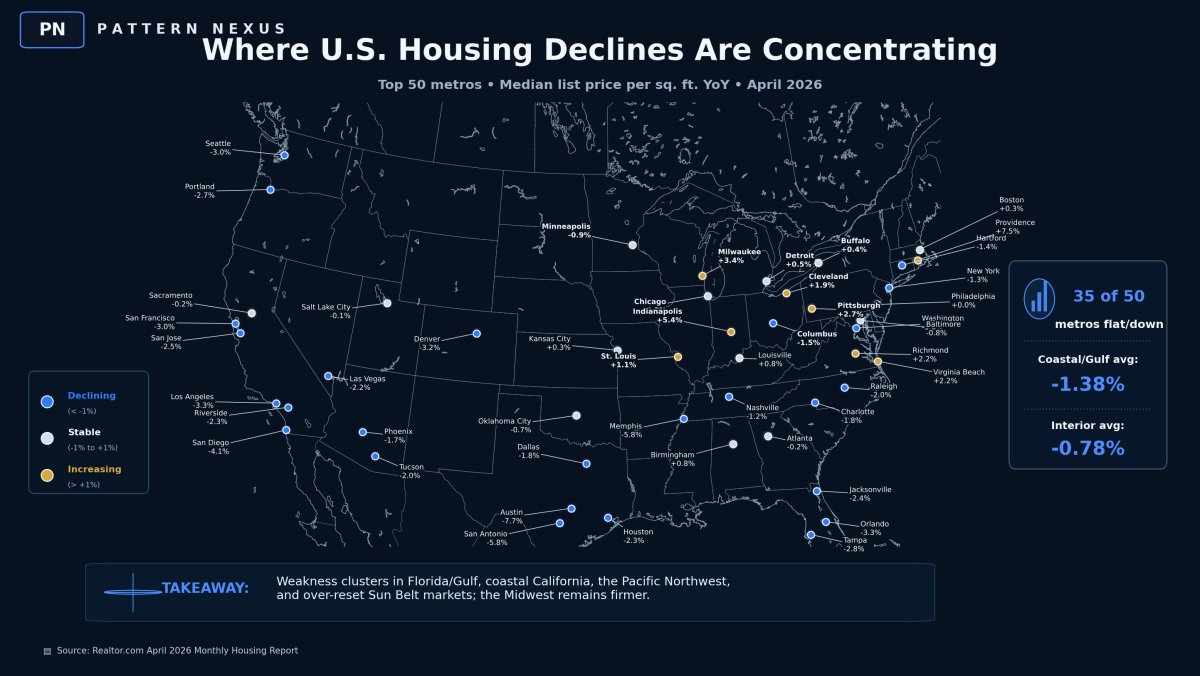
The U.S. housing market is not crashing everywhere. It is repricing where the affordability stack broke first: coastal price towers, insurance-stressed Florida and Gulf markets, high-rate West Coast metros, and over-res…
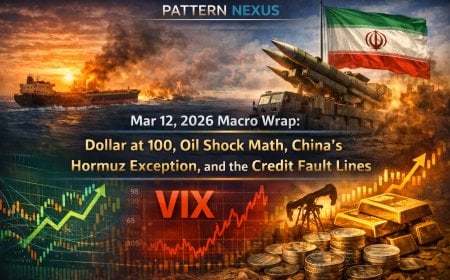
2026 is moving in whiplash mode. The dollar is pressing 100, yields are back in “you’re not supposed to be here” territory, oil is flirting with $100 again, and the Hormuz layer is no longer theoretical. China is negoti…
If Pattern Nexus has been useful to you, help keep it growing.
Pattern Nexus is independently built and operated.
Most of the research remains publicly available,
but the data, servers, tools, research and time behind it all
have real costs.
Books, memberships and direct support help fund the next stage
without putting everything behind a paywall.