 Editor-written summary
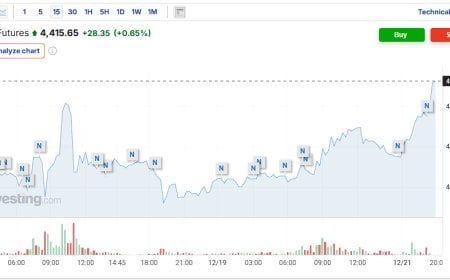
Gold didn’t fail or stall after QT ended — it repriced early and is now consolidating at a higher structural level. An updated Pattern Nexus breakdown on gold’s role in the current liquidity regime.
Inside this report
- Executive Summary
- Recap: The Original Thesis
- Phase Dynamics: Why QT Ending and QE-lite Don’t Produce Moonshots
 Editor-written summary
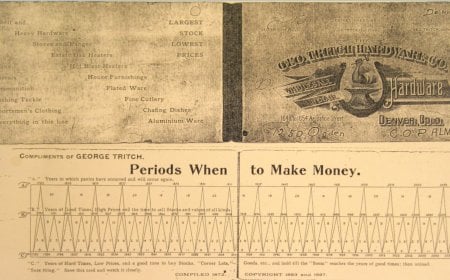
A deep Pattern Nexus breakdown of Samuel Benner’s 19th-century market cycle chart and why it still aligns with modern financial stress windows. This article explains the mechanics behind the “2026 crash chart,” why it appears accurate, what it gets wrong, and how to use it correctly as a risk-regime lens rather than a prediction tool.
Inside this report
- The “150-Year-Old Chart” That “Predicts” 2026
- Executive Summary
- What You’re Looking At
 Editor-written summary
The coming AI wars will not be machines versus humans. They will be humans versus humans—futurists who adapt and integrate AI versus pastists who resist and demand reversal. This Pattern Nexus framework maps the fault lines, escalation pathways, and why a future “shooting war” is plausible, fast, and structurally asymmetric.
Inside this report
- The AI Wars Are Human Wars
- Executive Summary
- What “AI War” Actually Means
 Editor-written summary
Energy is the original control system. Grid synchronization, fuel corridors, dispatch priority, and failure modes now function as continuous enforcement mechanisms, determining what stays online, what shuts down, and where sovereignty becomes conditional.
Inside this report
- Energy Control
- Executive Summary
- Energy as the Foundational Control Layer
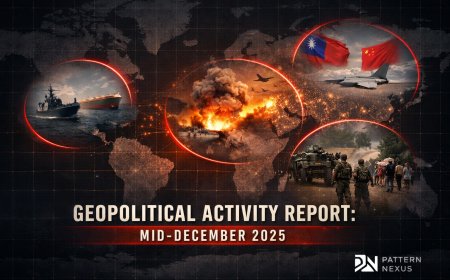 Editor-written summary
A systems-level geopolitical breakdown of Dec 10–21, 2025, as sanctions hardened into blockades, deterrence shifted toward modular escalation, and multiple theaters—from Venezuela to Taiwan to Southeast Asia—quietly reset global risk baselines.
Inside this report
- Executive Summary
- Timeline (Dec 10–21)
- Venezuela: Blockade Logic Goes Operational
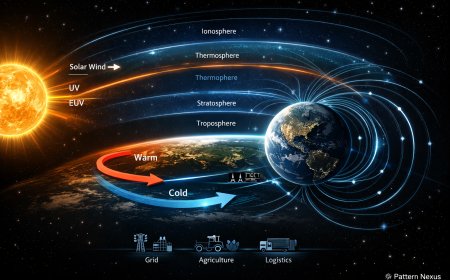 Editor-written summary
Climate risk is dominated by circulation stability, not surface averages. This analysis maps solar spectral variability, geomagnetic forcing, stratosphere–troposphere coupling, and AMOC heat transport into a single control-system model that explains why volatility and regional cold shocks can rise even in a warming mean.
Inside this report
- Climate Is a Circulation System
- Executive Summary
- The Frame: Flow Regimes and Control Surfaces
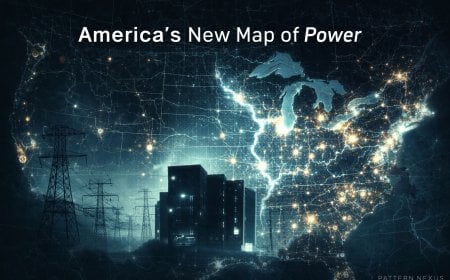 Automatically extracted excerpt
Published: December 2025 By: Pattern Nexus America’s New Map of Power The AI build-out is forcing the United States to confront physical reality again: power generation, transmission, cooling water, logistics throughput, and survivability. Once you map those constraints, the outcome is not subtle. Mega-regions are bei…
Inside this report
- America’s New Map of Power
- Executive Summary
- How to Read This Article
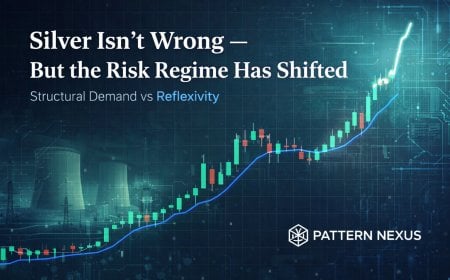 Editor-written summary
Silver can be structurally bullish while becoming tactically dangerous. This Pattern Nexus analysis breaks down four historical and modern silver charts to explain why vertical moves change risk, even when the long-term thesis remains intact.
Inside this report
- Silver Isn’t Wrong — But the Risk Regime Has Shifted
- Executive Summary
- Chart I: The 1979–1980 Silver Spike
 Editor-written summary
Standards are not neutral. ISO frameworks, accounting rules, settlement norms, and governance protocols act as invisible weapons—embedding power into interoperability, compliance, and market access without legislation.
Inside this report
- Standards as Weapons
- Executive Summary
- The Illusion of Neutrality
 Editor-written summary
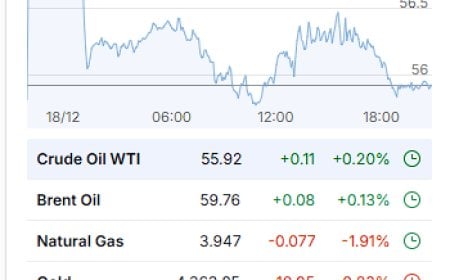
U.S. markets closed higher on December 18, 2025, led by tech and AI names, while bonds were bid, gold and silver saw sharp intraday swings, and crypto diverged lower. A cross-asset digestion day.
Inside this report
- Market Snapshot
- News of the Day
- Indices
 Automatically extracted excerpt
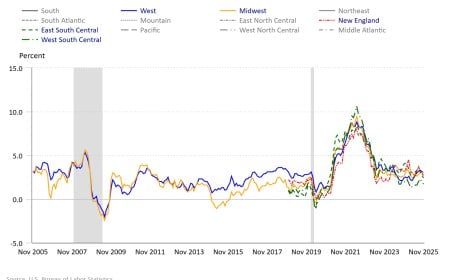
Published: December 2025 By: Pattern Nexus The headline rate is cooling. The structure is not. November 2025 CPI lands at 2.7% YoY while energy re-accelerates and electricity continues its slow ratchet higher. Complication: October survey pricing was not collected due to the federal shutdown, so the clean read is in t…
Inside this report
- Snapshot
- The Shutdown Distortion: Why This Is a Two-Month CPI
- Chart: Headline CPI Regimes (2005–2025)
 Editor-written summary
The latest ADP data shows a bifurcated labor market: small employers are shedding jobs while mid-sized and large firms add. ADP’s NER Pulse also signals a late-November rebound after several weeks of losses.
Inside this report
- Snapshot
- NER Pulse Weekly Signal
- NER Pulse (Four-week moving average, seasonally adjusted)