

You’re offline. Open downloads
Federal Reserve
Automatically indexed from the existing article tag.
Theses, forecasts, models, and paths
No published research objects yet
This topic is ready for editors to connect a thesis, forecast, model, or research path.
Latest articles
Federal Reserve Board releases results from survey of senior financial officers at banks about their strategies and practices for managing reserve balances
Federal Reserve Board releases results from survey of senior financial officers at banks about their strategies and practices for managing reserve balances
Published Nov 20, 2026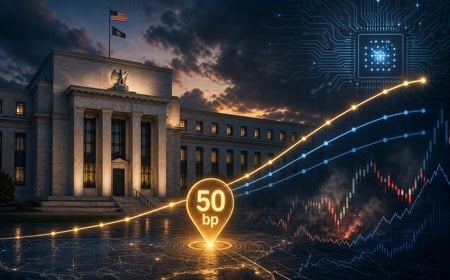 Article · related
Washington Turns Waller’s 50bp Warning Into an Inflation-Psychology Test
Federal Reserve Governor Christopher Waller said on November 18 that the Fed may need to act more aggressively against inflation, including a possible 50-basis-point move at the December 8-9 meeting or clearer communication that hikes will continue quickly into 2027. Reuters, Anadolu, Quartz, and NDTV Profit all reported the remarks from Waller’s CNBC appearance, while market coverage showed the comments landing into a fragile backdrop for futures, Treasury yields, and AI-linked risk appetite. The signal is not just hawkish Fed-speak; it is a repricing test for duration-heavy assets built around low discount rates.
Published Nov 18, 2026 Article · relatedFederal Reserve Board announces approval of application by Peoples Bancorp Inc.
Federal Reserve Board announces approval of application by Peoples Bancorp Inc.
Published Nov 15, 2026 Article · related
Hot CPI, Wrong Consensus: The Inflation Pressure Pattern Nexus Saw Coming
October CPI exceeded consensus on both headline and core inflation. Eight earlier Pattern Nexus articles connect the oil and diesel shock, fertilizer risk, Fed tightening and refinancing pressure, with new Federal Reserve research and the November energy outlook.
Published Nov 10, 2026 Article · related
When Must the Federal Reserve Expand Again? Modeling the Next $Trillions, 2027–2032
Pattern Nexus applies historical Fed balance-sheet data, reserve-capacity accounting, out-of-sample forecasting models and GDP-scaled intervention episodes to estimate how much the Fed may have to expand through 2032. The no-crisis illustrative reserve-support path rises from $6.748 trillion to about $8.18 trillion; a separate conditional large-event scenario is roughly $3.74 trillion over 12 months. Includes four original charts, source links and full model limitations.
Published Nov 9, 2026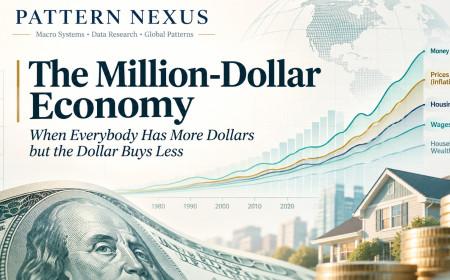 Article · related
The Million-Dollar Economy: When Everybody Has More Dollars but the Dollar Buys Less
The U.S. money supply has expanded nearly fifteenfold since 1980, while consumer prices have quadrupled. Household wealth, wages, housing, and everyday expenses have followed very different trajectories. Using historical Federal Reserve, BLS, and Census data, I examine the expansion of nominal wealth and purchasing power, with an interactive dashboard modeling possible outcomes through 2037.
Published Nov 1, 2026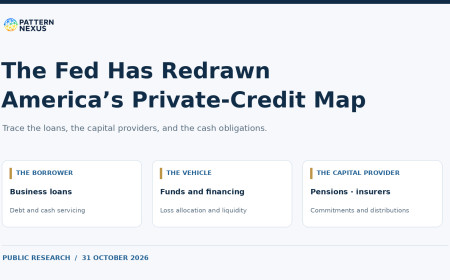 Article · related
The Fed Has Redrawn America's Private-Credit Map
New Federal Reserve tables connect private-credit loans with their vehicles and capital providers. PN follows pension and insurer ownership, fund borrowing, capital commitments, and the cash pressures that could shape the next lending cycle.
Published Nov 1, 2026 Article · related
Iran: Escalation Ladder — Reactivation Enabled
The Iran escalation ladder is active again. I examine the October strike risk, the infrastructure-war danger, rising tanker attacks alongside recovering exports, the Gulf defense response, financial isolation, current oil inventories and the Federal Reserve’s position. My working window is October 22–November 5. The article connects the latest evidence to the Pattern Nexus research trail from January through October.
Published Oct 8, 2026 Video · related
The Fiscal-Monetary Fusion — Audio-Video Edition
Episode 9 of the weekly Pattern Nexus audio-video series turns Part 9 of Cycles of Power into a shorter story about how pandemic stimulus fused fiscal and monetary policy, inflation forced a violent rate reversal, bank stress produced a new collateral-protection template, and sanctions, AI infrastructure, stablecoins, and tokenized Treasuries transformed liquidity into both operating system and geopolitical weapon between 2020 and 2025.
Published Oct 5, 2026 Video · relatedThe QE Decade — Audio-Video Edition
Episode 8 of the weekly Pattern Nexus audio-video series turns Part 8 of Cycles of Power into a shorter story about how quantitative easing, zero interest rates, dollar swap lines, Basel III, safe-asset scarcity, and repeated central-bank intervention replaced private mortgage collateral with public balance sheets between 2008 and 2019—and laid the foundations for stablecoins, tokenized Treasuries, and the AI–energy buildout.
Published Sep 26, 2026 Article · related
Fed Turns Stablecoin Issuance Into a Treasury-Backed Bank Rulebook
The Federal Reserve requested public comment on two GENIUS Act proposals that would establish a regulatory framework for Board-supervised payment stablecoin issuers. The package would require full backing with permissible reserve assets such as short-term Treasury bills and other high-quality liquid assets, add capital and risk-management standards, set reserve-custody rules, and create an application process for banks seeking to issue stablecoins through subsidiaries.
Published Sep 25, 2026 Article · related
The Real Reason They Are Building Humanoid Robots: The End of Human Labor as the Foundation of the Economy
Humanoid robotics is not simply about building machines that walk, talk, and perform household chores. It is about creating a scalable physical labor force that can operate alongside artificial intelligence, transforming production, ownership, wages, consumer demand, and the monetary system. This analysis connects the robotics revolution to the wider Pattern Nexus framework: structural deflation, expanding liquidity, concentrated ownership, universal intelligence, programmable money, and the transition toward a post-labor economy.
Published Sep 21, 2026 Article · related
Goolsbee Turns AI Data Centers Into a Fed Reaction-Function Test
Chicago Fed President Austan Goolsbee said on September 21, 2026 that policymakers should watch whether AI data-center construction is spilling beyond its sector and pushing aggregate output above capacity. The significance is not that the Fed is targeting AI, but that AI capex is now being discussed as a possible demand shock with implications for inflation and interest-rate policy.
Published Sep 21, 2026 Article · relatedFed Just Hiked Into a 5% 10-Year: Why the Next Liquidity Cycle May Arrive Faster
The Federal Reserve just raised the federal-funds target to 3.75%–4.00% while the 10-year Treasury closed at 5.01%, the 30-year at 5.35%, and the real 30-year at 3.09%. Pattern Nexus correctly identified the September hike risk and the developing QE/liquidity cycle, but underestimated the Fed’s willingness to raise rates against an already enormous debt and refinancing burden. This report asks the question almost nobody asks after a rate decision: what does the hike eventually break? It connects the September decision to the $40-trillion-plus federal debt structure, more than $1 trillion of annual federal net interest expense, Treasury issuance, long-end buybacks, Federal Reserve reserve-management purchases, hedge-fund leverage, the Treasury basis trade, private credit, housing, commercial real estate, household cashflow and the 2019 repo-market precedent. The conclusion is not that the Fed has deliberately chosen to create a crash. It is that monetary architecture now allows the Fed to tighten the price of credit while separately protecting reserves and market plumbing. The hike therefore does not invalidate the Pattern Nexus QE thesis. If long rates remain near current levels, it accelerates the transmission mechanism that can eventually force the next phase of liquidity support.
Published Sep 17, 2026 Article · related
QE 2026, Phase Two: When the Long End Forces Duration Control
The Fed already ended QT and expanded Treasury holdings through bill-focused reserve-management purchases, but that repaired the reserve layer without suppressing the long end. With the 10-year Treasury at 4.95%, the 30-year at 5.37%, real long yields near the Pattern Nexus red zone, Treasury doubling long-end buybacks, and August CPI limiting conventional easing, this report calculates the probability that QE 2026 moves into a second phase. It maps the likely program, the names it may use, the dates when it could expand, and the exact yield, reserve, auction, repo, leverage, and credit conditions that could force direct duration absorption.
Published Sep 11, 2026 Article · related
August CPI Just Activated the Fed’s One-Hike Option—and Deepened the Long-End Trap
August CPI rose 0.4% on the month and 3.4% from a year earlier, while core CPI rose a hotter-than-expected 0.3% even as its annual rate eased to 2.4%. Pattern Nexus decomposes the report into an energy shock, a narrow communications-and-travel core impulse, and still-slow rent inflation. The result activates the Fed’s one-hike option for September, but it does not yet prove that a broad new inflation cycle has begun. This premium report maps the policy decision, the 80% PN September-hike probability, the long-end trap near 5%, the household cashflow squeeze, the rate-policy-versus-liquidity-plumbing contradiction, and the exact data that would confirm or invalidate the call.
Published Sep 11, 2026 Article · related
Two Economies, One Balance Sheet: The Unstable Barbell of 2026
Reserve support has returned, but real long rates, fiscal supply, and an AI-energy capital wave are splitting the U.S. economy between capital strength and household fragility. This data-rich Pattern Nexus report maps the four feedback loops connecting Federal Reserve plumbing, Treasury duration, fiscal interest, housing lock-in, household credit, labor churn, AI infrastructure, power demand, dollar rails, and gold. It closes with four scenarios, a public-call audit, and a 90-day trigger dashboard.
Published Sep 9, 2026 Video · related
The Leverage Machine — Audio-Video Edition
Episode 5 of the weekly Pattern Nexus audio-video series turns Part 5 of Cycles of Power into a shorter story about how the Volcker shock, Reagan–Thatcher deregulation, market-based credit, junk bonds, leveraged buyouts, securitization, derivatives, and electronic finance made leverage the central growth engine between 1979 and 1994.
Published Sep 7, 2026 Article · related
Warsh Turns Jackson Hole Into a Rate-Hike Liquidity Shock
Kevin Warsh’s Jackson Hole speech gave markets a hawkish Fed signal, with AP reporting a jump in the two-year Treasury yield after the remarks. Warsh tied the policy debate to persistent inflation, strong AI-related investment, and a less guidance-heavy central bank communication regime. Pattern Nexus reads the speech as a liquidity-regime shift: inflation credibility now sits above market comfort.
Published Aug 28, 2026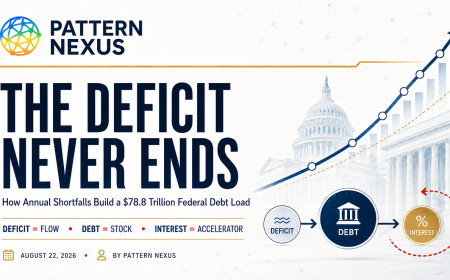 Article · related
The Deficit Never Ends: How Annual Shortfalls Build a $78.8 Trillion Federal Debt Load
Most people use “deficit” and “debt” as if they mean the same thing. They do not. This report uses two Pattern Nexus infographics and official CBO and Treasury data to map the annual federal deficit and total federal debt from 2020 through 2040, explain why interest creates a self-reinforcing feedback loop, and show why the 10-year and 30-year Treasury yields—not a political debt-clock slogan—are the market constraint that matters.
Published Aug 22, 2026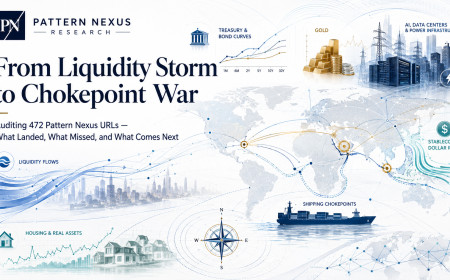 Article · related
From Liquidity Storm to Chokepoint War: Auditing 472 Pattern Nexus URLs — What Landed, What Missed, and What Comes Next
I audited the public Pattern Nexus record across 472 unique URLs and the saved full-text article export, then rebuilt the major calls from the original wording. This long-form report scores the liquidity/QT pivot, gold, the sub-3% 10-year miss, housing, stablecoin/Treasury rails, Venezuela, Iran/Hormuz, China/Taiwan, Greenland, AI power, robotics and the war economy, and finishes with a falsifiable map of what comes next.
Published Aug 20, 2026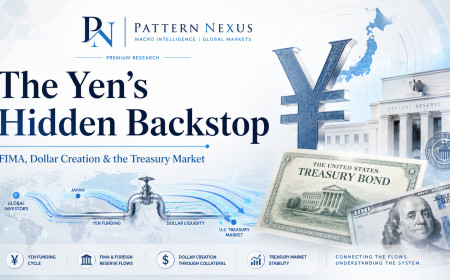 Article · related
The Yen's Hidden Backstop: FIMA, Dollar Creation and the Treasury Market
Japan's 2026 yen intervention was enormous, but Federal Reserve balance-sheet data show FIMA was not used to fund it. That may be the more important finding. FIMA sits behind the global dollar system as a mechanism allowing approved foreign monetary authorities to temporarily turn U.S. Treasury collateral into newly supplied dollars instead of selling those Treasuries into the market. This report examines what FIMA actually does, why it is a form of temporary central-bank dollar creation rather than QE, what Japan's reserve structure looks like, and why another serious yen crisis could migrate directly into U.S. Treasury-market plumbing.
Published Aug 19, 2026 Video · related
The Dollar Fortress — Audio-Video Edition
Episode 2 of the Pattern Nexus Audio-Video series explains how Bretton Woods, the Marshall Plan, capital controls, the IMF, the World Bank, and the 1951 Treasury–Federal Reserve Accord forged the first dollar-liquidity regime between 1947 and 1953.
Published Aug 16, 2026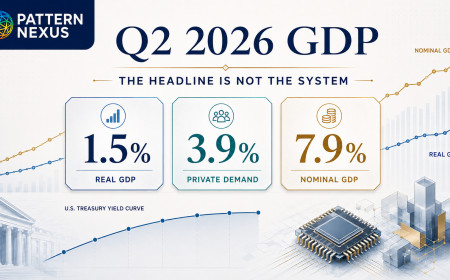 Article · related
GDP Slowed to 1.5%—But the U.S. Economy Did Not Weaken the Way the Headline Implies
Real GDP slowed to a 1.5% annual rate in Q2 2026, but the private domestic economy accelerated to 3.9% while nominal GDP grew 7.9%. This Pattern Nexus analysis separates the headline from the internal economy and explains what consumer spending, business investment, capital-goods imports, inflation, government accounting, Federal Reserve policy, and the 10-year Treasury signal actually mean.
Published Aug 4, 2026 Article · related
Pattern Nexus Macro Archive: 328 Timestamped Articles, October 2025–July 2026
A guided public index of 328 timestamped Pattern Nexus articles covering Federal Reserve liquidity, interest rates, the dollar, gold and silver, housing, real estate, markets, debt, banking, energy, trade, industrial buildout, and geopolitical transmission. Each section explains what readers will find, what they will learn, and where to begin.
Published Jul 30, 2026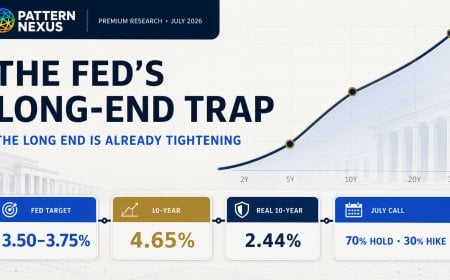 Article · related
The Fed’s Long-End Trap: Why a 4.65% 10-Year Is Already Doing the Tightening
A full July 2026 data reconstruction of the Federal Reserve’s next policy path, showing how a 4.65% nominal 10-year, 2.44% real 10-year, Treasury supply, oil risk and uneven liquidity conditions create a hawkish-hold trap.
Published Jul 27, 2026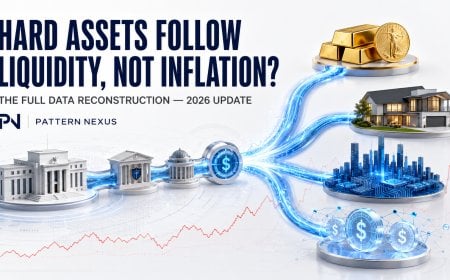 Article · related
Hard Assets Follow Liquidity, Not Inflation? The Full Data Reconstruction — 2026 Update
A 2003–2026 reconstruction of Fed liquidity, gold, housing and NASDAQ data, plus an experimental stablecoin-augmented liquidity index. Meta tags: liquidity conditions index, hard assets, gold, Federal Reserve balance sheet, Treasury General Account, reverse repo, M2, stablecoins, tokenized Treasuries, housing, NASDAQ, PCA
Published Jul 26, 2026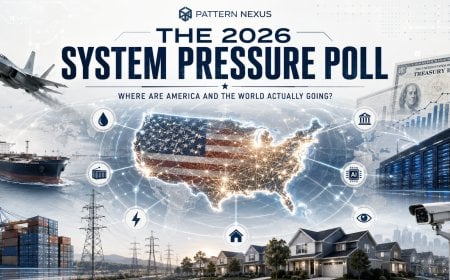 Poll · related
The 2026 System Pressure Poll: Where Are America and the World Actually Going?
This is not another left-versus-right approval poll. The Pattern Nexus System Pressure Poll examines the deeper structures shaping current events: war, energy, shipping corridors, debt, interest rates, tariffs, artificial intelligence, surveillance, housing, automation, institutional trust, and the emerging global order. The daily headlines are downstream. The objective is to identify which systems people believe are actually driving events—and where those systems are taking the United States and the rest of the world.
Published Jul 24, 2026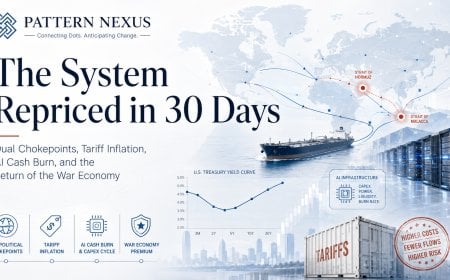 Article · related
The System Repriced in 30 Days: Dual Chokepoints, Tariff Inflation, AI Cash Burn, and the Return of the War Economy
In thirty days, the operating assumptions underneath the global system changed. Two maritime chokepoints came under pressure, the United States expanded war financing and rebuilt its tariff architecture, inflation moved back upstream, long-term yields repriced, AI infrastructure crossed into cash-burn territory, strategic minerals became permissioned leverage, and political command structures began cracking. This Pattern Nexus analysis maps those events as one connected system rather than separate headlines.
Published Jul 24, 2026 Article · related
The Capital Ladder: Where $100 to $1 Trillion Places You in the Global and American Wealth System
A deep Pattern Nexus regression and data analysis mapping where net worth levels from $100 to $1 trillion place an individual within the global and American wealth distributions. The research separates actual net worth from liquidity, accessible credit, gross capital control, leverage, and daily capital-producing capacity. Where do you actually sit within the global wealth system—and how does that position change when we measure not only what you own, but how much capital you can access? This research maps wealth levels from $100, $500, and $1,000 through $1 million, $1 billion, $100 billion, and the theoretical $1 trillion threshold. Global and American wealth distributions are analyzed separately using regression models, percentile estimates, Federal Reserve household data, international wealth-distribution research, and 17 original charts and visualizations. The analysis distinguishes net worth from liquid wealth, available credit, collateral-backed borrowing capacity, and gross capital controlled. It then models how productive leverage can accelerate wealth growth, how destructive leverage can erase equity, and how much daily capital output different levels of wealth may generate. Net worth measures ownership. Liquidity measures deployability. Credit measures reach. Leverage amplifies the result. Capital efficiency determines whether that amplification creates wealth or debt.
Published Jul 10, 2026Join Pattern Nexus for premium research, the archive, and ad-free reading.