

10-year
Automatically indexed from the existing article tag.
Theses, forecasts, models, and paths
No published research objects yet
This topic is ready for editors to connect a thesis, forecast, model, or research path.
Latest articles
 Article · related
What If the 6–7% Treasury Yield Trade Is the Trap?
A lot of smart money is starting to position for a 1970s-style inflation repeat where the 10-year Treasury yield spikes toward 6% or 7%. The chart overlay looks convincing. Inflation today can be lined up against the 1970s if the data is shifted and framed the right way. But Pattern Nexus looks at the system constraint, not just the chart. The question is not whether yields can spike. They can. The question is whether the modern economy, the federal refinancing structure, the consumer balance sheet, and the dollar-based global liquidity system can actually survive a sustained 6–7% long-rate environment. This article argues that the more dangerous trade may be the obvious one: expecting the 1970s to repeat cleanly when the system may instead force a spike, break, recession, emergency response, and renewed liquidity cycle.
Published May 27, 2026 Article · related
Market Wrap 01.05.26: The Duration Bid Turns On Everything
Stocks ripped, metals ripped, and the 10-year backed off to ~4.16% as weak ISM data and Venezuela geopolitics pushed investors into duration. Dow flirted with 49K, gold tagged new highs, oil bounced, and crypto stayed bid.
Published Jan 5, 2026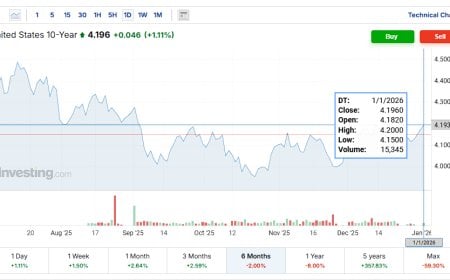 Article · related
The 10-Year Decoupling: Why Long Rates No Longer Follow Cuts
The U.S. 10-year Treasury is no longer responding to policy rate cuts. This article explains the structural decoupling between front-end easing and long-end yields, why this regime persists for months to years, and what conditions eventually force balance sheet expansion.
Published Jan 2, 2026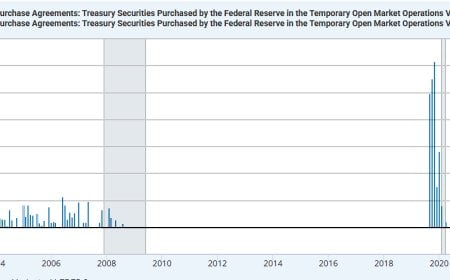 Article · related
The 10-Year Treasury Pattern and the Return of Repo Operations
The 10-Year Treasury has repeatedly stalled near long-cycle resistance while overnight repo operations have quietly returned after QT. This analysis examines how funding markets, balance-sheet capacity, and rate control interact beneath headline narratives.
Published Dec 29, 2025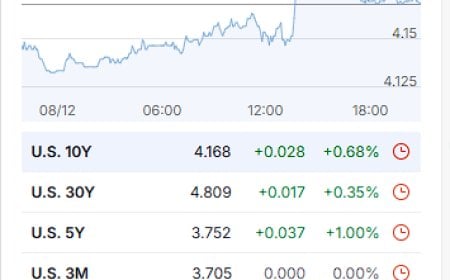 Article · related
Daily Market Wrap-Up – December 8, 2025
Daily cross-asset wrap for December 8, 2025. Equities faded into the close while the 10-year Treasury pushed higher toward 4.2% even as markets price in a near-certain Fed rate cut this week. Commodities softened, the dollar treaded water, and crypto stayed bid.
Published Dec 8, 2025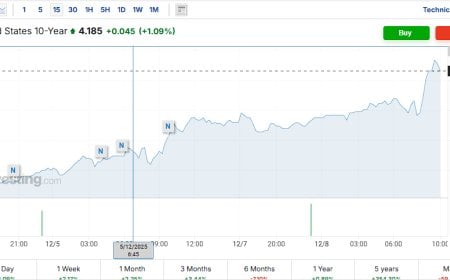 Article · related
GoGoGadget 10-Year: Why Yields Are Rising Into Rate Cuts
The U.S. 10-year just broke above the 4.15% zone even as futures price a near-certain Fed rate cut. This Pattern Nexus breakdown explains why long yields can rise into cuts, what the bond market is signaling about QT, term premium, and collateral stress, and how it fits the 2026 liquidity regime shift.
Published Dec 8, 2025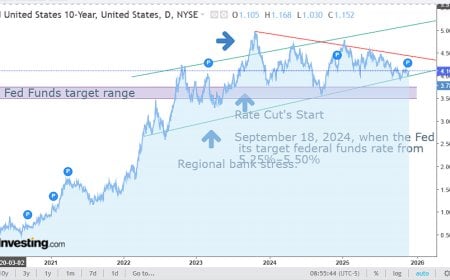 Article · related
The 10-Year Isn’t Misbehaving — It’s Warning the System Is Out of Liquidity
The U.S. 10-year yield is rising into rate cuts — not because the market is irrational, but because the financial system is operating on the liquidity floor. This article explains how regional bank failures, QT exhaustion, and the September 18, 2024 rate-cut pivot created the wedge pattern now signaling the next major regime shift.
Published Dec 2, 2025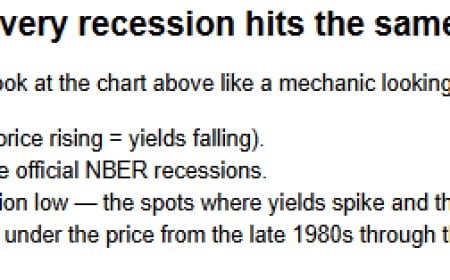 Article · related
Can the 10-Year Treasury Predict Recessions? A 40-Year Pattern Nexus Lens Analysis
A 40-year structural analysis of the US 10-Year Treasury futures market, showing how recessions consistently collide with long-term yield channels, why yield curve inversions continue to matter, and what today’s setup means for the next macro cycle. A full Pattern Nexus Lens breakdown.
Published Nov 20, 2025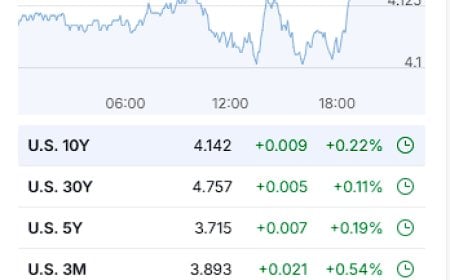 Article · related
Market Wrap – November 19, 2025: Nvidia Crushes Earnings, AI Flywheel Accelerates, and the 10-Year Tightens Again
Nvidia crushed earnings and boosted guidance, but stocks barely moved as the 10-year pushed toward 4.15% and Fed minutes signaled caution. Full Pattern Nexus analysis.
Published Nov 19, 2025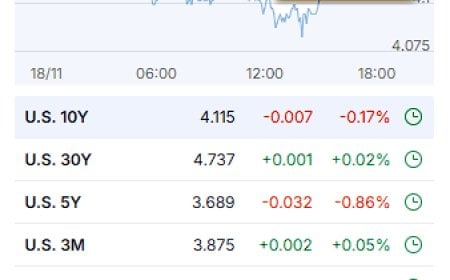 Article · related
Market Wrap – November 18, 2025: Tech Cracks, Oil Holds, and the 10-Year Drifts But Doesn’t Break
Tech stocks dragged the market lower as the Dow fell nearly 500 points, oil held above $60, and the 10-year drifted near 4.11% in a mixed macro session.
Published Nov 18, 2025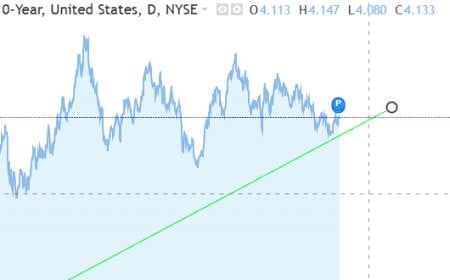 Article · related
The Gravity Zone: How the 10-Year Treasury Revealed the Real Neutral Rate
The 10-year Treasury has been oscillating around a hidden 3–4% neutral zone since 2022, revealing the true equilibrium rate the Fed keeps missing. This article breaks down why long rates refuse to fall, why the market no longer trusts traditional rate cuts, how the Treasury’s trillion-dollar TGA fits into the picture, and why quiet yield-curve management is becoming the new operating system of U.S. monetary policy.
Published Nov 18, 2025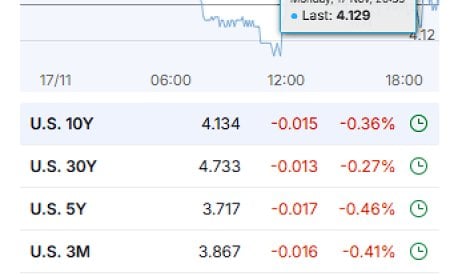 Article · related
Market Wrap – November 17, 2025: Everything Red, but the 10-Year Still Runs the Show
Broad selloff across equities, metals, and crypto, while the dollar firms and the 10-year Treasury continues to defy the Fed’s 2026 rate-cut script.
Published Nov 17, 2025