

CPI
Automatically indexed from the existing article tag.
Theses, forecasts, models, and paths
No published research objects yet
This topic is ready for editors to connect a thesis, forecast, model, or research path.
Latest articles
 Article · related
The Recession Path: How Income, Investment and Credit Can Turn a Technology Boom Into an Economic Reset
A forward model links income, spending, investment and credit, then tests its forecasts against modern U.S. data and 150 years of macrohistory. Growth remains the baseline. The research quantifies the route into recession and the severe, persistent conditions required for a deeper economic reset.
Published Oct 17, 2026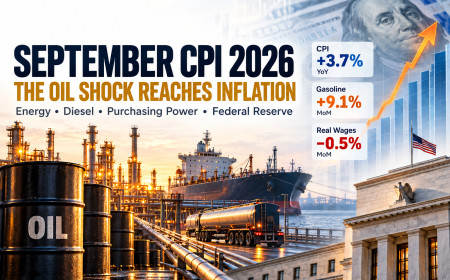 Article · related
September CPI: Inflation Is Running Hot—and the Oil Work Explains Why
September CPI rose 0.6% for the month and 3.7% over the year, with gasoline responsible for more than half the monthly increase. I connect the report to the earlier Pattern Nexus oil, inventory, diesel and fertilizer research, explain the damage to real wages, and update the Fed and liquidity sequence.
Published Oct 15, 2026 Article · related
QE 2026, Phase Two: When the Long End Forces Duration Control
The Fed already ended QT and expanded Treasury holdings through bill-focused reserve-management purchases, but that repaired the reserve layer without suppressing the long end. With the 10-year Treasury at 4.95%, the 30-year at 5.37%, real long yields near the Pattern Nexus red zone, Treasury doubling long-end buybacks, and August CPI limiting conventional easing, this report calculates the probability that QE 2026 moves into a second phase. It maps the likely program, the names it may use, the dates when it could expand, and the exact yield, reserve, auction, repo, leverage, and credit conditions that could force direct duration absorption.
Published Sep 11, 2026 Article · related
Two Economies, One Balance Sheet: The Unstable Barbell of 2026
Reserve support has returned, but real long rates, fiscal supply, and an AI-energy capital wave are splitting the U.S. economy between capital strength and household fragility. This data-rich Pattern Nexus report maps the four feedback loops connecting Federal Reserve plumbing, Treasury duration, fiscal interest, housing lock-in, household credit, labor churn, AI infrastructure, power demand, dollar rails, and gold. It closes with four scenarios, a public-call audit, and a 90-day trigger dashboard.
Published Sep 9, 2026 Article · related
The Oil Inventory War Machine: How Long the Global Buffer Can Hold
A full Pattern Nexus reconstruction of U.S. and global oil inventories from the 1970s through the 2026 war shock, including original regressions, depletion scenarios, strategic reserves, refinery constraints, inflation, growth, rates and the path forward. Meta keywords: oil inventory, global oil stocks, U.S. crude inventories, Strategic Petroleum Reserve, SPR, Strait of Hormuz, Iran war, oil shock, petroleum products, diesel inventories, refinery capacity, inflation, CPI, recession, Treasury yields, liquidity, war economy, energy security, Pattern Nexus
Published Aug 2, 2026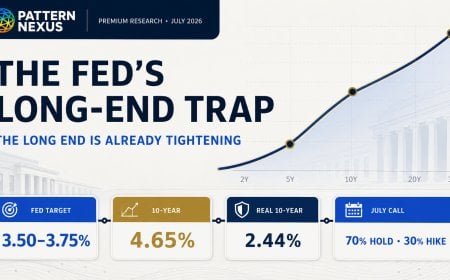 Article · related
The Fed’s Long-End Trap: Why a 4.65% 10-Year Is Already Doing the Tightening
A full July 2026 data reconstruction of the Federal Reserve’s next policy path, showing how a 4.65% nominal 10-year, 2.44% real 10-year, Treasury supply, oil risk and uneven liquidity conditions create a hawkish-hold trap.
Published Jul 27, 2026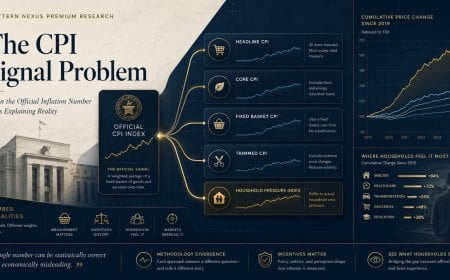 Article · related
The CPI Signal Problem: When the Official Inflation Number Stops Explaining Reality
A Pattern Nexus data analysis audit using official BLS CPI data from 1960 through April 2026 to compare headline inflation against fixed-basket, current-method, and trimmed-basket frameworks.
Published Jun 10, 2026 Article · related
What If the 6–7% Treasury Yield Trade Is the Trap?
A lot of smart money is starting to position for a 1970s-style inflation repeat where the 10-year Treasury yield spikes toward 6% or 7%. The chart overlay looks convincing. Inflation today can be lined up against the 1970s if the data is shifted and framed the right way. But Pattern Nexus looks at the system constraint, not just the chart. The question is not whether yields can spike. They can. The question is whether the modern economy, the federal refinancing structure, the consumer balance sheet, and the dollar-based global liquidity system can actually survive a sustained 6–7% long-rate environment. This article argues that the more dangerous trade may be the obvious one: expecting the 1970s to repeat cleanly when the system may instead force a spike, break, recession, emergency response, and renewed liquidity cycle.
Published May 27, 2026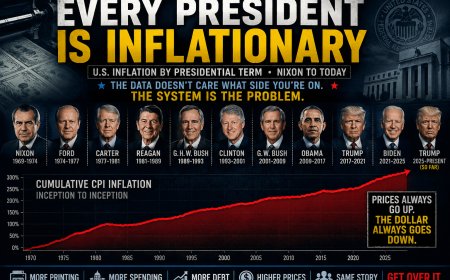 Article · related
Every President Is Inflationary: The Inflation Chart Both Parties Do Not Want to Read
A Pattern Nexus breakdown of U.S. inflation by presidential term from Nixon to today, showing why the argument over which party “caused inflation” misses the deeper system. Every modern president has governed inside an inflationary debt-based dollar structure. Some periods were worse than others, but the larger pattern is not partisan. It is monetary, fiscal, energy-driven, debt-driven, and structural.
Published May 15, 2026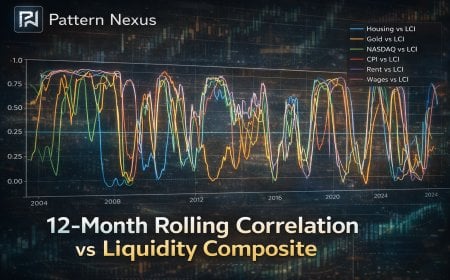 Article · related
The Plumbing Update (2003–2025) Q4 2025 + Jan 26
A full rebuild of the Pattern Nexus liquidity framework using end-of-month data, z-scores, and a PCA composite (WALCL, TGA, RRP, M2). If you want to understand housing, gold, and tech, stop arguing CPI and start watching the pipes.
Published Feb 27, 2026 Article · related
Market Wrap – January 16, 2025: CPI Relief Cools, Yields Slide, Oil Loses the Security Premium
U.S. stocks dipped after Wednesday’s CPI-fueled surge as investors parsed earnings and fresh data. Treasury yields eased after Waller comments, gold climbed, oil settled lower as Red Sea risk premium faded, and the dollar softened versus the yen ahead of the inauguration.
Published Jan 16, 2026 Article · related
Energy Isn’t Spiking, Utilities Are: AI Baseload, Gas Turbines, and the Reprice of Energy Services
CPI “energy” is splitting into two stories: gasoline is deflating while electricity and utility gas inflate. This is a structural load + grid constraint regime, increasingly driven by data centers/AI and met by gas turbines, capex pass-through, and delivered-fuel premia.
Published Jan 14, 2026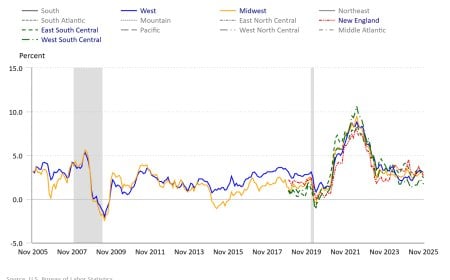 Article · related
CPI (November 2025): Headline Cooling, Energy Re-Acceleration, and the “Two-Month CPI” Problem
Open the published research article.
Published Dec 18, 2025 Article · related
Inflation at 3.0%: The Illusion of Stability and the Inevitable Liquidity Pivot
"3% CPI isn’t stability—it’s controlled volatility in a debt-saturated system, forcing the Fed toward rate cuts and stealth QE to keep credit flowing.
Published Oct 24, 2025