

federal debt
Automatically indexed from the existing article tag.
Theses, forecasts, models, and paths
No published research objects yet
This topic is ready for editors to connect a thesis, forecast, model, or research path.
Latest articles
 Article · related
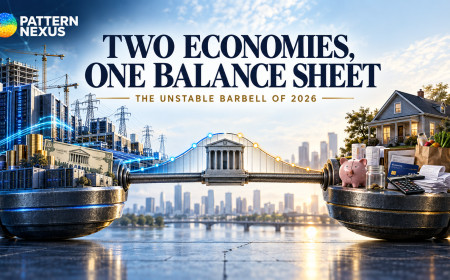
Two Economies, One Balance Sheet: The Unstable Barbell of 2026
Reserve support has returned, but real long rates, fiscal supply, and an AI-energy capital wave are splitting the U.S. economy between capital strength and household fragility. This data-rich Pattern Nexus report maps the four feedback loops connecting Federal Reserve plumbing, Treasury duration, fiscal interest, housing lock-in, household credit, labor churn, AI infrastructure, power demand, dollar rails, and gold. It closes with four scenarios, a public-call audit, and a 90-day trigger dashboard.
Published Sep 9, 2026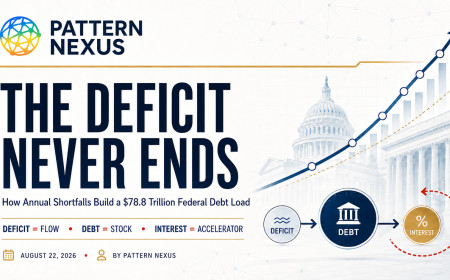 Article · related
The Deficit Never Ends: How Annual Shortfalls Build a $78.8 Trillion Federal Debt Load
Most people use “deficit” and “debt” as if they mean the same thing. They do not. This report uses two Pattern Nexus infographics and official CBO and Treasury data to map the annual federal deficit and total federal debt from 2020 through 2040, explain why interest creates a self-reinforcing feedback loop, and show why the 10-year and 30-year Treasury yields—not a political debt-clock slogan—are the market constraint that matters.
Published Aug 22, 2026 Article · related
What If the 6–7% Treasury Yield Trade Is the Trap?
A lot of smart money is starting to position for a 1970s-style inflation repeat where the 10-year Treasury yield spikes toward 6% or 7%. The chart overlay looks convincing. Inflation today can be lined up against the 1970s if the data is shifted and framed the right way. But Pattern Nexus looks at the system constraint, not just the chart. The question is not whether yields can spike. They can. The question is whether the modern economy, the federal refinancing structure, the consumer balance sheet, and the dollar-based global liquidity system can actually survive a sustained 6–7% long-rate environment. This article argues that the more dangerous trade may be the obvious one: expecting the 1970s to repeat cleanly when the system may instead force a spike, break, recession, emergency response, and renewed liquidity cycle.
Published May 27, 2026 Article · related
When $38 Billion Was a Crisis And $38 Trillion Is a Shrug
A plain-language Pattern Nexus breakdown of how U.S. federal debt went from tens of billions to tens of trillions in a century, why a billion dollars used to move history, and why most people today can’t feel the weight of trillion-dollar policy anymore.
Published Dec 8, 2025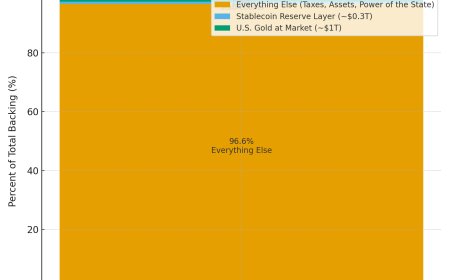 Article · related
The $42 Illusion: How the Market Repriced America’s Gold and Accidentally Revealed the Dollar’s Hidden Backing
Gold hit $4,400 in 2025—but the U.S. still prices its hoard at $42. This article breaks down the real backing of the dollar: gold, stablecoins, and power.
Published Nov 19, 2025