

Government Spending
Automatically indexed from the existing article tag.
Theses, forecasts, models, and paths
No published research objects yet
This topic is ready for editors to connect a thesis, forecast, model, or research path.
Latest articles
 Article · related
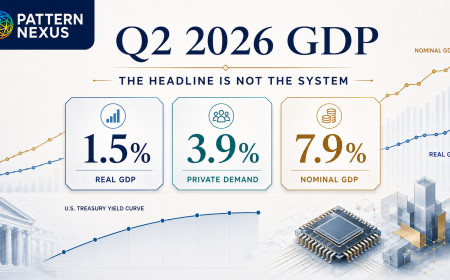
GDP Slowed to 1.5%—But the U.S. Economy Did Not Weaken the Way the Headline Implies
Real GDP slowed to a 1.5% annual rate in Q2 2026, but the private domestic economy accelerated to 3.9% while nominal GDP grew 7.9%. This Pattern Nexus analysis separates the headline from the internal economy and explains what consumer spending, business investment, capital-goods imports, inflation, government accounting, Federal Reserve policy, and the 10-year Treasury signal actually mean.
Published Aug 4, 2026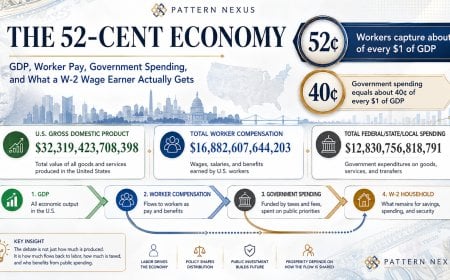 Article · related
The 52-Cent Economy: Where the American Output Dollar Actually Goes
America produces nearly $32 trillion a year, but the median W-2 worker experiences only a fraction of the aggregate output. This Pattern Nexus report maps GDP, total employee compensation, cash wages, government purchases, total government current expenditures, taxes, transfers, and the after-tax worker-capture problem. It tests the claim that only 10 cents of each productivity dollar returns to the people producing the system—and replaces the slogan with a defensible multi-layer accounting model.
Published Jul 19, 2026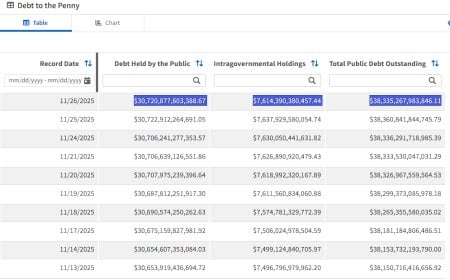 Article · related
The Overburdened Debt Economy: How a $1 Trillion Surge Tightens the Noose on Households, Businesses, and Growth
The U.S. added $1T in new debt in just 82 days. Here’s how rising federal, household, business, and state debts are overloading the economy and pushing rates higher.
Published Nov 29, 2025 Article · related
Debt Without a Cliff: What the US Debt Clock Really Shows
A 35-year walkthrough of the US Debt Clock—from 1990 to 2029—showing how debt, GDP, and government spending really scale, why there is no magic “debt cliff,” and how this ties into CBDCs and tokenised Treasuries.
Published Nov 15, 2025