

Liquidity
Automatically indexed from the existing article tag.
Theses, forecasts, models, and paths
No published research objects yet
This topic is ready for editors to connect a thesis, forecast, model, or research path.
Latest articles
 Article · related
The Recession Path: How Income, Investment and Credit Can Turn a Technology Boom Into an Economic Reset
A forward model links income, spending, investment and credit, then tests its forecasts against modern U.S. data and 150 years of macrohistory. Growth remains the baseline. The research quantifies the route into recession and the severe, persistent conditions required for a deeper economic reset.
Published Oct 17, 2026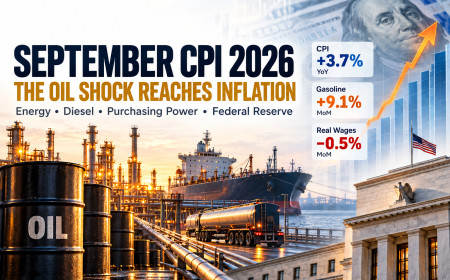 Article · related
September CPI: Inflation Is Running Hot—and the Oil Work Explains Why
September CPI rose 0.6% for the month and 3.7% over the year, with gasoline responsible for more than half the monthly increase. I connect the report to the earlier Pattern Nexus oil, inventory, diesel and fertilizer research, explain the damage to real wages, and update the Fed and liquidity sequence.
Published Oct 15, 2026 Video · related
The Convergence — Audio-Video Edition
The finale of the Pattern Nexus Cycles of Power audio-video series connects 150 years of industrial, monetary, computing, energy, and liquidity history to the emerging convergence of AI infrastructure, fiscal dominance, programmable dollars, hard-asset politics, and competing paths from 2030 to 2045.
Published Oct 12, 2026 Video · related
The Fiscal-Monetary Fusion — Audio-Video Edition
Episode 9 of the weekly Pattern Nexus audio-video series turns Part 9 of Cycles of Power into a shorter story about how pandemic stimulus fused fiscal and monetary policy, inflation forced a violent rate reversal, bank stress produced a new collateral-protection template, and sanctions, AI infrastructure, stablecoins, and tokenized Treasuries transformed liquidity into both operating system and geopolitical weapon between 2020 and 2025.
Published Oct 5, 2026 Article · related
The Real Reason They Are Building Humanoid Robots: The End of Human Labor as the Foundation of the Economy
Humanoid robotics is not simply about building machines that walk, talk, and perform household chores. It is about creating a scalable physical labor force that can operate alongside artificial intelligence, transforming production, ownership, wages, consumer demand, and the monetary system. This analysis connects the robotics revolution to the wider Pattern Nexus framework: structural deflation, expanding liquidity, concentrated ownership, universal intelligence, programmable money, and the transition toward a post-labor economy.
Published Sep 21, 2026 Article · related
Goolsbee Turns AI Data Centers Into a Fed Reaction-Function Test
Chicago Fed President Austan Goolsbee said on September 21, 2026 that policymakers should watch whether AI data-center construction is spilling beyond its sector and pushing aggregate output above capacity. The significance is not that the Fed is targeting AI, but that AI capex is now being discussed as a possible demand shock with implications for inflation and interest-rate policy.
Published Sep 21, 2026 Video · related
The Asian Liquidity Supercycle — Audio-Video Edition
Episode 6 of the weekly Pattern Nexus audio-video series turns Part 6 of Cycles of Power into a shorter story about how liberalized capital flows, dollar borrowing, currency pegs, the Asian Financial Crisis, Russia, LTCM, the dot-com boom, and China's WTO entry created the modern global liquidity supercycle between 1994 and 2001.
Published Sep 13, 2026 Article · related
Two Economies, One Balance Sheet: The Unstable Barbell of 2026
Reserve support has returned, but real long rates, fiscal supply, and an AI-energy capital wave are splitting the U.S. economy between capital strength and household fragility. This data-rich Pattern Nexus report maps the four feedback loops connecting Federal Reserve plumbing, Treasury duration, fiscal interest, housing lock-in, household credit, labor churn, AI infrastructure, power demand, dollar rails, and gold. It closes with four scenarios, a public-call audit, and a 90-day trigger dashboard.
Published Sep 9, 2026 Article · related
Warsh Turns Jackson Hole Into a Rate-Hike Liquidity Shock
Kevin Warsh’s Jackson Hole speech gave markets a hawkish Fed signal, with AP reporting a jump in the two-year Treasury yield after the remarks. Warsh tied the policy debate to persistent inflation, strong AI-related investment, and a less guidance-heavy central bank communication regime. Pattern Nexus reads the speech as a liquidity-regime shift: inflation credibility now sits above market comfort.
Published Aug 28, 2026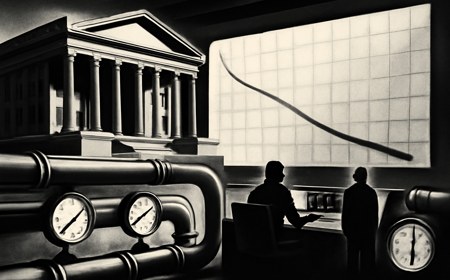 Article · related
Treasury Turns Long-Bond Buybacks Into a Yield-Control Test
Treasury said it will raise maximum liquidity-support buybacks in the 10-to-20-year and 20-to-30-year nominal coupon sectors from $2 billion to at least $4 billion per operation beginning September 9, 2026. Follow-up reporting from AP, Reuters and Axios shows the market treated the move as an attempted long-end yield intervention, but the initial relief faded quickly. The Pattern Nexus read: this is not formal yield-curve control, but it is a live test of whether Treasury plumbing can absorb stress that monetary policy credibility and fiscal math are failing to contain.
Published Aug 22, 2026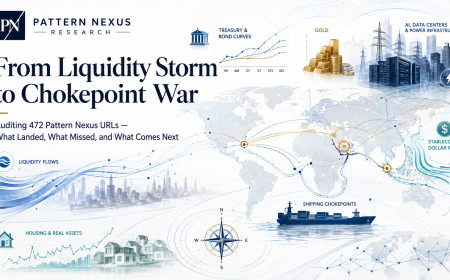 Article · related
From Liquidity Storm to Chokepoint War: Auditing 472 Pattern Nexus URLs — What Landed, What Missed, and What Comes Next
I audited the public Pattern Nexus record across 472 unique URLs and the saved full-text article export, then rebuilt the major calls from the original wording. This long-form report scores the liquidity/QT pivot, gold, the sub-3% 10-year miss, housing, stablecoin/Treasury rails, Venezuela, Iran/Hormuz, China/Taiwan, Greenland, AI power, robotics and the war economy, and finishes with a falsifiable map of what comes next.
Published Aug 20, 2026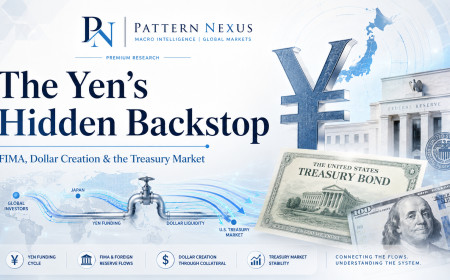 Article · related
The Yen's Hidden Backstop: FIMA, Dollar Creation and the Treasury Market
Japan's 2026 yen intervention was enormous, but Federal Reserve balance-sheet data show FIMA was not used to fund it. That may be the more important finding. FIMA sits behind the global dollar system as a mechanism allowing approved foreign monetary authorities to temporarily turn U.S. Treasury collateral into newly supplied dollars instead of selling those Treasuries into the market. This report examines what FIMA actually does, why it is a form of temporary central-bank dollar creation rather than QE, what Japan's reserve structure looks like, and why another serious yen crisis could migrate directly into U.S. Treasury-market plumbing.
Published Aug 19, 2026 Article · related
The Sun, Money and the Global Core: What Survived a 375-Year Test
I rebuilt the solar-recession thesis around the dominant global financial core instead of a modern U.S. sample: Amsterdam and the guilder, London and sterling, then New York and the dollar. Across 375 years, the data reveal a narrow combined turning-year anomaly and a strange six-year lead. The deeper pass separates minima from maxima, tests six contraction thresholds and shock exclusions, reconstructs 54 reserve handoffs, deletes every historical block and contraction event, and adds lagged liquidity-interaction models. The effect is not a solar-minimum law, disappears for severe contractions, concentrates in 1850–1899, and does not validate through crops, famine or liquidity interactions. Solar timing may overlay a vulnerable system. Liquidity remains the engine.
Published Aug 17, 2026 Video · related
The Dollar Fortress — Audio-Video Edition
Episode 2 of the Pattern Nexus Audio-Video series explains how Bretton Woods, the Marshall Plan, capital controls, the IMF, the World Bank, and the 1951 Treasury–Federal Reserve Accord forged the first dollar-liquidity regime between 1947 and 1953.
Published Aug 16, 2026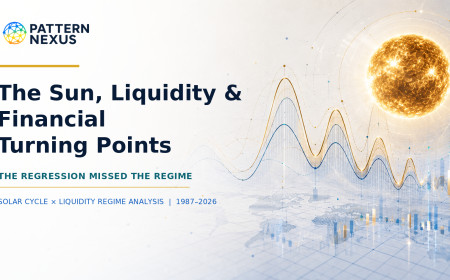 Article · related
The Sun, Liquidity, and Financial Turning Points: The Regression Missed the Regime
A corrected Pattern Nexus analysis of solar cycles, liquidity, recessions, and financial tops from January 1987 through July 2026. The first monthly regression rejected a short-horizon trading signal. The properly specified regime test found that all four U.S. recession onsets in the sample occurred within twelve months of an official solar maximum or minimum, recession months were sharply concentrated around those extrema, and M2 growth was faster on official solar rising legs.
Published Aug 10, 2026 Video · related
The First AI Age — Pattern Nexus Audio-Video Edition
The first weekly Pattern Nexus audio-video turns the 1870–1914 industrial supercycle into a concise narrated story—and shows why the AI, data-center, energy, and liquidity buildout of 2025–2035 rhymes with it.
Published Aug 8, 2026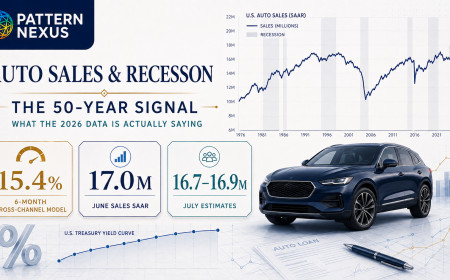 Article · related
Are Auto Sales Predicting a Recession? A 50-Year Regression and the 2026 Signal
Vehicle sales normally weaken before recession becomes obvious elsewhere. Pattern Nexus reconstructs every U.S. recession since 1976, builds auto-only and cross-channel recession models, audits prices, financing, delinquency and buyer concentration, and explains why strong mid-2026 sales reject an immediate recession call without proving broad household strength.
Published Aug 6, 2026 Article · related
The Oil Inventory War Machine: How Long the Global Buffer Can Hold
A full Pattern Nexus reconstruction of U.S. and global oil inventories from the 1970s through the 2026 war shock, including original regressions, depletion scenarios, strategic reserves, refinery constraints, inflation, growth, rates and the path forward. Meta keywords: oil inventory, global oil stocks, U.S. crude inventories, Strategic Petroleum Reserve, SPR, Strait of Hormuz, Iran war, oil shock, petroleum products, diesel inventories, refinery capacity, inflation, CPI, recession, Treasury yields, liquidity, war economy, energy security, Pattern Nexus
Published Aug 2, 2026 Article · related
Pattern Nexus Macro Archive: 328 Timestamped Articles, October 2025–July 2026
A guided public index of 328 timestamped Pattern Nexus articles covering Federal Reserve liquidity, interest rates, the dollar, gold and silver, housing, real estate, markets, debt, banking, energy, trade, industrial buildout, and geopolitical transmission. Each section explains what readers will find, what they will learn, and where to begin.
Published Jul 30, 2026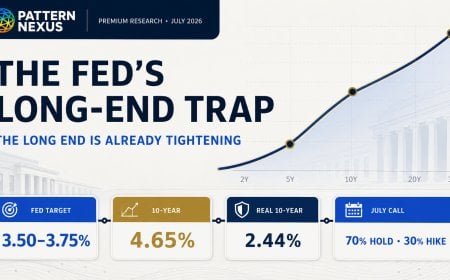 Article · related
The Fed’s Long-End Trap: Why a 4.65% 10-Year Is Already Doing the Tightening
A full July 2026 data reconstruction of the Federal Reserve’s next policy path, showing how a 4.65% nominal 10-year, 2.44% real 10-year, Treasury supply, oil risk and uneven liquidity conditions create a hawkish-hold trap.
Published Jul 27, 2026 Article · related
Hard Assets Follow Liquidity, Not Inflation? The Full Data Reconstruction — 2026 Update
A 2003–2026 reconstruction of Fed liquidity, gold, housing and NASDAQ data, plus an experimental stablecoin-augmented liquidity index. Meta tags: liquidity conditions index, hard assets, gold, Federal Reserve balance sheet, Treasury General Account, reverse repo, M2, stablecoins, tokenized Treasuries, housing, NASDAQ, PCA
Published Jul 26, 2026 Article · related
Pattern Nexus Worldview — Full Digital Edition
Read the complete 10-chapter digital edition of Pattern Nexus Worldview by Christopher Grenke. A systems-level examination of money, liquidity, markets, energy, AI, geopolitics, sovereignty, society, control systems, and the architecture shaping the modern world.
Published Jul 26, 2026 Article · related
The Capital Ladder: Where $100 to $1 Trillion Places You in the Global and American Wealth System
A deep Pattern Nexus regression and data analysis mapping where net worth levels from $100 to $1 trillion place an individual within the global and American wealth distributions. The research separates actual net worth from liquidity, accessible credit, gross capital control, leverage, and daily capital-producing capacity. Where do you actually sit within the global wealth system—and how does that position change when we measure not only what you own, but how much capital you can access? This research maps wealth levels from $100, $500, and $1,000 through $1 million, $1 billion, $100 billion, and the theoretical $1 trillion threshold. Global and American wealth distributions are analyzed separately using regression models, percentile estimates, Federal Reserve household data, international wealth-distribution research, and 17 original charts and visualizations. The analysis distinguishes net worth from liquid wealth, available credit, collateral-backed borrowing capacity, and gross capital controlled. It then models how productive leverage can accelerate wealth growth, how destructive leverage can erase equity, and how much daily capital output different levels of wealth may generate. Net worth measures ownership. Liquidity measures deployability. Credit measures reach. Leverage amplifies the result. Capital efficiency determines whether that amplification creates wealth or debt.
Published Jul 10, 2026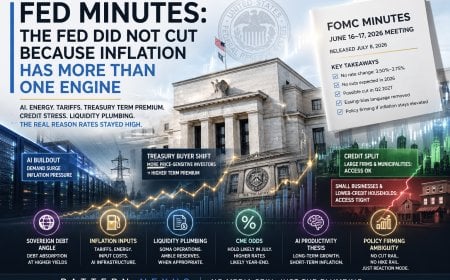 Article · related
Fed Minutes: The Cut Trade Broke Because Inflation Has More Than One Engine
The June 16–17 FOMC minutes, released July 8, show a Fed that held rates steady but removed the easy easing bias. The deeper signal is that inflation pressure is now coming from multiple rails at once: tariffs, Middle East energy shock risk, AI infrastructure demand, Treasury term premium, and uneven consumer credit stress.
Published Jul 8, 2026 Article · related
Gold Was Right. The 10-Year Was Early. The War Premium Changed the Rate Path.
The original Pattern Nexus gold call hit the structural move: gold was not just trading inflation, it was repricing liquidity, policy failure, and the collateral stack. The miss was the 10-year yield. It did not break into the high-2% range because two wars changed the inflation, oil, shipping, deficit, and term-premium path after the gold call was already made.
Published Jun 14, 2026 Article · related
The Oil Cushion Is Breaking: Hormuz, Inventories, and the Liquidity Shock Hiding Inside Energy
Oil Crisis, Strait of Hormuz, Hormuz, Energy Shock, Inflation, Brent Crude, WTI Crude, Strategic Petroleum Reserve, SPR, Oil Inventories, Global Oil Supply, Gasoline Prices, Diesel Prices, Refining, Crack Spreads, Federal Reserve, Liquidity, Recession Risk, Macro, Geopolitics, Pattern Nexus
Published Jun 1, 2026 Video · related
Pattern Nexus Framework: How to See the Hidden Architecture of the Modern World
Pattern Nexus is not just a news site, market blog, or opinion page. It is a framework for reading the modern world as a layered system of liquidity, energy, infrastructure, incentives, control rails, technology, markets, and human behavior. This article explains the Pattern Nexus lens, why it matters, how to use it, and where to begin if you are new to the site.
Published May 29, 2026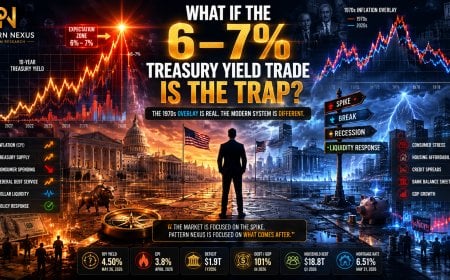 Article · related
What If the 6–7% Treasury Yield Trade Is the Trap?
A lot of smart money is starting to position for a 1970s-style inflation repeat where the 10-year Treasury yield spikes toward 6% or 7%. The chart overlay looks convincing. Inflation today can be lined up against the 1970s if the data is shifted and framed the right way. But Pattern Nexus looks at the system constraint, not just the chart. The question is not whether yields can spike. They can. The question is whether the modern economy, the federal refinancing structure, the consumer balance sheet, and the dollar-based global liquidity system can actually survive a sustained 6–7% long-rate environment. This article argues that the more dangerous trade may be the obvious one: expecting the 1970s to repeat cleanly when the system may instead force a spike, break, recession, emergency response, and renewed liquidity cycle.
Published May 27, 2026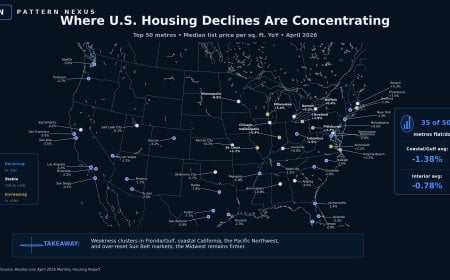 Article · related
The Coastal Housing Repricing Map: Where the U.S. Housing Plateau Is Starting to Crack
The U.S. housing market is not crashing everywhere. It is repricing where the affordability stack broke first: coastal price towers, insurance-stressed Florida and Gulf markets, high-rate West Coast metros, and over-reset Sun Belt cities where sellers are finally forced to meet buyers where they are. Realtor.com’s April 2026 top-50 metro data shows 35 of 50 major metros flat or down on median list price per square foot. Case-Shiller confirms the same slowdown through repeat-sales data. Pattern Nexus called this structure months ago: not a clean 2008-style collapse, but a fragmented housing plateau where geography, rates, insurance, taxes, liquidity, and cash-flow math decide which markets hold and which markets reprice.
Published May 26, 2026 Article · related
The Unrealized Gains Trap: Property Taxes Are the Warning, Not the Excuse
A viral argument says if homeowners already pay property taxes on assessed value, then rich people should be taxed on unrealized stock gains too. But that logic misses the actual danger. Property tax is not a clean argument for expanding unrealized-gains taxation. It is the live demonstration of what happens when government turns paper value into a real recurring bill before cash exists. This Pattern Nexus research paper breaks down the difference between realization and assessment, the history of U.S. tax expansion, the income tax’s shift from narrow elite levy to mass withholding system, the AMT’s expansion problem, and why “it only starts with billionaires” is not a serious historical argument.
Published May 23, 2026