

Rate Cuts
Automatically indexed from the existing article tag.
Theses, forecasts, models, and paths
No published research objects yet
This topic is ready for editors to connect a thesis, forecast, model, or research path.
Latest articles
 Article · related
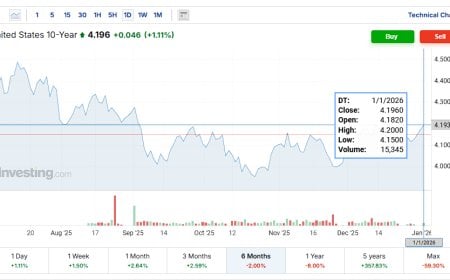
The 10-Year Decoupling: Why Long Rates No Longer Follow Cuts
The U.S. 10-year Treasury is no longer responding to policy rate cuts. This article explains the structural decoupling between front-end easing and long-end yields, why this regime persists for months to years, and what conditions eventually force balance sheet expansion.
Published Jan 2, 2026 Article · related
Happy New Year 2026: Rate Cuts, Yield Control, Asset Rotation, and the Next Phase of Managed Liquidity
Pattern Nexus 2026 outlook: 4–6 rate cuts (100–275 bps), slower second-half easing, rising probability of yield control, bond-market resistance beyond 3Y, real estate rotation, AI-driven labor compression, accelerating gray-zone instability, and why tokenized reserve rails arrive faster after a liquidity shock.
Published Dec 31, 2025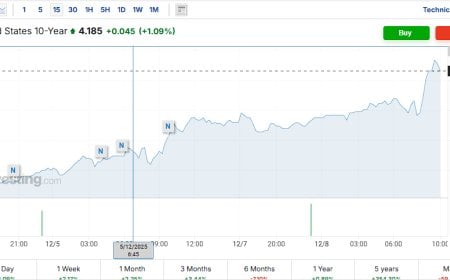 Article · related
GoGoGadget 10-Year: Why Yields Are Rising Into Rate Cuts
The U.S. 10-year just broke above the 4.15% zone even as futures price a near-certain Fed rate cut. This Pattern Nexus breakdown explains why long yields can rise into cuts, what the bond market is signaling about QT, term premium, and collateral stress, and how it fits the 2026 liquidity regime shift.
Published Dec 8, 2025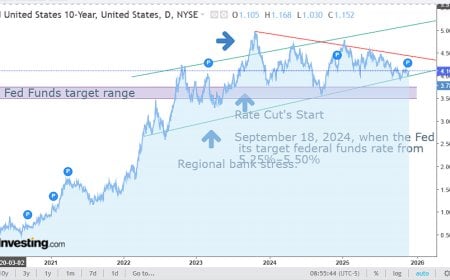 Article · related
The 10-Year Isn’t Misbehaving — It’s Warning the System Is Out of Liquidity
The U.S. 10-year yield is rising into rate cuts — not because the market is irrational, but because the financial system is operating on the liquidity floor. This article explains how regional bank failures, QT exhaustion, and the September 18, 2024 rate-cut pivot created the wedge pattern now signaling the next major regime shift.
Published Dec 2, 2025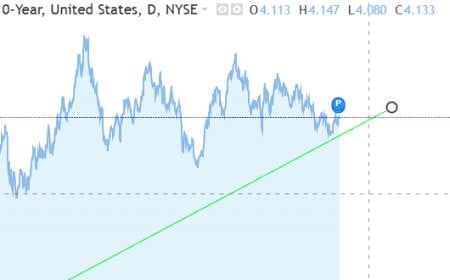 Article · related
The Gravity Zone: How the 10-Year Treasury Revealed the Real Neutral Rate
The 10-year Treasury has been oscillating around a hidden 3–4% neutral zone since 2022, revealing the true equilibrium rate the Fed keeps missing. This article breaks down why long rates refuse to fall, why the market no longer trusts traditional rate cuts, how the Treasury’s trillion-dollar TGA fits into the picture, and why quiet yield-curve management is becoming the new operating system of U.S. monetary policy.
Published Nov 18, 2025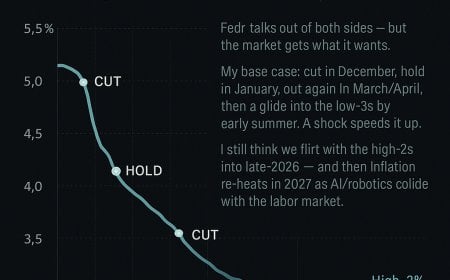 Article · related
Fed Cuts, Then Holds: Market-Implied Path to 3.00–3.25% by Mid-2026
The curve and FedWatch odds point to a December cut, a brief January pause, and more easing into spring—likely landing the target range near 3.00–3.25% by mid-2026. I outline accelerants, risks, and why 2027 could see inflation re-heat as AI/robotics scale.
Published Nov 7, 2025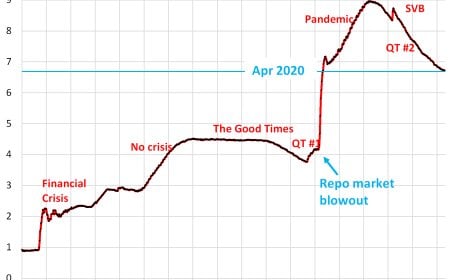 Article · related
The Pivot Is Here: Rate Cuts, QT Ending, and the Setup for QE 2026 — The Melt-Up Phase Has Begun
The Federal Reserve cut rates to 3.75%–4.00% and scheduled the end of QT for December 1, 2025. Liquidity is turning, market plumbing is tight, and the setup for renewed balance-sheet expansion in 2026 is forming. This is the melt-up window — where asset holders move first, and inflation follows. Understand the cycle now to position for the next wave.
Published Oct 30, 2025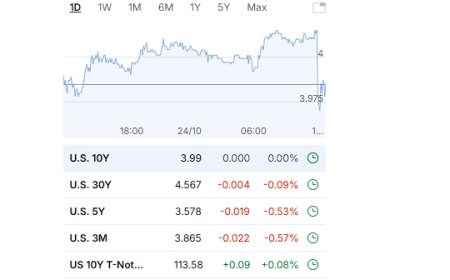 Article · related
Inflation at 3.0%: The Illusion of Stability and the Inevitable Liquidity Pivot
"3% CPI isn’t stability—it’s controlled volatility in a debt-saturated system, forcing the Fed toward rate cuts and stealth QE to keep credit flowing.
Published Oct 24, 2025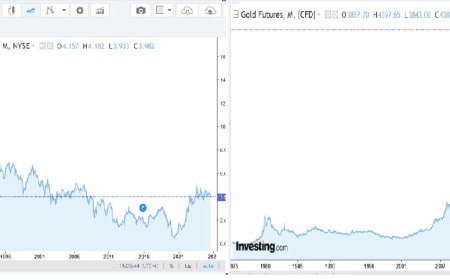 Article · related
Gold vs. the 10-Year Yield: Why Rate Cuts and Real Yields Point to the Next Inflation Wave
Gold is breaking new highs while the U.S. 10-year yield stalls near 4%. History shows gold moves first — and yields follow. Explore how falling real rates, policy shifts, and inflation expectations are aligning to signal the next major cycle in global markets.
Published Oct 20, 2025 Article · related
Fiscal Dominance and the Sticky Term Premium: Why Long Rates Won’t Obey the Fed
Everyone is waiting for rate cuts to bring relief to mortgages, cap rates, and risk assets. But the long end of the curve doesn’t care what the policy rate does when fiscal dominance takes hold. This long-form explainer maps the mechanics behind sticky long rates: net Treasury supply, buyer base rotation, term premium re-pricing, and degraded market depth. If you want to understand why “cuts” may not mean “cheaper money” anymore, start here.
Published Oct 18, 2025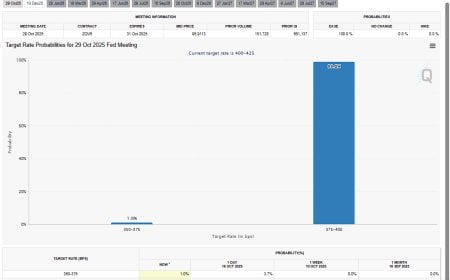 Article · related
Fed’s October Pivot: Liquidity Cycles, History, and the Digital Dollar Frontier
Markets now expect another 25 bps rate cut at the Fed’s Oct 28–29 meeting as unemployment rises and repo-market strains flicker. Powell signaled QT’s end is “coming into view,” Waller endorsed another cut, and Musalem said he could support one if inflation risks stay contained. This post connects those signals to the longer liquidity cycle and to where the next easing wave is headed: tokenized Treasuries, stablecoins, and programmable liquidity.
Published Oct 18, 2025