

rates
Automatically indexed from the existing article tag.
Theses, forecasts, models, and paths
No published research objects yet
This topic is ready for editors to connect a thesis, forecast, model, or research path.
Latest articles
 Article · related
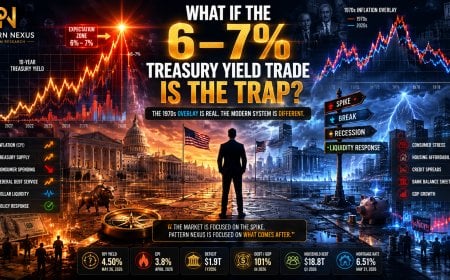
What If the 6–7% Treasury Yield Trade Is the Trap?
A lot of smart money is starting to position for a 1970s-style inflation repeat where the 10-year Treasury yield spikes toward 6% or 7%. The chart overlay looks convincing. Inflation today can be lined up against the 1970s if the data is shifted and framed the right way. But Pattern Nexus looks at the system constraint, not just the chart. The question is not whether yields can spike. They can. The question is whether the modern economy, the federal refinancing structure, the consumer balance sheet, and the dollar-based global liquidity system can actually survive a sustained 6–7% long-rate environment. This article argues that the more dangerous trade may be the obvious one: expecting the 1970s to repeat cleanly when the system may instead force a spike, break, recession, emergency response, and renewed liquidity cycle.
Published May 27, 2026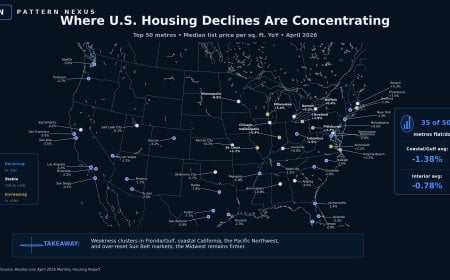 Article · related
The Coastal Housing Repricing Map: Where the U.S. Housing Plateau Is Starting to Crack
The U.S. housing market is not crashing everywhere. It is repricing where the affordability stack broke first: coastal price towers, insurance-stressed Florida and Gulf markets, high-rate West Coast metros, and over-reset Sun Belt cities where sellers are finally forced to meet buyers where they are. Realtor.com’s April 2026 top-50 metro data shows 35 of 50 major metros flat or down on median list price per square foot. Case-Shiller confirms the same slowdown through repeat-sales data. Pattern Nexus called this structure months ago: not a clean 2008-style collapse, but a fragmented housing plateau where geography, rates, insurance, taxes, liquidity, and cash-flow math decide which markets hold and which markets reprice.
Published May 26, 2026 Article · related
Interest Rates, Recession, and the Current Environment
A Pattern Nexus deep research analysis on interest rates, recession risk, energy-led inflation, commercial real estate stress, private credit, AI labor pressure, and why the current environment feels like 2006 without being a direct replay of 2008.
Published May 5, 2026 Article · related
Week Ahead (Mar 16–20, 2026): Central Bank Cluster, War-Risk Premium, and a Market Trading Constraints
Week Ahead (Mar 16–20, 2026): This is a constraint week. Oil risk premium is back, DXY is parked near 100, yields are still restrictive, and central banks have to react without pretending energy isn’t inflationary. Here’s the Pattern X map: what matters, what breaks what, and the if/then triggers for the next 5 sessions.
Published Mar 16, 2026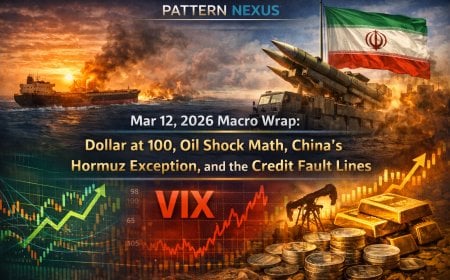 Article · related
Mar 12, 2026 Macro Wrap: Dollar at 100, Oil Shock Math, China’s Hormuz Exception, and the Credit Fault Lines
2026 is moving in whiplash mode. The dollar is pressing 100, yields are back in “you’re not supposed to be here” territory, oil is flirting with $100 again, and the Hormuz layer is no longer theoretical. China is negotiating for safe passage while credit quietly tightens. Here’s the systems-level breakdown.
Published Mar 12, 2026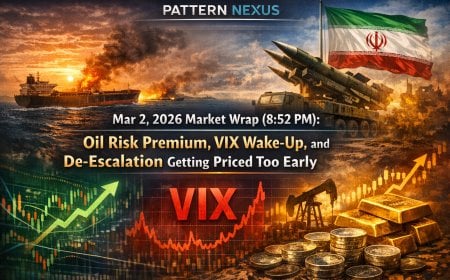 Article · related
Mar 2, 2026 Market Wrap (8:52 PM): Oil Risk Premium, VIX Wake-Up, and De-Escalation Getting Priced Too Early
Equities held together, but VIX jumped, oil stayed bid, and metals kept acting like uncertainty hedges. My read: the market is pricing fast de-escalation in Iran too early. Here’s the systems-level breakdown using the 8:52 PM snapshot.
Published Mar 2, 2026 Article · related
Israel Strikes Iran: Escalation Ladder
Israel says it launched a “pre-emptive” strike on Iran as explosions hit Tehran. Here’s the escalation ladder, the oil chokepoint risk, and the market plumbing
Published Feb 28, 2026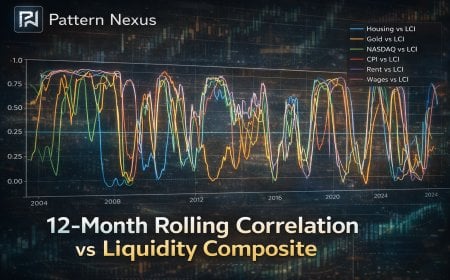 Article · related
The Plumbing Update (2003–2025) Q4 2025 + Jan 26
A full rebuild of the Pattern Nexus liquidity framework using end-of-month data, z-scores, and a PCA composite (WALCL, TGA, RRP, M2). If you want to understand housing, gold, and tech, stop arguing CPI and start watching the pipes.
Published Feb 27, 2026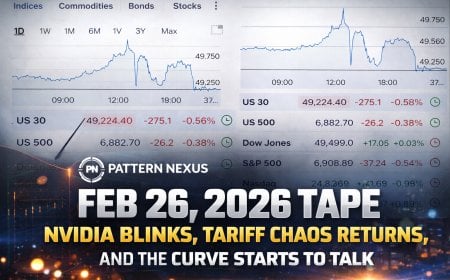 Article · related
Feb 26, 2026 Tape: Nvidia Blinks, Tariff Chaos Returns, and the Curve Quietly Flattens
Tech sold off even after Nvidia “beat,” VIX woke up, tariffs re-entered the equation, and the yield curve steepened. Here’s the systems-level read-through, plus the underbelly: private credit, multifamily stress, and BNPL drift.
Published Feb 26, 2026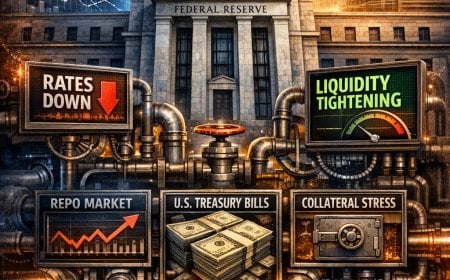 Article · related
Warsh’s Fed and the Balance-Sheet War: Why “Rates Down” Can Still Mean “Liquidity Tight”
A Pattern Nexus systems read on the incoming Fed regime debate: floor vs corridor, repo backstops, Treasury supply, and why the balance sheet is the real rate.
Published Feb 17, 2026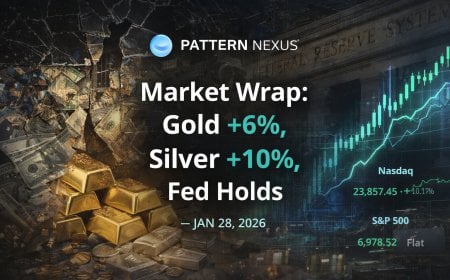 Article · related
Market Wrap: Gold +6%, Silver +10%, Fed Holds — Jan 28, 2026
Jan 28, 2026: The Fed held rates at 3.50–3.75% and the dollar firmed, yet gold ripped to ~5,423 (+5.90%) and silver to ~116.6 (+10.01%). Equities chopped around the 7,000 S&P level, yields rose, oil popped on storm-driven supply fears, and microcaps stayed in full volatility mode. Includes receipts + my delayed daily scalp recap (educational only).
Published Jan 28, 2026 Article · related
A 4.21% Day Is Not Normal — Gold Just Repriced the System
Gold printed a +4.21% session at record nominal prices. That is not a “trade.” It’s a credibility repricing across the claims stack: FX, rates, collateral, and settlement confidence.
Published Jan 28, 2026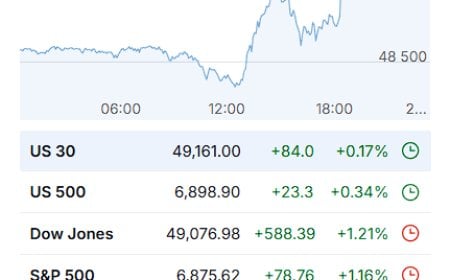 Article · related
Market Wrap – January 21, 2026: Tariffs Walked Back, Relief Rally, Vol Craters
Markets ripped higher after Trump signaled the Feb 1 Greenland-linked tariff threat would not be imposed. Dow +1.21%, S&P +1.16%, Nasdaq +1.18%, VIX -15.9%. Metals cooled, crypto bounced, and the week’s control-layer remains the same: trade policy + retaliation risk + geopolitics.
Published Jan 21, 2026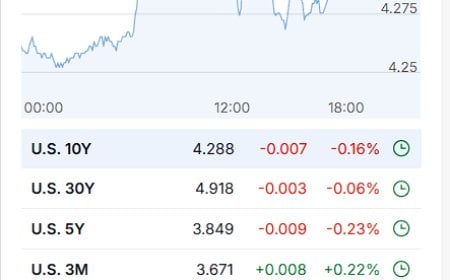 Article · related
Market Wrap – January 20, 2026: Bloodbath in Cash, Futures Try to Find a Floor
U.S. cash markets finally priced the Greenland tariff shock and wider geopolitical tension: Dow -1.8%, S&P -2.1%, Nasdaq -2.4%, crypto cracked, and vol jumped, even as futures tried to stabilize into the close.
Published Jan 20, 2026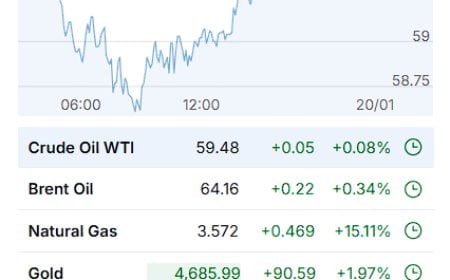 Article · related
Market Wrap – January 19, 2026: Greenland Tariff Shock, Metals Rip, U.S. Cash Closed
U.S. cash markets were closed for MLK Day, but the tape still moved: equity futures fell on Trump’s Greenland-linked tariff threat against eight European nations, Europe sold off, gold and silver hit record highs, and safe-haven FX bid showed up fast.
Published Jan 19, 2026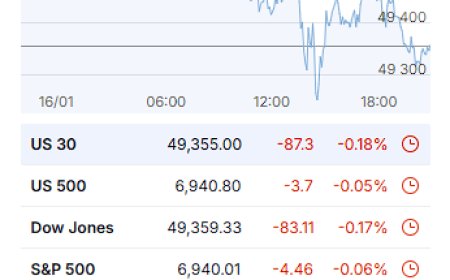 Article · related
Market Wrap – January 16, 2025: CPI Relief Cools, Yields Slide, Oil Loses the Security Premium
U.S. stocks dipped after Wednesday’s CPI-fueled surge as investors parsed earnings and fresh data. Treasury yields eased after Waller comments, gold climbed, oil settled lower as Red Sea risk premium faded, and the dollar softened versus the yen ahead of the inauguration.
Published Jan 16, 2026 Article · related
Housing Is the Target: The 2026 Mortgage-Rate Compression Play
Trump’s directive for Fannie and Freddie to buy $200B in mortgage bonds, alongside a still-easing rate backdrop, signals an explicit attempt to compress mortgage spreads and support housing. This framework maps the plumbing, the limits, and what would have to break for home prices to stop grinding higher.
Published Jan 8, 2026 Article · related
January 7, 2026 — Rates Lead, Metals Diverge, Geopolitics Pressures the Tape
Equities faded, volatility rose, yields fell, and commodities cracked on January 7, 2026. Gold slipped while silver broke harder. Geopolitical headlines centered on Ukraine, the Middle East, and Venezuela-linked energy flows.
Published Jan 7, 2026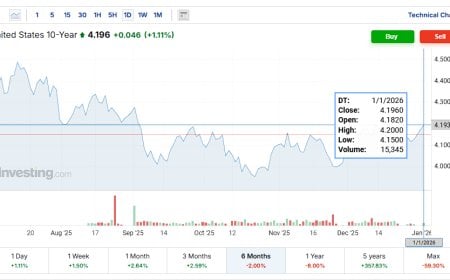 Article · related
The 10-Year Decoupling: Why Long Rates No Longer Follow Cuts
The U.S. 10-year Treasury is no longer responding to policy rate cuts. This article explains the structural decoupling between front-end easing and long-end yields, why this regime persists for months to years, and what conditions eventually force balance sheet expansion.
Published Jan 2, 2026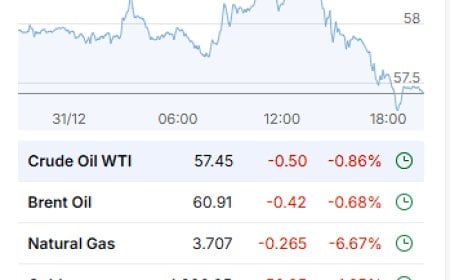 Article · related
Market Wrap-Up 12/31/2025: Silver Flush, Rates Pop, and the Year-End Reality Check
On the final session of 2025, equities drifted lower while commodities stayed violent: silver flushed hard, gold slid, yields popped, oil stayed soft, and crypto was mixed. Full Pattern Nexus wrap-up with screenshots, news of the day, and the year-end plumbing thesis.
Published Dec 31, 2025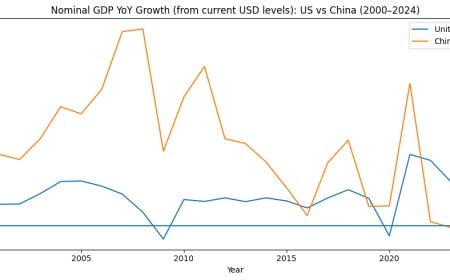 Article · related
Scale Is Destiny: Why China Didn’t Pass the U.S. — and Why That Matters
A data-driven breakdown of U.S. versus China economic growth from 2000–2024, showing why China failed to overtake the United States despite years of projections. Using GDP levels, growth rates, and scale mathematics, this report explains how demographics, housing collapse, trade regimes, and financial infrastructure reshaped the outcome — and why marginal U.S. growth now moves the global system.
Published Dec 24, 2025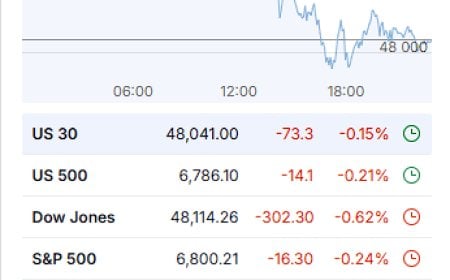 Article · related
Market Wrap – December 16, 2025: Delayed Jobs Print, Energy Weakness, AI Leadership Holds as the Curve Reprices Quietly
Markets finished mixed after a delayed jobs report and softening activity data. Energy weakened, gold firmed, AI leadership held, and the curve continued a quiet repricing under the short-end liquidity regime.
Published Dec 16, 2025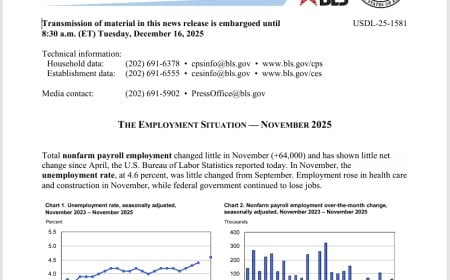 Article · related
Markets Catch Up to the Narrative: Jobs Noise, AI ROI Reality, and the Liquidity Repricing
A full cross-asset breakdown of December 16, 2025: the “noisy” delayed jobs report, a Fed that has already started cutting but won’t sprint, oil breaking below $60, and an AI complex forced to prove returns. This is not a headline day. It’s a regime day.
Published Dec 16, 2025 Article · related
Market Wrap December 12, 2025: AI Leadership Breaks as Long Yields Stay Bid
A rough session for risk assets as AI-linked leaders sold off, volatility jumped, and the long end refused to rally. With the dollar steady and gold higher, the tape reads like duration repricing and liquidity-fragility, not a simple “risk-off headline.”
Published Dec 12, 2025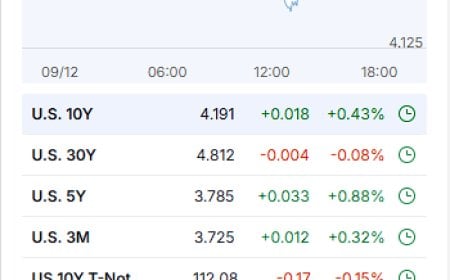 Article · related
Daily Market Wrap-Up – December 9, 2025
Markets pushed through a cautious session as the first full day of the Fed meeting began. Treasury yields climbed, equities wobbled, crypto rallied, and the structural stress in long-term rates continues to loom over risk assets.
Published Dec 9, 2025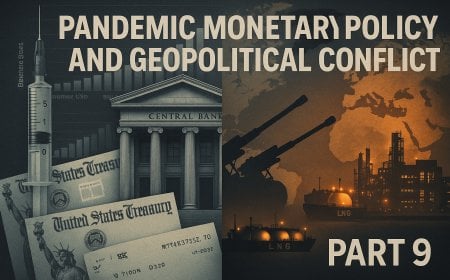 Article · related
The Fiscal-Monetary Fusion: Pandemic Money, Inflation Whiplash, and the Militarized Liquidity Regime (2020–2025)
COVID didn’t just trigger stimulus — it fused fiscal and monetary policy into a single war machine. Between 2020 and 2025, governments and central banks ran coordinated mega-deficits, bought their own debt at scale, ignited the first real inflation shock of the QE era, and then slammed rates higher into a fragile, over-financialized system — all while AI, energy constraints, and a new cold war turned liquidity into an explicit weapon.
Published Dec 8, 2025 Article · related
The Housing Collateral Engine: How Shadow Banking, China, and the Fed Turned Mortgages Into Global Money (2001–2008)
After the dot-com crash, the world didn’t deleverage — it rewired. Between 2001 and 2008, China’s WTO entry, Asian reserve accumulation, low Fed rates, and an explosive securitization boom turned U.S. housing into the core collateral engine of the global dollar system. When that engine failed, shadow banking imploded and central banks crossed the Rubicon into unlimited liquidity.
Published Dec 6, 2025 Article · related
NAR’s 2026 Housing Boom Fantasy: Why a 14% Rebound Requires a Liquidity Intervention
The National Association of Realtors is projecting a 14% rebound in existing-home sales for 2026 — but their forecast depends on a fragile monetary backdrop, a controlled collapse in mortgage rates, and a hidden liquidity intervention. This Pattern Nexus deep dive breaks down the real mechanics behind the “housing comeback” narrative.
Published Dec 1, 2025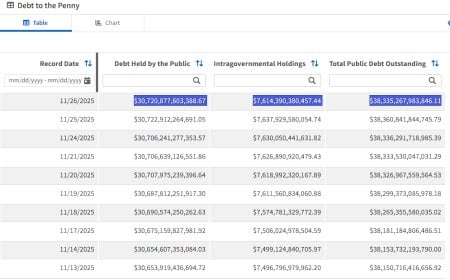 Article · related
The Overburdened Debt Economy: How a $1 Trillion Surge Tightens the Noose on Households, Businesses, and Growth
The U.S. added $1T in new debt in just 82 days. Here’s how rising federal, household, business, and state debts are overloading the economy and pushing rates higher.
Published Nov 29, 2025 Article · relatedWeek Ahead: Markets, Data & Macro Risks (Nov 24–30, 2025)
A forward-looking Pattern Nexus walkthrough of the week of November 24–30, 2025, covering key economic data, market markers, and structural risks around AI, rates, and global macro.
Published Nov 23, 2025