

term premium
Automatically indexed from the existing article tag.
Theses, forecasts, models, and paths
No published research objects yet
This topic is ready for editors to connect a thesis, forecast, model, or research path.
Latest articles
 Article · related
QE 2026, Phase Two: When the Long End Forces Duration Control
The Fed already ended QT and expanded Treasury holdings through bill-focused reserve-management purchases, but that repaired the reserve layer without suppressing the long end. With the 10-year Treasury at 4.95%, the 30-year at 5.37%, real long yields near the Pattern Nexus red zone, Treasury doubling long-end buybacks, and August CPI limiting conventional easing, this report calculates the probability that QE 2026 moves into a second phase. It maps the likely program, the names it may use, the dates when it could expand, and the exact yield, reserve, auction, repo, leverage, and credit conditions that could force direct duration absorption.
Published Sep 11, 2026 Article · related
Two Economies, One Balance Sheet: The Unstable Barbell of 2026
Reserve support has returned, but real long rates, fiscal supply, and an AI-energy capital wave are splitting the U.S. economy between capital strength and household fragility. This data-rich Pattern Nexus report maps the four feedback loops connecting Federal Reserve plumbing, Treasury duration, fiscal interest, housing lock-in, household credit, labor churn, AI infrastructure, power demand, dollar rails, and gold. It closes with four scenarios, a public-call audit, and a 90-day trigger dashboard.
Published Sep 9, 2026 Article · related
The Deficit Never Ends: How Annual Shortfalls Build a $78.8 Trillion Federal Debt Load
Most people use “deficit” and “debt” as if they mean the same thing. They do not. This report uses two Pattern Nexus infographics and official CBO and Treasury data to map the annual federal deficit and total federal debt from 2020 through 2040, explain why interest creates a self-reinforcing feedback loop, and show why the 10-year and 30-year Treasury yields—not a political debt-clock slogan—are the market constraint that matters.
Published Aug 22, 2026 Article · related
Treasury Turns Long-Bond Buybacks Into a Yield-Control Test
Treasury said it will raise maximum liquidity-support buybacks in the 10-to-20-year and 20-to-30-year nominal coupon sectors from $2 billion to at least $4 billion per operation beginning September 9, 2026. Follow-up reporting from AP, Reuters and Axios shows the market treated the move as an attempted long-end yield intervention, but the initial relief faded quickly. The Pattern Nexus read: this is not formal yield-curve control, but it is a live test of whether Treasury plumbing can absorb stress that monetary policy credibility and fiscal math are failing to contain.
Published Aug 22, 2026 Article · related
The Price of a Fractured World: Why the 30-Year Treasury Is Sending a Geopolitical Signal
Something about the global system feels uncomfortable, and the last month of data suggests that feeling has a measurable foundation. The U.S. 30-year Treasury has pushed above 5.3%, real long-term yields are above 3%, the Strait of Hormuz remains severely constrained, U.S. missile inventories are being consumed across multiple theaters, Russia and Ukraine are attacking the commercial infrastructure of the Black Sea, China continues pressure around Taiwan and the South China Sea, new regional defense blocs are forming, tariffs are fragmenting trade, and governments and AI companies are simultaneously competing for enormous amounts of capital. This Pattern Nexus investigation asks whether the long end of the Treasury market is becoming one of the cleanest aggregate prices of a more fragmented world—and separates that thesis from the much weaker claim that the Treasury market itself is failing.
Published Aug 18, 2026 Article · related
The Fed’s Long-End Trap: Why a 4.65% 10-Year Is Already Doing the Tightening
A full July 2026 data reconstruction of the Federal Reserve’s next policy path, showing how a 4.65% nominal 10-year, 2.44% real 10-year, Treasury supply, oil risk and uneven liquidity conditions create a hawkish-hold trap.
Published Jul 27, 2026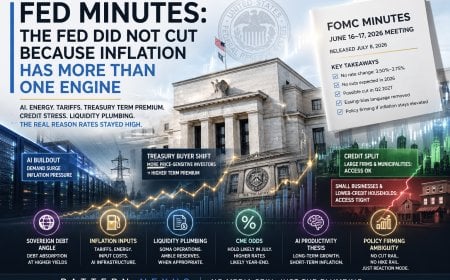 Article · related
Fed Minutes: The Cut Trade Broke Because Inflation Has More Than One Engine
The June 16–17 FOMC minutes, released July 8, show a Fed that held rates steady but removed the easy easing bias. The deeper signal is that inflation pressure is now coming from multiple rails at once: tariffs, Middle East energy shock risk, AI infrastructure demand, Treasury term premium, and uneven consumer credit stress.
Published Jul 8, 2026 Article · related
Gold Was Right. The 10-Year Was Early. The War Premium Changed the Rate Path.
The original Pattern Nexus gold call hit the structural move: gold was not just trading inflation, it was repricing liquidity, policy failure, and the collateral stack. The miss was the 10-year yield. It did not break into the high-2% range because two wars changed the inflation, oil, shipping, deficit, and term-premium path after the gold call was already made.
Published Jun 14, 2026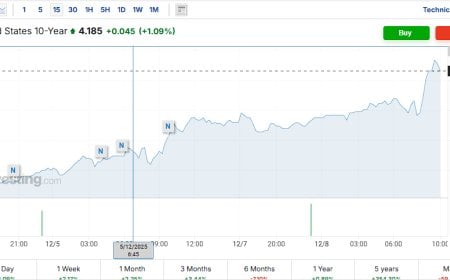 Article · related
GoGoGadget 10-Year: Why Yields Are Rising Into Rate Cuts
The U.S. 10-year just broke above the 4.15% zone even as futures price a near-certain Fed rate cut. This Pattern Nexus breakdown explains why long yields can rise into cuts, what the bond market is signaling about QT, term premium, and collateral stress, and how it fits the 2026 liquidity regime shift.
Published Dec 8, 2025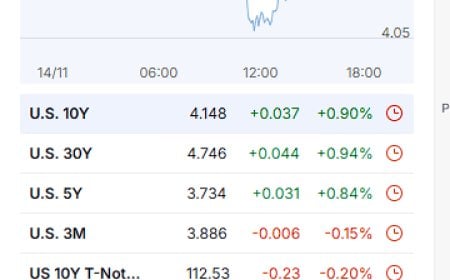 Article · related
The Weekly Market Wrap: The Week the 10-Year Stopped Listening
A volatile week across equities, bonds, commodities, and crypto. Stocks chopped, gold spiked then crashed, Bitcoin cooled off, and the U.S. 10-year Treasury defied the Fed yet again. A deep Pattern Nexus breakdown of what markets are really pricing: liquidity, deficits, AI capex, and the rising cost of capital.
Published Nov 15, 2025 Article · related
Fiscal Dominance and the Sticky Term Premium: Why Long Rates Won’t Obey the Fed
Everyone is waiting for rate cuts to bring relief to mortgages, cap rates, and risk assets. But the long end of the curve doesn’t care what the policy rate does when fiscal dominance takes hold. This long-form explainer maps the mechanics behind sticky long rates: net Treasury supply, buyer base rotation, term premium re-pricing, and degraded market depth. If you want to understand why “cuts” may not mean “cheaper money” anymore, start here.
Published Oct 18, 2025