

Treasury yields
Automatically indexed from the existing article tag.
Theses, forecasts, models, and paths
No published research objects yet
This topic is ready for editors to connect a thesis, forecast, model, or research path.
Latest articles
 Article · related
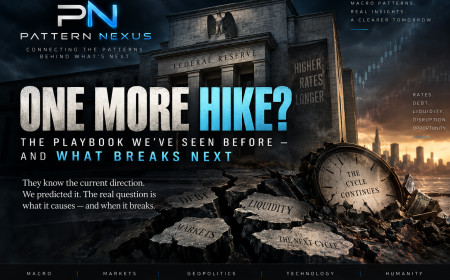
Fed Just Hiked Into a 5% 10-Year: Why the Next Liquidity Cycle May Arrive Faster
The Federal Reserve just raised the federal-funds target to 3.75%–4.00% while the 10-year Treasury closed at 5.01%, the 30-year at 5.35%, and the real 30-year at 3.09%. Pattern Nexus correctly identified the September hike risk and the developing QE/liquidity cycle, but underestimated the Fed’s willingness to raise rates against an already enormous debt and refinancing burden. This report asks the question almost nobody asks after a rate decision: what does the hike eventually break? It connects the September decision to the $40-trillion-plus federal debt structure, more than $1 trillion of annual federal net interest expense, Treasury issuance, long-end buybacks, Federal Reserve reserve-management purchases, hedge-fund leverage, the Treasury basis trade, private credit, housing, commercial real estate, household cashflow and the 2019 repo-market precedent. The conclusion is not that the Fed has deliberately chosen to create a crash. It is that monetary architecture now allows the Fed to tighten the price of credit while separately protecting reserves and market plumbing. The hike therefore does not invalidate the Pattern Nexus QE thesis. If long rates remain near current levels, it accelerates the transmission mechanism that can eventually force the next phase of liquidity support.
Published Sep 17, 2026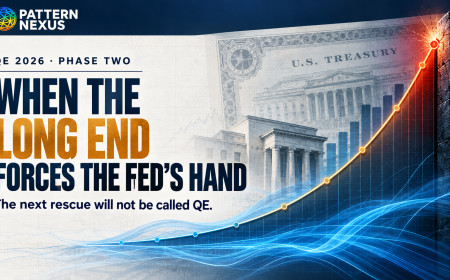 Article · related
QE 2026, Phase Two: When the Long End Forces Duration Control
The Fed already ended QT and expanded Treasury holdings through bill-focused reserve-management purchases, but that repaired the reserve layer without suppressing the long end. With the 10-year Treasury at 4.95%, the 30-year at 5.37%, real long yields near the Pattern Nexus red zone, Treasury doubling long-end buybacks, and August CPI limiting conventional easing, this report calculates the probability that QE 2026 moves into a second phase. It maps the likely program, the names it may use, the dates when it could expand, and the exact yield, reserve, auction, repo, leverage, and credit conditions that could force direct duration absorption.
Published Sep 11, 2026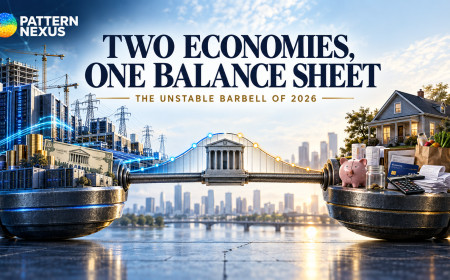 Article · related
Two Economies, One Balance Sheet: The Unstable Barbell of 2026
Reserve support has returned, but real long rates, fiscal supply, and an AI-energy capital wave are splitting the U.S. economy between capital strength and household fragility. This data-rich Pattern Nexus report maps the four feedback loops connecting Federal Reserve plumbing, Treasury duration, fiscal interest, housing lock-in, household credit, labor churn, AI infrastructure, power demand, dollar rails, and gold. It closes with four scenarios, a public-call audit, and a 90-day trigger dashboard.
Published Sep 9, 2026 Article · related
Warsh Turns Jackson Hole Into a Rate-Hike Liquidity Shock
Kevin Warsh’s Jackson Hole speech gave markets a hawkish Fed signal, with AP reporting a jump in the two-year Treasury yield after the remarks. Warsh tied the policy debate to persistent inflation, strong AI-related investment, and a less guidance-heavy central bank communication regime. Pattern Nexus reads the speech as a liquidity-regime shift: inflation credibility now sits above market comfort.
Published Aug 28, 2026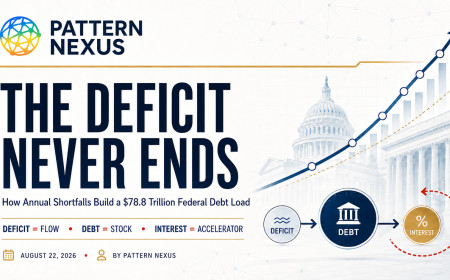 Article · related
The Deficit Never Ends: How Annual Shortfalls Build a $78.8 Trillion Federal Debt Load
Most people use “deficit” and “debt” as if they mean the same thing. They do not. This report uses two Pattern Nexus infographics and official CBO and Treasury data to map the annual federal deficit and total federal debt from 2020 through 2040, explain why interest creates a self-reinforcing feedback loop, and show why the 10-year and 30-year Treasury yields—not a political debt-clock slogan—are the market constraint that matters.
Published Aug 22, 2026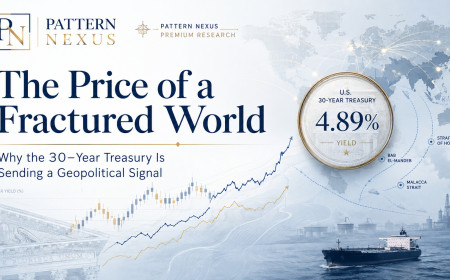 Article · related
The Price of a Fractured World: Why the 30-Year Treasury Is Sending a Geopolitical Signal
Something about the global system feels uncomfortable, and the last month of data suggests that feeling has a measurable foundation. The U.S. 30-year Treasury has pushed above 5.3%, real long-term yields are above 3%, the Strait of Hormuz remains severely constrained, U.S. missile inventories are being consumed across multiple theaters, Russia and Ukraine are attacking the commercial infrastructure of the Black Sea, China continues pressure around Taiwan and the South China Sea, new regional defense blocs are forming, tariffs are fragmenting trade, and governments and AI companies are simultaneously competing for enormous amounts of capital. This Pattern Nexus investigation asks whether the long end of the Treasury market is becoming one of the cleanest aggregate prices of a more fragmented world—and separates that thesis from the much weaker claim that the Treasury market itself is failing.
Published Aug 18, 2026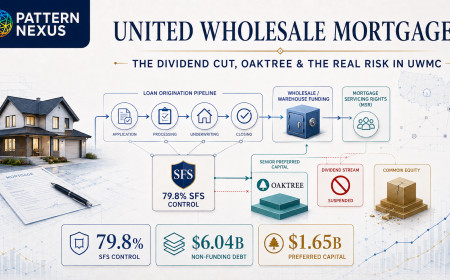 Article · related
United Wholesale Mortgage: The Dividend Cut, the Ishbia Structure, Oaktree, and the Real Risk in UWMC
I rebuilt the UWM panic from the ownership structure outward: who actually received the distributions, what the dividend suspension retains, why the $451.9 million quarterly loss does not describe the core origination business, what the $603.2 million failed-deal hedge did to equity, how the Oaktree preferred recapitalization changes the common stock, and what would actually have to happen for a bankruptcy thesis to become real.
Published Aug 8, 2026 Article · related
The Oil Inventory War Machine: How Long the Global Buffer Can Hold
A full Pattern Nexus reconstruction of U.S. and global oil inventories from the 1970s through the 2026 war shock, including original regressions, depletion scenarios, strategic reserves, refinery constraints, inflation, growth, rates and the path forward. Meta keywords: oil inventory, global oil stocks, U.S. crude inventories, Strategic Petroleum Reserve, SPR, Strait of Hormuz, Iran war, oil shock, petroleum products, diesel inventories, refinery capacity, inflation, CPI, recession, Treasury yields, liquidity, war economy, energy security, Pattern Nexus
Published Aug 2, 2026 Article · related
Pattern Nexus Macro Archive: 328 Timestamped Articles, October 2025–July 2026
A guided public index of 328 timestamped Pattern Nexus articles covering Federal Reserve liquidity, interest rates, the dollar, gold and silver, housing, real estate, markets, debt, banking, energy, trade, industrial buildout, and geopolitical transmission. Each section explains what readers will find, what they will learn, and where to begin.
Published Jul 30, 2026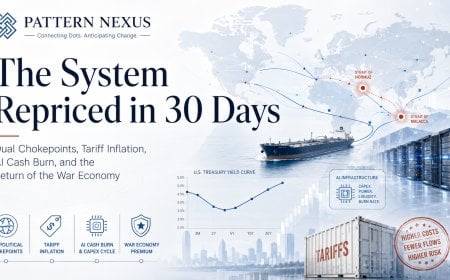 Article · related
The System Repriced in 30 Days: Dual Chokepoints, Tariff Inflation, AI Cash Burn, and the Return of the War Economy
In thirty days, the operating assumptions underneath the global system changed. Two maritime chokepoints came under pressure, the United States expanded war financing and rebuilt its tariff architecture, inflation moved back upstream, long-term yields repriced, AI infrastructure crossed into cash-burn territory, strategic minerals became permissioned leverage, and political command structures began cracking. This Pattern Nexus analysis maps those events as one connected system rather than separate headlines.
Published Jul 24, 2026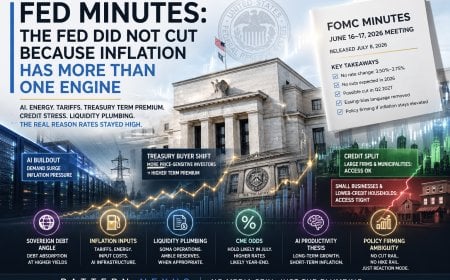 Article · related
Fed Minutes: The Cut Trade Broke Because Inflation Has More Than One Engine
The June 16–17 FOMC minutes, released July 8, show a Fed that held rates steady but removed the easy easing bias. The deeper signal is that inflation pressure is now coming from multiple rails at once: tariffs, Middle East energy shock risk, AI infrastructure demand, Treasury term premium, and uneven consumer credit stress.
Published Jul 8, 2026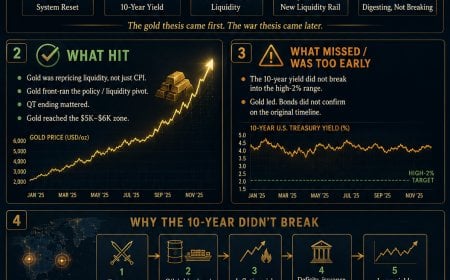 Article · related
Gold Was Right. The 10-Year Was Early. The War Premium Changed the Rate Path.
The original Pattern Nexus gold call hit the structural move: gold was not just trading inflation, it was repricing liquidity, policy failure, and the collateral stack. The miss was the 10-year yield. It did not break into the high-2% range because two wars changed the inflation, oil, shipping, deficit, and term-premium path after the gold call was already made.
Published Jun 14, 2026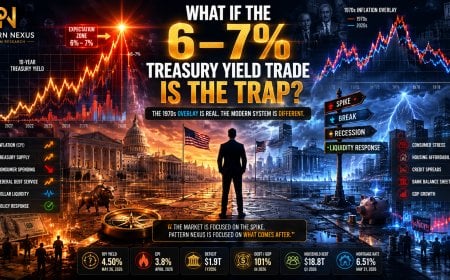 Article · related
What If the 6–7% Treasury Yield Trade Is the Trap?
A lot of smart money is starting to position for a 1970s-style inflation repeat where the 10-year Treasury yield spikes toward 6% or 7%. The chart overlay looks convincing. Inflation today can be lined up against the 1970s if the data is shifted and framed the right way. But Pattern Nexus looks at the system constraint, not just the chart. The question is not whether yields can spike. They can. The question is whether the modern economy, the federal refinancing structure, the consumer balance sheet, and the dollar-based global liquidity system can actually survive a sustained 6–7% long-rate environment. This article argues that the more dangerous trade may be the obvious one: expecting the 1970s to repeat cleanly when the system may instead force a spike, break, recession, emergency response, and renewed liquidity cycle.
Published May 27, 2026 Article · related
Interest Rates, Recession, and the Current Environment
A Pattern Nexus deep research analysis on interest rates, recession risk, energy-led inflation, commercial real estate stress, private credit, AI labor pressure, and why the current environment feels like 2006 without being a direct replay of 2008.
Published May 5, 2026 Article · related
Market Wrap – January 16, 2025: CPI Relief Cools, Yields Slide, Oil Loses the Security Premium
U.S. stocks dipped after Wednesday’s CPI-fueled surge as investors parsed earnings and fresh data. Treasury yields eased after Waller comments, gold climbed, oil settled lower as Red Sea risk premium faded, and the dollar softened versus the yen ahead of the inauguration.
Published Jan 16, 2026 Article · related
Market Wrap – December 18, 2025: Equities Higher, Bonds Bid, Metals Volatile, Crypto Lags
U.S. markets closed higher on December 18, 2025, led by tech and AI names, while bonds were bid, gold and silver saw sharp intraday swings, and crypto diverged lower. A cross-asset digestion day.
Published Dec 18, 2025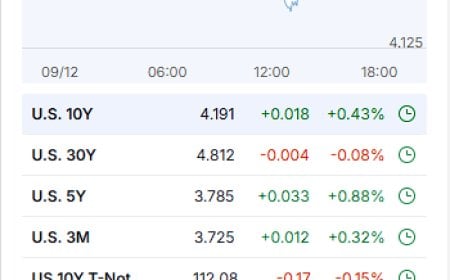 Article · related
Daily Market Wrap-Up – December 9, 2025
Markets pushed through a cautious session as the first full day of the Fed meeting began. Treasury yields climbed, equities wobbled, crypto rallied, and the structural stress in long-term rates continues to loom over risk assets.
Published Dec 9, 2025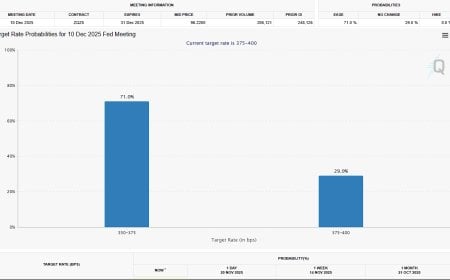 Article · related
Pattern Nexus Weekly Wrap-Up: Markets Reprice the December Fed Pivot as Global Tensions Escalate (Week of Nov 15–21, 2025)
Markets aggressively repriced a December Fed rate cut as U.S. equities surged, bond yields fell, and global tensions escalated across Ukraine, Asia, and the Caribbean. Inside the Pattern Nexus Weekly Wrap-Up for November 15–21, 2025.
Published Nov 21, 2025 Article · related
Can the 10-Year Treasury Predict Recessions? A 40-Year Pattern Nexus Lens Analysis
A 40-year structural analysis of the US 10-Year Treasury futures market, showing how recessions consistently collide with long-term yield channels, why yield curve inversions continue to matter, and what today’s setup means for the next macro cycle. A full Pattern Nexus Lens breakdown.
Published Nov 20, 2025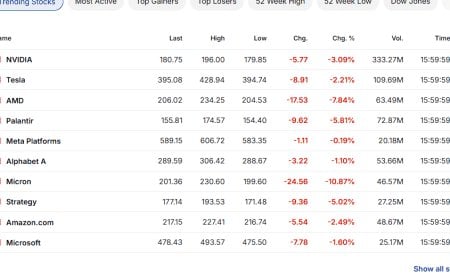 Article · related
Risk-Off With No Headline: 11/20/2025 Market Wrap
A strange day in markets: everything sold off while the dollar barely moved. Here's what actually happened through the Pattern Nexus lens.
Published Nov 20, 2025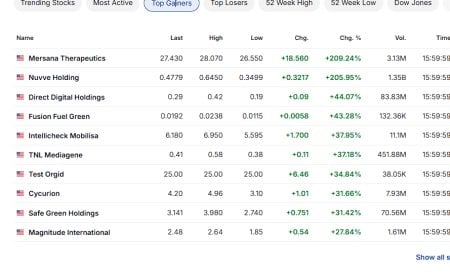 Article · related
Market Wrap-Up — November 13, 2025: Red Tape, Strong Dollar, and a Fed That Markets Still Expect to Blink
U.S. markets had their worst day in a month as the Dow fell nearly 800 points, AI stocks sold off, and Fed cut odds briefly slipped to a coin toss. By evening, futures had already drifted back toward a December cut and the dollar stayed firm. A Pattern Nexus breakdown of sentiment whiplash, yields, commodities, and the liquidity architecture beneath the day’s volatility.
Published Nov 13, 2025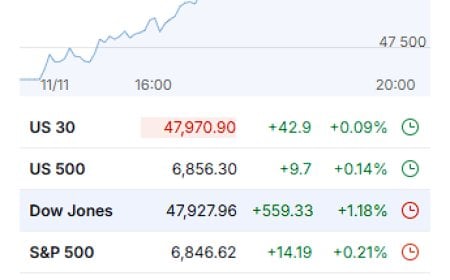 Article · related
Dow Hits Record as Long-End Anchors — Nov 11, 2025 Market Wrap
Dow Jones, S&P 500, Nasdaq, bonds, yield curve, dollar index, volatility, Treasury yields, liquidity cycle, market wrap, Pattern Nexus, November 2025, macro markets
Published Nov 11, 2025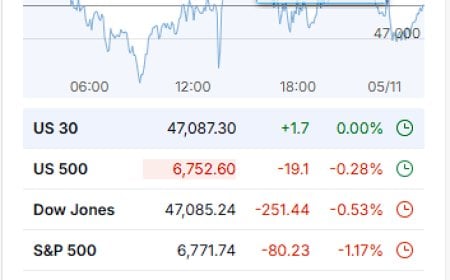 Article · related
Markets Drop as Bank CEOs Warn of Pullback, Gold Slips, and Shutdown Risks Grow — Nov 4, 2025
U.S. stocks sold off on Nov 4 2025 as top Wall Street CEOs warned of a market pullback, bonds rallied, gold struggled, and investors braced for a U.S. government shutdown that may cut food aid in December. Japan's rally drew fresh 1980s bubble comparisons; tech leadership narrowed as volatility ticked up.
Published Nov 4, 2025