

Are Auto Sales Predicting a Recession? A 50-Year Regression and the 2026 Signal
Vehicle sales normally weaken before recession becomes obvious elsewhere. Pattern Nexus reconstructs every U.S. recession since 1976, builds auto-only and cross-channel recession models, audits prices, financing, delinquency and buyer concentration, and explains why strong mid-2026 sales reject an immediate recession call without proving broad household strength.

Auto sales are not confirming an immediate recession
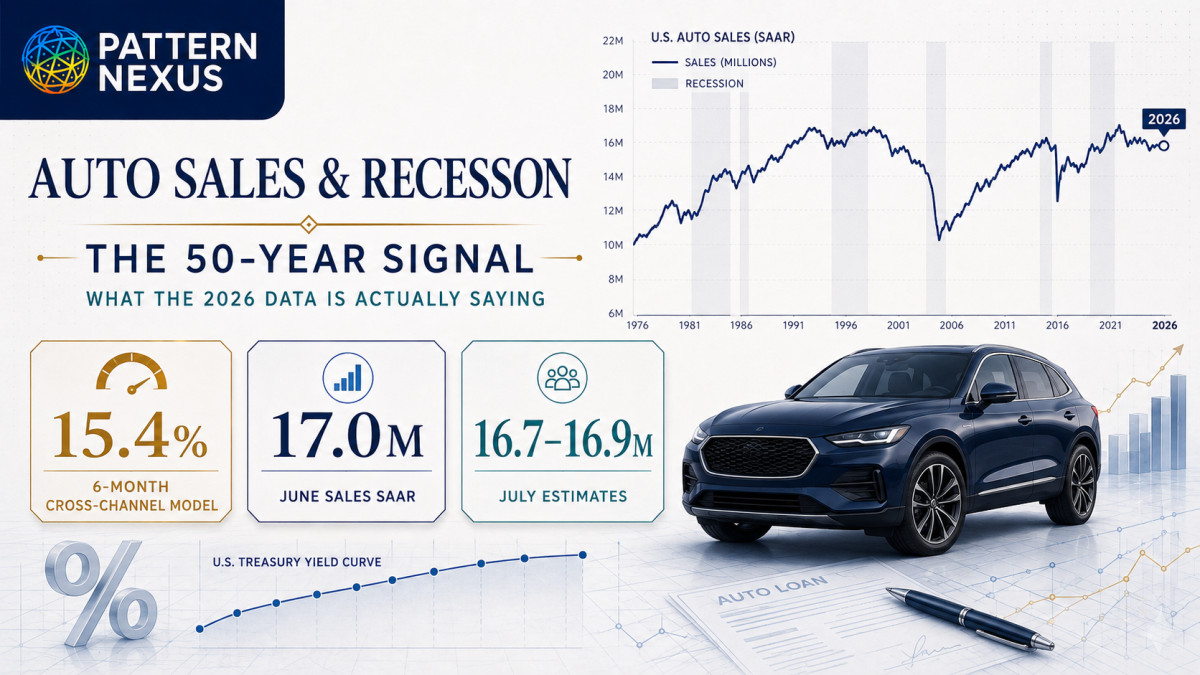
- Official total vehicle sales reached a 17.0-million seasonally adjusted annual rate in June 2026. That was 4.6% above June 2025. The three-month and six-month momentum measures were positive, not contracting.[1]
- Private July estimates remained strong. Cox Automotive projected a 16.7-million SAAR; J.D. Power–GlobalData projected 16.9 million. Both described July as the strongest sales pace of 2026.[2][3]
- Historically, the signal looks different before recession. Across the six NBER recessions beginning after the vehicle-sales series starts in 1976, sales averaged 6.7% below their level twelve months earlier by the month before recession and 10.4% below it in the opening month.
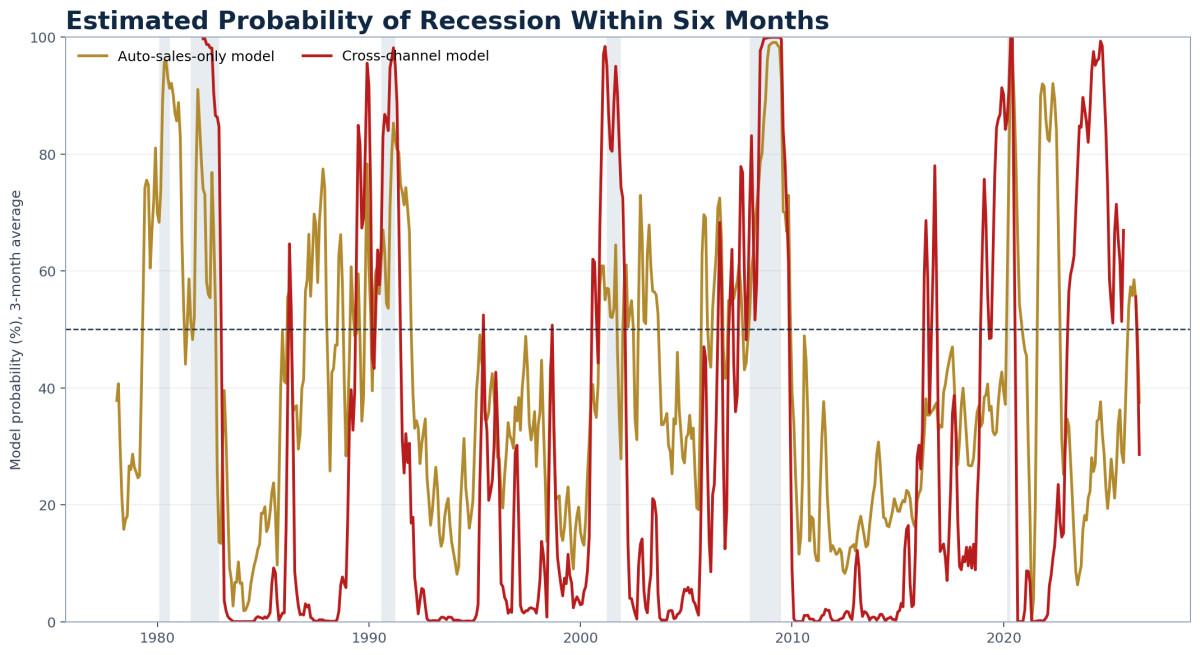
- The auto-only model assigns a 26.8% probability of recession within six months. Adding the Treasury curve, unemployment momentum and industrial production lowers the current estimate to 15.4%. These are model outputs, not official forecasts.
- The headline is stronger than the household distribution beneath it. Cox says affluent buyers and strong equity markets are sustaining demand. That means national unit sales can remain firm even while lower-income borrowers retreat from the new-vehicle market.[2]
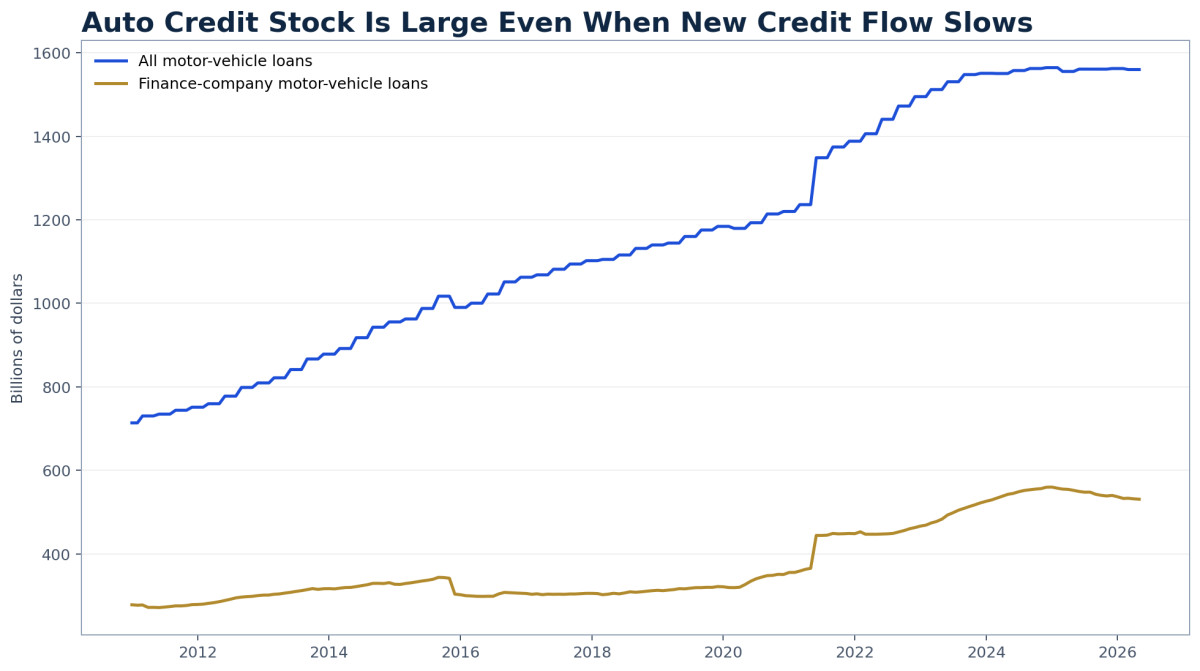
- Auto debt reached $1.685 trillion in Q1. The annualized flow into serious auto delinquency was 2.97%, almost unchanged from 2.94% a year earlier. Stress is elevated, but it did not accelerate into a new national break during Q1.[4]
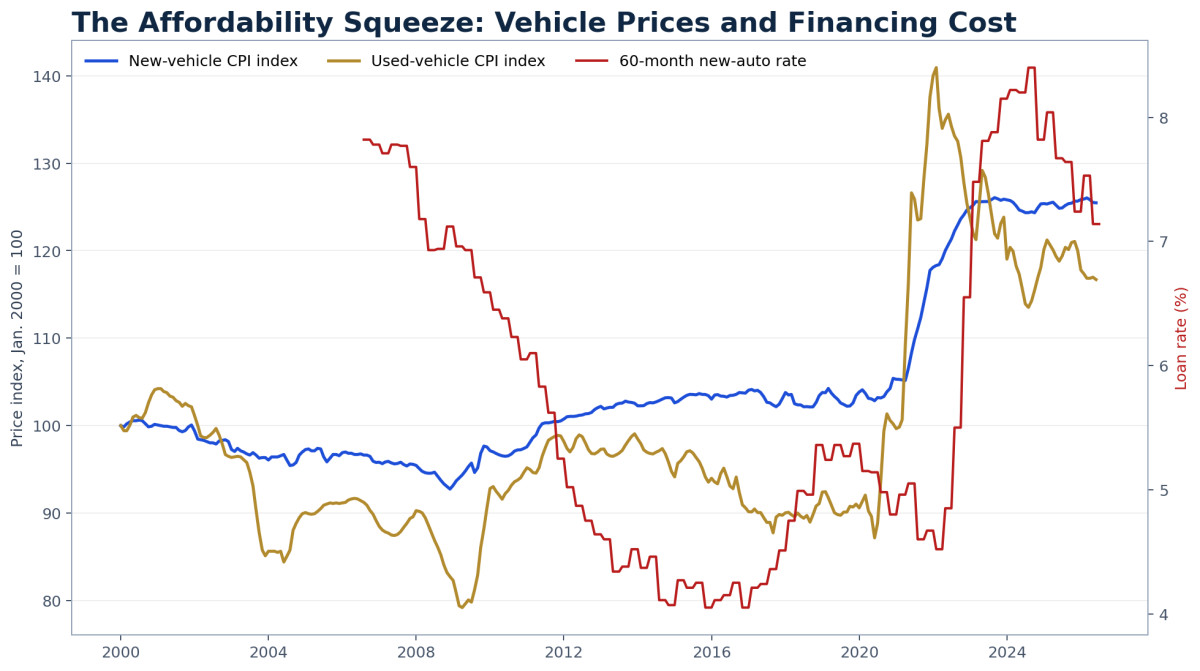
- The financing system remains restrictive. The commercial-bank rate on a 60-month new-auto loan was 7.14% in May. A high vehicle price financed above 7% creates a payment shock even when the sticker-price inflation rate cools.[5]
- Banks were not closing the channel in July. The net share tightening auto-loan standards was −4.5%, meaning modest net easing. A recession signal would be more convincing if sales fell while standards tightened and delinquencies accelerated.[6]
- The current signal is resilience with concentration—not broad comfort. Auto sales are saying the economy has not crossed into generalized demand destruction. Credit, real income and buyer composition say the expansion remains divided.
- Pattern Nexus base case: no recession confirmation through the end of 2026, but a material 2027 slowdown risk if the long end stays high and auto demand loses its affluent, fleet and incentive support.
This report reconstructs monthly total vehicle sales from January 1976 through June 2026, aligns them with NBER recession months, measures year-over-year momentum, three- and six-month annualized momentum, the drawdown from the trailing two-year high and population-adjusted demand, and then tests whether those variables identify a recession beginning within three, six or twelve months.
It also separates the sales signal from the financing and distribution system. Vehicle prices, auto-loan rates, bank standards, loan balances, serious delinquency, finance-company exposure, industrial production, unemployment and the Treasury curve are treated as different channels. Six original charts, an event study, two logistic models, a pseudo-out-of-sample exercise, scenario probabilities and explicit falsification conditions are included.
The auto market is passing the recession test—but only at the aggregate layer
A vehicle is one of the largest discretionary purchases most households make. The decision combines employment confidence, income, credit access, the expected durability of future earnings, interest rates, trade-in equity and the ability to absorb insurance, fuel and repair costs. That makes auto sales unusually sensitive to a change in household expectations.
But a national sales total is not a democratic vote. One affluent household buying a $70,000 vehicle counts as one unit. One fleet operator buying one hundred vehicles counts as one hundred. A lower-income household priced out of the new market counts as nothing. The aggregate can therefore remain firm while access becomes narrower.
The June and July readings do not resemble the normal opening of recession. Sales were near 17 million, year-over-year momentum was positive, and banks reported net easing of standards. The data reject the claim that auto demand has already collapsed.
The underlying structure is still vulnerable. New vehicles remain expensive, 60-month financing is above 7%, real disposable personal income fell in the Q2 GDP report, and used-vehicle depreciation can erase trade-in equity. If employment weakens, the payment structure can convert quickly from resilience into forced delay, delinquency and repossession.
A vehicle purchase compresses the household outlook into one decision
Most consumer transactions describe the present. A vehicle purchase describes the buyer's expected future. The household accepts several years of payments, insurance, registration, maintenance and depreciation because it believes employment and income will remain sufficient.
Employment confidence
A household delays a vehicle when it doubts the durability of future earnings, often before unemployment becomes severe.
Credit availability
Lenders change scores, down payments, terms and approvals as expected losses rise.
Collateral
The trade-in value determines whether the existing loan supplies equity or carries negative equity into the next purchase.
Durable-goods cycle
Autos connect household demand to steel, electronics, semiconductors, transport, dealers, advertising and manufacturing payrolls.
The causal direction runs both ways. A weaker economy reduces sales. Falling sales then reduce production, dealer orders, supplier revenue, transportation demand and employment. Auto sales are both symptom and transmission channel.
Every recession reduced vehicle sales, but not every sales decline became a recession
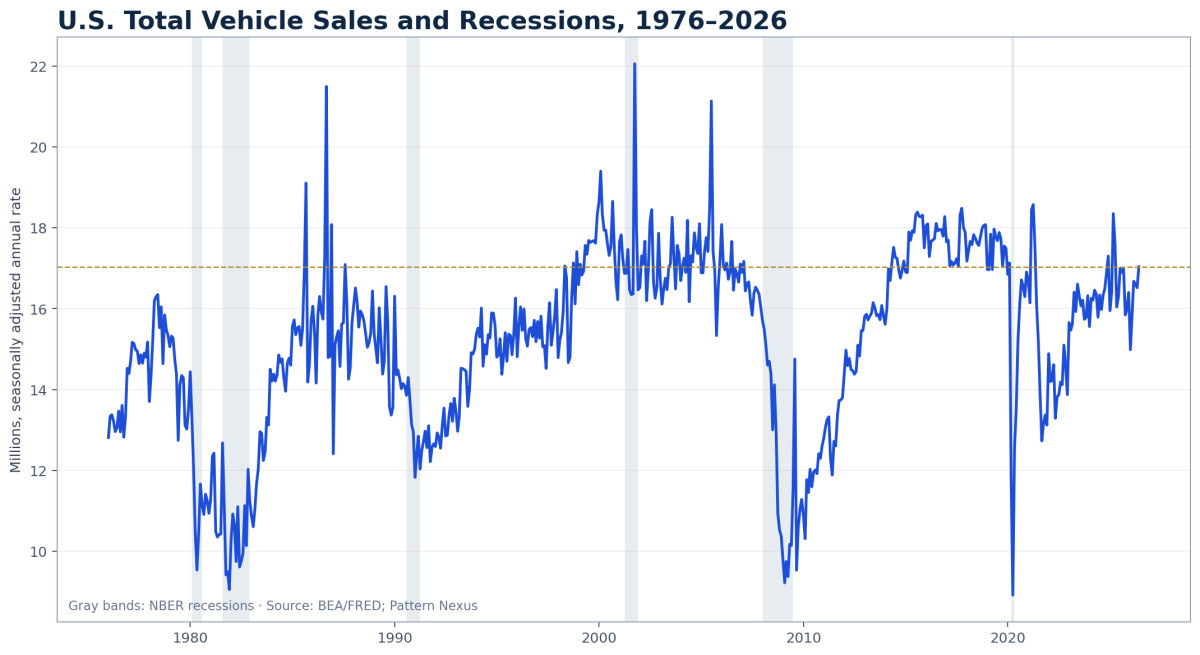
The BEA total-sales series begins in 1976 and covers six recession starts: February 1980, August 1981, August 1990, April 2001, January 2008 and March 2020. The series includes autos and light trucks at a seasonally adjusted annual rate.
The 1980 and 1981–82 downturns were dominated by inflation, energy and Volcker-era rates. The 1990 recession combined oil shock, credit tightening and prior overbuilding. The 2001 recession was less consumer-centered; auto incentives delayed part of the adjustment. The 2007–09 cycle combined housing, credit and employment collapse. The 2020 observation is a forced shutdown rather than a normal endogenous cycle.
This history establishes two rules. First, sales deterioration is common before recession. Second, incentives and supply constraints can move recorded sales independently of household demand. A reliable model must use momentum, drawdown and other channels rather than one absolute threshold.
The typical decline begins before the official recession month
Each episode is indexed to the sales level twelve months before the NBER recession start. Across all six episodes, the mean path was already down 6.9% eight months before recession, 7.9% four months before, 6.7% one month before and 10.4% in the opening month. Three months into recession, the mean decline reached 19.9%.
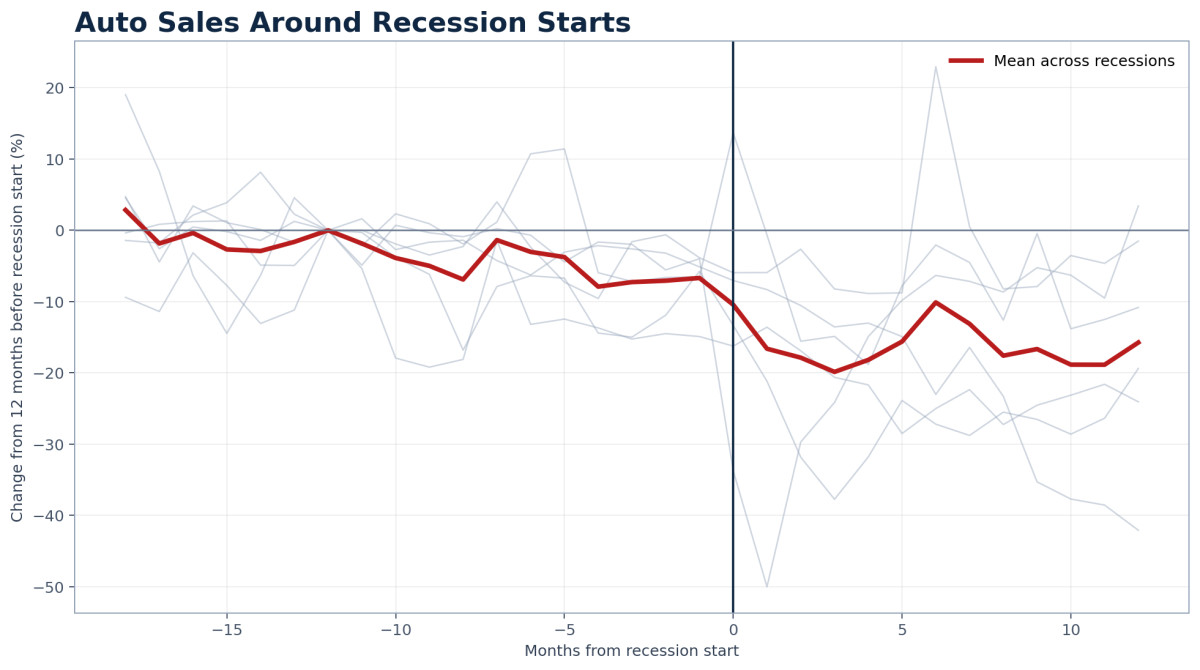
The dispersion matters. The 2001 episode did not behave like 2008, and 2020 was singular. The event study supports auto sales as an early cyclical channel; it does not support a mechanical rule that every 5% decline means recession.
Mid-2026 sales momentum is inconsistent with an economy already in broad contraction
June official sales were 17.037 million SAAR, up 4.6% from a year earlier. Three-month annualized momentum was 23.9%, six-month momentum was 8.1%, and population-adjusted sales were up 4.4% year over year. Sales remained 7.2% below the trailing two-year monthly high, but that drawdown alone is not recessionary.
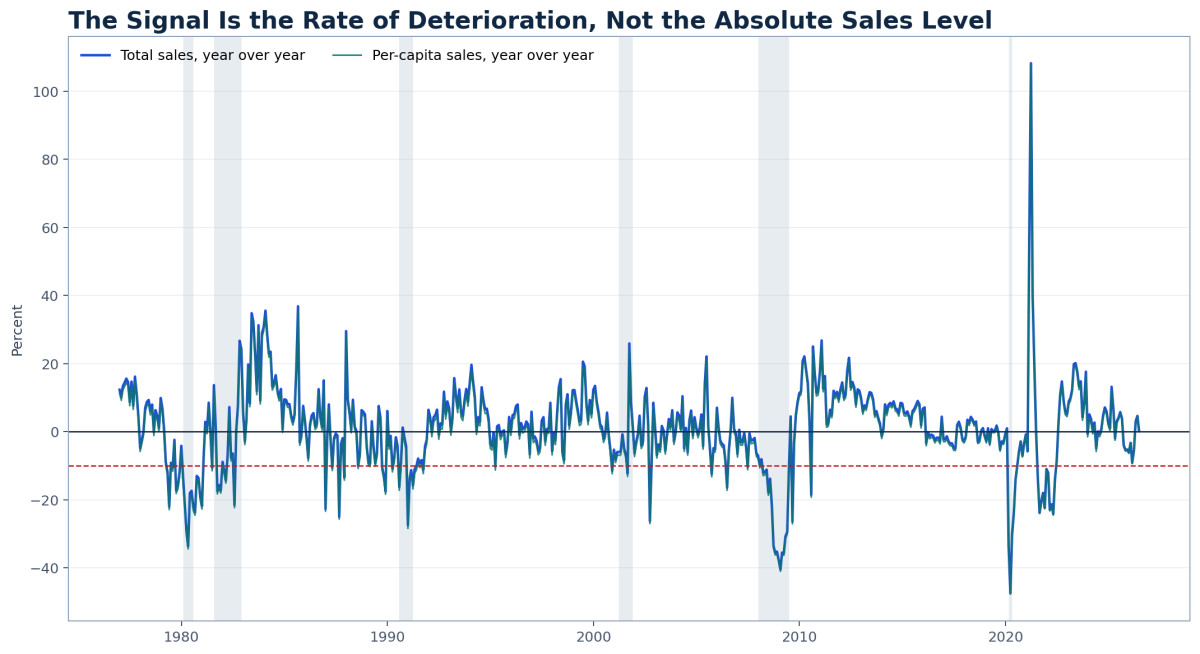
July private forecasts reinforced the result. Cox estimated a 16.7-million pace and J.D. Power–GlobalData 16.9 million. Those are not final government observations and are not inserted into the regression panel. They are a live directional check.
Strong sales can coexist with a weakening median buyer
Cox explicitly attributed the July resilience partly to affluent buyers and equity-market strength. That statement changes the interpretation. If households with appreciating portfolios and high income provide the marginal demand, unit sales become less representative of the median household.
Fleet activity also mattered in June. A fleet purchase counts in total unit sales but does not communicate the same household confidence as a retail borrower accepting a seven-year payment. Incentives can support units while reducing manufacturer margins. Leasing can reduce the monthly payment while creating future used supply. Each channel sustains the total for a different reason.
This is the same architecture identified in the Q2 GDP report. Consumption can remain strong while real disposable income falls because the aggregate is supported by higher-income spending, credit substitution and essential expenditure. Auto sales add another distribution test: who is still buying, with what financing, and at what manufacturer cost?
Price inflation slowed; the payment shock did not disappear
New-vehicle CPI was up only 0.5% year over year in June, while used cars and trucks were down 1.8%. That sounds disinflationary. It does not reverse the cumulative price jump that occurred after 2020.
The commercial-bank finance rate for a 60-month new-auto loan was 7.14% in May. The rate matters against the financed balance, not against the latest inflation rate. A vehicle whose price rose sharply during 2020–2023 remains expensive even when its price stops increasing.
Manufacturers can defend volume with incentives, subvented rates and longer terms. Those tools transfer cost away from the visible sticker or monthly payment, but they do not eliminate it. The cost appears in manufacturer finance arms, residual values, margins or future used-vehicle supply.
The stock of debt is large; the latest delinquency flow is elevated but stable
New York Fed data place auto debt at $1.685 trillion in Q1 2026, up $18 billion during the quarter and $43 billion from a year earlier. The annualized transition into serious delinquency was 2.97%, almost unchanged from 2.94% in Q1 2025.
This does not support a fresh national auto-credit break. It also does not mean the system is healthy. Serious delinquency is a lagging consequence of earlier underwriting, vehicle prices and household shocks. The national rate averages prime and subprime borrowers, new and seasoned loans, banks, credit unions and finance companies.
The recession sequence normally progresses from weaker approvals and originations to weaker sales, then delinquency and repossession after income fails. Waiting for delinquency alone produces a late signal.
Falling used prices help the next buyer and hurt the current borrower
Used-vehicle deflation has two opposing effects. A lower used price improves affordability for a cash buyer or new borrower. The same price decline reduces the trade-in value supporting an existing loan.
If the loan balance exceeds the vehicle's value, the borrower must provide cash, keep the vehicle longer or roll negative equity into the next loan. Rolling the balance raises the next payment and increases loss severity if default occurs. That mechanism can suppress turnover even when the household still needs a replacement vehicle.
The auto system therefore contains a collateral accelerator similar to housing but with faster depreciation. Rising used values during 2021 improved equity and enabled trades. Normalization removes that support. A labor-market shock would expose the remaining mismatch.
Sales must be separated from production, inventory and incentives
A recession signal is stronger when retail demand, production and dealer orders weaken together. It is weaker when sales fall because factories cannot deliver vehicles. The pandemic is the clearest example: scarcity reduced unit sales while raising prices and dealer margins.
The reverse can also occur. Production can outrun retail demand, inventories rise, incentives expand and fleet sales absorb units. Headline sales remain acceptable while economics deteriorate upstream. Manufacturer profit warnings, finance-arm provisions and supplier schedules can reveal the change before national units collapse.
The 2026 market shows resilience with material incentive support and segment rotation. Hybrids gained share, EV share softened, and non-EV incentives increased sharply in the J.D. Power–GlobalData July forecast. That is not recession; it is competition and affordability pressure working through product mix.
Two models test the auto signal without pretending it is the entire economy
The dependent variable equals one when an NBER recession occurs during the current month or following six months. The models are trained through December 2019 so the pandemic does not determine the fitted coefficients.
Auto-only model: year-over-year total-sales growth, three-month annualized momentum and the percentage drawdown from the trailing twenty-four-month sales high.
Cross-channel model: the three auto variables plus the 10-year/3-month Treasury spread, the three-month change in unemployment and year-over-year industrial-production growth.
Specification: P(recession within six months) = logistic(α + βX). Inputs are standardized. Class weighting prevents the small number of recession months from being ignored.
The cross-channel model is also re-estimated through time and tested on subsequent quarterly observations from 1990 through 2019. That exercise approximates real-time use but is not a full vintage-data backtest: revised historical observations remain in the panel.
Auto sales improve the signal; confirmation from labor, production and rates improves it more
| Model/test | AUC | Brier score | Recall at 50% | Current probability |
|---|---|---|---|---|
| Auto-only, 2000–2019 evaluation | 0.849 | 0.156 | 71.4% | 26.8% |
| Cross-channel, 2000–2019 evaluation | 0.959 | 0.092 | 90.5% | 15.4% |
| Expanding quarterly pseudo-out-of-sample | 0.938 | 0.106 | 82.4% | Not applicable |
The auto-only probability is higher because vehicle sales remain below the trailing two-year peak. The full model reduces the risk because sales momentum is positive, unemployment has not made a recessionary move and industrial production has not confirmed broad contraction.
False positives occur when rate shocks or temporary confidence declines reduce vehicle demand without spreading into jobs and production. False negatives can occur when a shock arrives suddenly, as in 2020. The combined model is stronger because it asks whether weakness is propagating.
The auto signal agrees with strong private demand and conflicts with weak household income conversion
The Q2 GDP report showed real GDP growing 1.5%, private domestic final sales growing 3.9%, consumer spending growing 3.2% and real disposable personal income falling 1.5%. Auto sales fit that divided picture.
Households and fleets continued buying vehicles, confirming that aggregate private demand did not collapse. The affordability and credit layers show why this cannot be translated into universal household comfort. Spending can be strong because higher-income buyers remain active, because vehicles are necessary, or because credit bridges an income shortfall.
If auto sales remain near 16.5–17 million while real income recovers, the apparent contradiction resolves positively. If real income remains negative and auto sales stay high, the financing bridge must become visible through lower savings, larger balances, longer terms or later delinquency.
The 10-year is restricting vehicles even without another Fed hike
The July average 10-year Treasury yield was approximately 4.60%. Auto funding does not price directly from one Treasury maturity, but the long end influences bank funding, securitization, required returns and the opportunity cost of carrying dealer inventory.
This connects directly to the Pattern Nexus long-end framework. The policy rate can stop rising while the private economy remains constrained where long-duration decisions occur. Housing feels it through mortgages. Commercial property feels it through refinancing. Vehicles feel it through loan rates and monthly payments.
Strong auto sales under that constraint are evidence of demand resilience. They are also evidence that any further tightening would be pressing against a consumer already accepting historically expensive financing.
Recession is not the end of the framework; it is the policy-permission event
Pattern Nexus has never treated recession as the final destination. Recession is the point where private contraction creates political and institutional permission for the next liquidity response.
The sequence is mechanical: high rates and collateral pressure weaken originations; durable demand and production slow; employment deteriorates; delinquency rises; recession becomes visible; the Fed and fiscal authorities gain permission to ease, guarantee, transfer or purchase.
In 2020 the response bypassed several traditional channels and reached households directly. The next downturn may combine rate cuts, balance-sheet support, fiscal transfers, industrial subsidies and credit guarantees. AI and robotics displacement could increase the pressure for a broader household-support architecture.
Auto sales matter because they locate the transition. Today they say the private durable-demand channel has not broken. If they fall with employment and credit, the economy will be moving from tightness into the policy-permission phase.
Three paths through mid-2027
Base case: divided expansion, slower auto market — 55%
Sales remain mostly between 15.6 and 16.6 million SAAR through mid-2027. Affluent households, replacement demand, fleets and incentives prevent collapse. Lower-income access remains weak. Economic growth slows without an immediate recession. The 10-year remains the principal restraint, and manufacturer margins weaken before national units do.
Downside: auto confirmation of recession — 30%
Sales fall below 15 million, year-over-year growth moves below −8%, unemployment rises at least 0.5 point over three months, industrial production contracts and banks tighten auto standards. Serious delinquency rises after the sales break. A recession begins within six to twelve months, followed by a forced rate and liquidity response.
Upside: affordability repair without contraction — 15%
Long yields fall, loan rates decline, real disposable income recovers and manufacturers introduce lower-priced models without a labor-market break. Sales hold near 16.5–17 million while incentives normalize. The current expansion broadens rather than merely extending through affluent demand.
These are Pattern Nexus conditional judgments as of August 6, 2026. They are not investment advice or guaranteed outcomes.
What would confirm or falsify the current conclusion?
| Signal | Current reading | Recession confirmation | Soft-landing confirmation |
|---|---|---|---|
| Total vehicle SAAR | 17.0m official June; 16.7–16.9m July estimates | Below 15m for three months | Above 16m without rising incentives |
| Sales year over year | +4.6% | Below −8% | Positive with broader retail mix |
| Auto-loan standards | −4.5% net tightening | Above +20% | Stable or easing |
| Serious auto delinquency flow | 2.97% | Sustained move above 3.5% | Declines with stable balances |
| Unemployment | 4.2% | +0.5 point in three months | Stable with positive payroll growth |
| 10-year Treasury | 4.60% July average | Stays high as jobs weaken | Falls without credit stress |
The present thesis is falsified immediately if sales momentum turns sharply negative and the deterioration spreads into labor, production and bank standards. It is strengthened if sales remain above 16 million while real income improves and incentive dependence falls.
The recession signal has not fired
Vehicle sales are one of the cleanest places to observe the household decision to accept duration. Historically, that decision weakens before or during every recession. It is not weakening that way now.
The correct conclusion is not that the economy is universally strong. The buyer mix is concentrated, financing remains expensive, real income conversion is weak and used collateral is depreciating. The auto market is being held together by replacement need, higher-income demand, fleets, incentives and continued credit access.
That structure can persist. It can also reverse quickly if employment deteriorates. The sales number will matter most when it stops standing alone—when weaker units arrive with tighter standards, lower production, rising unemployment and accelerating delinquency.
Auto sales are not predicting an immediate recession in August 2026. They are identifying the exact channel through which the next recession will become visible if the long-end and household-income pressures finally spread.
Primary data and research sources
- [1] U.S. Bureau of Economic Analysis via Federal Reserve Bank of St. Louis, Total Vehicle Sales [TOTALSA].
- [2] Cox Automotive, July 2026 New-Vehicle Sales Forecast, July 27, 2026.
- [3] J.D. Power and GlobalData, Automotive Forecast, July 2026, July 24, 2026.
- [4] Federal Reserve Bank of New York, Household Debt Balances Rise Slightly as Delinquency Transition Rates Hold Steady, May 12, 2026.
- [5] Board of Governors of the Federal Reserve System via FRED, Finance Rate on Consumer Installment Loans at Commercial Banks, New Autos, 60 Month.
- [6] Board of Governors of the Federal Reserve System via FRED, Net Percentage of Domestic Banks Tightening Standards for Auto Loans.
- [7] National Bureau of Economic Research via FRED, U.S. Recession Indicator [USREC].
- [8] U.S. Bureau of Labor Statistics via FRED, CPI: New Vehicles and CPI: Used Cars and Trucks.
- [9] Board of Governors of the Federal Reserve System via FRED, Motor Vehicle Loans Owned and Securitized.
- [10] Board of Governors of the Federal Reserve System via FRED, Consumer Motor Vehicle Loans Owned and Securitized by Finance Companies.
- [11] Federal Reserve and U.S. Treasury via FRED: 10-Year–3-Month Treasury Spread, 10-Year Treasury Yield, Unemployment Rate, and Industrial Production.
Model method
The monthly panel begins in January 1976. Recession labels use NBER dates represented by USREC. Models are trained through December 2019. The dependent variable equals one when recession occurs in the current or following six months. Predictors are standardized and logistic regression uses class balancing. Reported 2000–2019 statistics evaluate fitted models over that period; the expanding exercise refits on prior data and predicts quarterly observations from 1990 through 2019. Historical series are current revised vintages, not ALFRED real-time vintages.
July sales estimates are excluded from the fitted panel because they are private forecasts rather than final BEA observations. No model probability should be interpreted as a guarantee, trading signal or official recession forecast.
What's Your Reaction?
 Like
0
Like
0
 Dislike
0
Dislike
0
 Love
0
Love
0
 Funny
0
Funny
0
 Wow
0
Wow
0
 Sad
0
Sad
0
 Angry
0
Angry
0

Nexus (Christopher)
Founder of Pattern Nexus. I research markets, macro, geopolitics, AI, history, ancient systems, and the patterns most people overlook. I’m also building Market Radar, a trading scanner designed to read pressure, risk, confirmation, and setup quality before ch…
Related research

CERN Just Put ESFD in a Testable Place: Higgs Decay, Off-Shell Z Bosons, and the Field Beneath the Particle
CERN’s ATLAS and CMS experiments have found strong evidence for entanglement in the spin structure of Higgs → ZZ* → 4ℓ decays. The result i…
41 shared topics.
August CPI Just Activated the Fed’s One-Hike Option—and Deepened the Long-End Trap
August CPI rose 0.4% on the month and 3.4% from a year earlier, while core CPI rose a hotter-than-expected 0.3% even as its annual rate eas…
42 shared topics, 1 shared asset.
Polar Vortex Watch 2026–27: Early Arctic Organization Is Now Pressing Historical Extremes
What started as an unusual late-August structural signal is becoming something much harder to dismiss. The 10-hPa Arctic winds have moved a…
41 shared topics.
Polar Vortex Watch 2026–27: The Early Organization Signal, Measured
The wind-speed test and the geometry test give different answers. Pattern Nexus compares 48 autumn wind series and 744 historical height fi…
41 shared topics.
No One Who Wants Power Should Have It: The 90-Day State
Elections reward the people best adapted to campaigning, fundraising, party advancement and self-promotion—not necessarily the people best …
41 shared topics.
The Yen Line Broke: The Intervention That Changed the Global Liquidity Map
yen-line-broke-us-japan-intervention-global-liquidity-map Meta description: Pattern Nexus reconstructs the yen’s plunge to a 40-year low, …
43 shared topics, same research avenue.
The Oil Inventory War Machine: How Long the Global Buffer Can Hold
A full Pattern Nexus reconstruction of U.S. and global oil inventories from the 1970s through the 2026 war shock, including original regres…
43 shared topics.
The Sixes Are Never Good: Q3, October Surprises, and the Pattern Window Opening in 2026
The number is not the mechanism. The window is. Across 1976, 1987, 1996, 2006, and 2016, major shocks kept clustering around Q3 and October…
43 shared topics.
Comments (0)
Security Check
Please complete the captcha to verify you are human.