

Two Economies, One Balance Sheet: The Unstable Barbell of 2026
Reserve support has returned, but real long rates, fiscal supply, and an AI-energy capital wave are splitting the U.S. economy between capital strength and household fragility. This data-rich Pattern Nexus report maps the four feedback loops connecting Federal Reserve plumbing, Treasury duration, fiscal interest, housing lock-in, household credit, labor churn, AI infrastructure, power demand, dollar rails, and gold. It closes with four scenarios, a public-call audit, and a 90-day trigger dashboard.

The economy is liquid at the reserve layer, tight at the duration layer, profitable at the capital layer, and fragile at the household cashflow layer.
- This is not one economy moving at one speed. Second-quarter real GDP grew at a 1.5% annualized rate, yet private domestic final purchases rose 4.2% and corporate profits increased by $400.9 billion. The capital side is materially stronger than the headline growth rate suggests.[1]
- The household side has less insurance. July real consumption was essentially flat, the personal saving rate was 3.0%, and August survey respondents expected spending to grow 5.2% against income growth of 3.0%.[2][16]
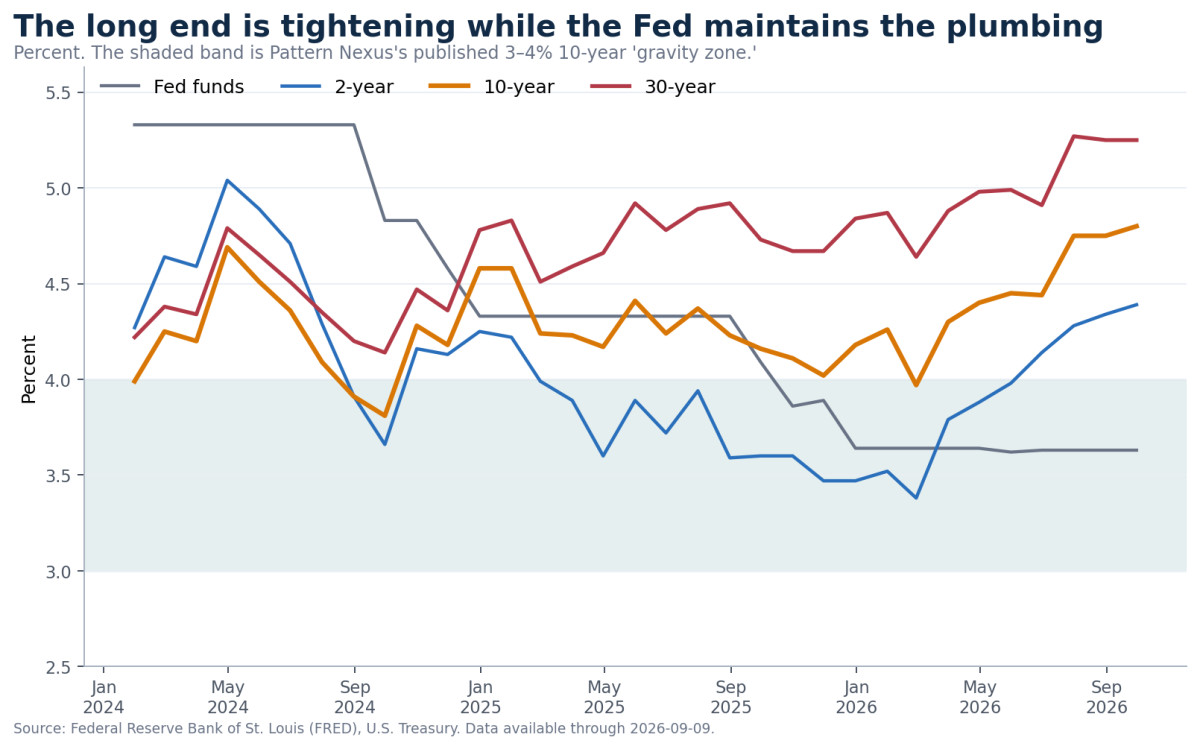
- The Fed repaired the plumbing, not the price of duration. QT ended in December 2025 and reserve-management purchases followed, but the 10-year Treasury reached 4.80%, the 30-year 5.25%, and the average mortgage rate 6.71%.[10][14][24]
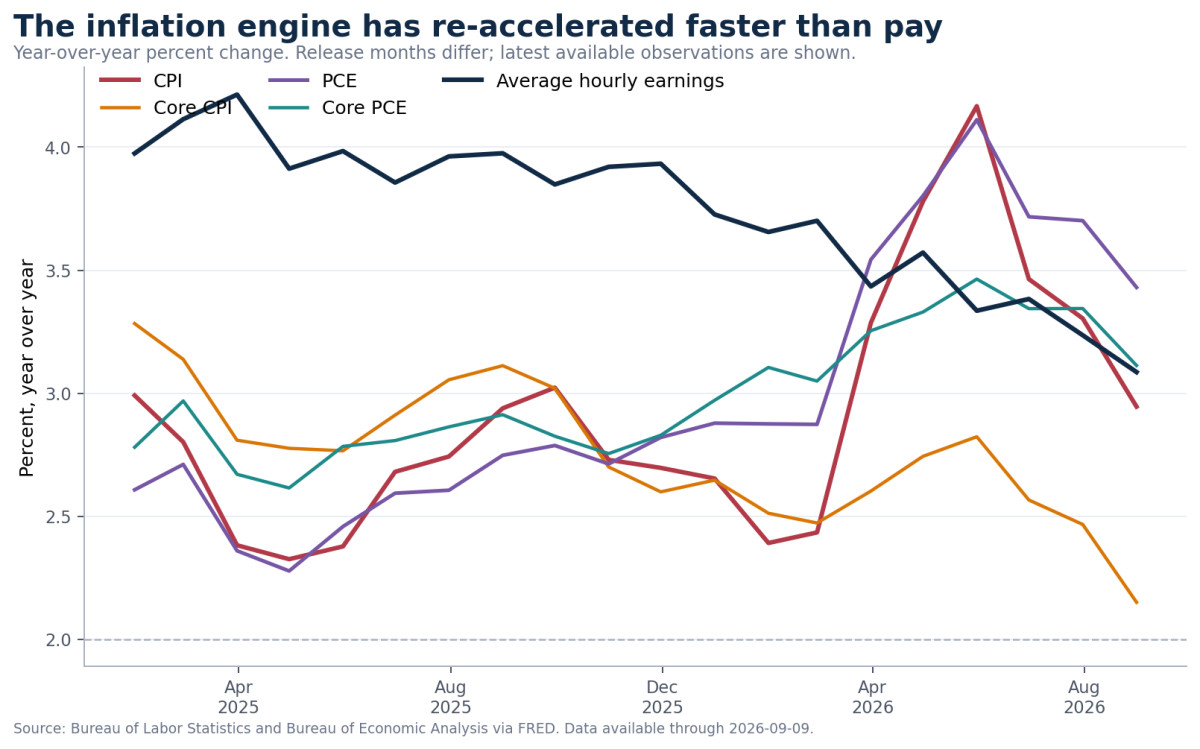
- Inflation is now a stack rather than one fading wave. July CPI was 3.4% and PCE inflation 3.7%, with energy, shelter, tariffs, geopolitical disruption, fiscal demand, and AI-linked demand operating through different channels.[2][3][8]
- Fiscal dominance is appearing through the long end. Gross federal debt crossed $40 trillion, the fiscal-year-to-date deficit reached $1.799 trillion through July, and accrued interest through August was 12.3% above the comparable 2025 period.[17][18][19]
- Housing is clearing through time and volume, not a national liquidation. Starts and new-home sales are weak, new-home inventory equals 9.6 months of supply, and nominal national price indexes remain positive. That is the Great Housing Plateau in live data.[20][21][25][26][34]
- AI has crossed from narrative into physical infrastructure. Data-center construction is running at a $75.2 billion annual pace, up 57.2% year over year; electric-power construction is $137.9 billion; and capital-goods imports reached a record $140.3 billion in July.[22][23]
- The boom is still narrow. Manufacturing-construction spending is down 21.7% year over year, consumer-goods output is down 1.8%, and real hourly compensation fell 0.1% over the year even as productivity and profits rose.[6][13][22]
- The base case is controlled compression, not an effortless soft landing. The decisive variable is the long real rate. If it falls without a credit accident, the barbell can broaden. If it stays high while household buffers deteriorate, the capital boom and the consumer squeeze become one break mechanism.
This report combines current national-accounts, inflation, labor, housing, Treasury, Federal Reserve, household-credit, construction, trade, energy, gold, and dollar-system data into one transmission map. It separates official policy labels from economic mechanics, distinguishes stocks from marginal flows, audits earlier Pattern Nexus calls without moving the goalposts, and provides explicit six-to-twelve-month scenarios with confirmation and invalidation triggers.
Two economies are sharing one national balance sheet
The contradiction is the signal.
The 10-year Treasury is yielding 4.80%. The 30-year mortgage is 6.71%. The personal saving rate is 3.0%. Data-center construction is up 57.2% from a year ago.
Those numbers do not describe one economy. They describe two economies sharing one national balance sheet.
One economy is rich in capital, collateral, and access. It includes hyperscalers, large public companies, infrastructure developers, government-supported credit channels, and asset owners. Its strength is visible in profits, AI and power construction, business-equipment output, and financial-asset prices.
The other economy is governed by monthly cashflow. It includes renters, first-time buyers, borrowers carrying card or auto balances, small firms facing tighter underwriting, and workers trying to trade up in a low-churn labor market. Its condition is visible in real compensation, saving, mortgage activity, delinquency flows, and consumer expectations.
The Pattern Nexus frame for this regime is an unstable barbell. It is not a synchronized recession. It is not a clean soft landing. It is a system in which reserve and balance-sheet support can lift the capital side before long-rate relief reaches the household side.
The bridge between the two economies is the long real rate. It determines the discount rate for Treasury duration, housing, project finance, private credit, and the refinancing loop beneath the AI buildout. If it falls cleanly, the barbell can compress into a broader expansion. If it remains high while household buffers thin, the barbell becomes unstable.
Fiscal-duration loop
Deficits increase Treasury supply. Supply and uncertainty raise term premium. The Fed supports reserves with bills, but private markets still carry duration.
AI-capex loop
Compute demand becomes data centers, grid connections, cooling, chips, software, imported equipment, credit, and collateral.
Household-buffer loop
Prices and financing outrun income. Households save less, draw credit, trade down, or defer large purchases.
Housing-lock loop
High rates reduce demand, while old low-rate mortgages reduce supply. Turnover collapses before national nominal prices do.
01 · THE REGIME
Four feedback loops are producing one divided economy
Conventional macro labels flatten the mechanisms that matter. The useful question is not whether liquidity is “on” or “off.” It is where liquidity enters, which balance sheets can capture it, what collateral it supports, and which cashflows remain exposed to the long rate.
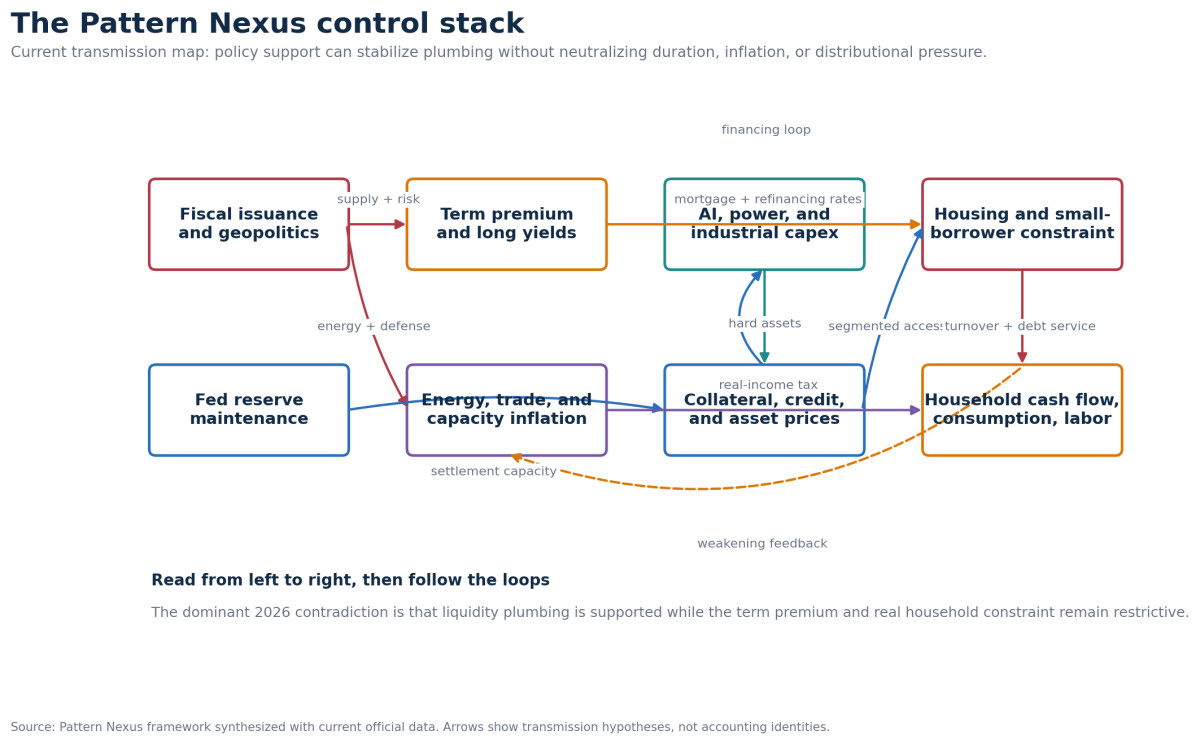
Loop 1: fiscal issuance → term premium → selective liquidity
Large deficits and a rising interest bill increase the duration private markets must absorb. The Fed can maintain ample reserves through bill purchases without absorbing that duration risk. Reserve plumbing can therefore improve while 10- and 30-year yields rise.[9][10][14][17]
Loop 2: AI demand → power and data centers → credit and collateral
Compute demand is turning into concrete, electrical equipment, grids, cooling systems, and capital-goods imports. These projects create supplier revenue and collateral values that can attract more financing. They also compete for electricity, equipment, skilled labor, and long-duration capital.[8][13][22][23]
Loop 3: prices and financing → household buffer → revolving credit
When price growth exceeds wage growth and financed purchases remain expensive, households protect consumption by saving less, drawing credit, or trading down. The debt stock looks stable because mortgages dominate it; stress appears first in flows into delinquency on cards, autos, and marginal mortgages.[2][6][15][16]
Loop 4: mortgage lock-in → low mobility → sticky nominal prices
High mortgage rates suppress buyers, but owners with 3% and 4% legacy coupons also withhold supply. Builders use incentives and carry inventory. Real prices erode beneath sticky nominal indexes. The adjustment happens through time, mobility, and volume before it happens through a national price collapse.[20][21][24][34]
The system is not choosing between liquidity and tightening. It is delivering liquidity to the shortest part of the balance sheet while forcing households and investors to pay the market price for duration.
02 · GROWTH AND INFLATION
Top-line growth understates the capital impulse—and the household drag
Second-quarter real GDP grew at a 1.5% annualized pace, down from 2.1% in the first quarter. Underneath that slowdown, private domestic final purchases advanced 4.2%, real gross domestic income rose 2.2%, and the average of GDP and GDI increased 1.8%. Corporate profits from current production increased by $400.9 billion.[1]
That is not a contracting aggregate economy. It is an economy reallocating toward profitable, investment-heavy activity.
July consumption data show the other side. Nominal personal consumption expenditures rose 0.2%, but real PCE was essentially flat. Services outlays increased by $86.2 billion while goods outlays fell by $49.9 billion. The saving rate remained at 3.0%. Consumption is continuing, but it is being maintained with less protection against the next shock.[2]
Inflation is no longer one story
July CPI inflation was 3.4% year over year and PCE inflation was 3.7%. Core CPI was 2.5% and core PCE 3.3%. Shelter inflation eased to 3.2%, but energy prices rose 14.7% and gasoline 24.6%. The July FOMC minutes also identified tariffs, Middle East disruption, and AI-related demand for chips, steel, software, and electricity as active price channels.[2][3][8]
| Inflation engine | Direction | Transmission |
|---|---|---|
| Cyclical demand | Mixed | Slow aggregate growth and weak consumer-goods output limit broad demand pressure. |
| Energy | Upward | Oil and refined-product tightness feed transportation, goods, electricity, and household bills.[27] |
| Shelter | Easing slowly | Rent and shelter inflation are decelerating, but housing supply and financing remain constrained. |
| Trade and tariffs | Upward risk | Pass-through risk coexists with a record level of capital-goods imports. |
| AI infrastructure | Targeted pressure | Power, chips, electrical equipment, construction labor, software, and financing are pulled into one capex complex. |
| Fiscal demand | Persistent | Large deficits support nominal activity and add to term premium without requiring a broad consumer boom. |
Interpretation: Disinflation remains possible, but it is no longer a straight unwind of one pandemic-era shock. Improvement in one layer can be interrupted by scarcity in another. That makes long-rate relief less automatic.
03 · FED AND DURATION
The Fed fixed the plumbing. The long end did not care.
The Federal Reserve held the target range at 3.50%–3.75% on July 29. By September 8, the 2-year Treasury yielded 4.39%, the 10-year 4.80%, and the 30-year 5.25%. The 10-year was 41 basis points above the 2-year and roughly 61 basis points above its first 2026 observation.[7][10]
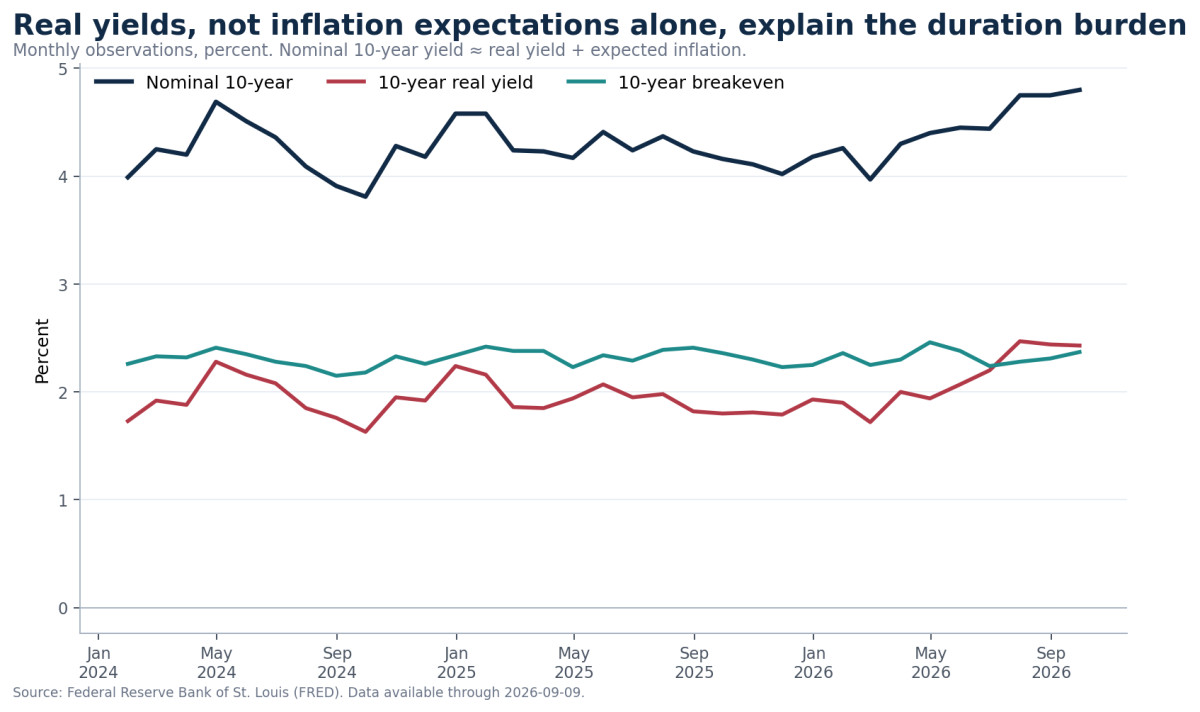
The greater-than-10-year real Treasury yield averaged 2.92% on September 8, up from 2.55% on January 2. Breakeven inflation does not explain the entire move. In PN terms, duration is being priced through real capital demand, issuance, fiscal risk, and required term premium—not only expected inflation.[10][36][37]
Reserve management is not duration suppression
QT ended on December 1, 2025. The New York Fed began reserve-management purchases on December 12, initially targeting roughly $40 billion per month plus reinvestments, then tapering the pace. The purchases are concentrated in Treasury bills and are explicitly intended to maintain ample reserves and short-rate control—not to signal a change in monetary-policy stance.[14][33]
That policy-label distinction should be preserved. The balance-sheet effect should also be measured. For the week ending September 2, Federal Reserve assets were $6.737 trillion, Treasury holdings $4.552 trillion, reserve balances $2.895 trillion, and the Treasury General Account $0.968 trillion. Treasury holdings were $352 billion higher than a year earlier, while mortgage-backed securities and reserve balances were lower.[9]
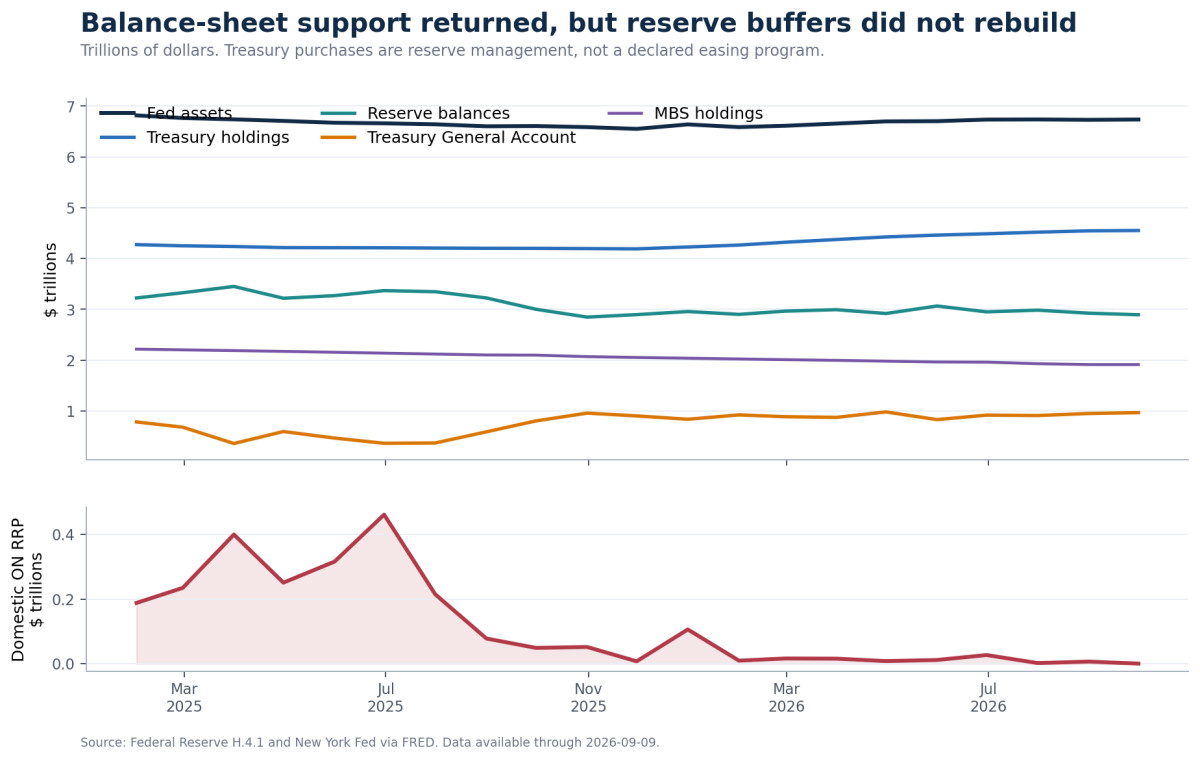
Core distinction: The Fed can support the reserve floor by buying bills without removing the duration the market is being asked to finance. Liquidity support has returned at the plumbing layer. Duration suppression has not.
04 · FISCAL DOMINANCE
The interest bill is becoming a market constraint
Gross federal debt reached $40.095 trillion on September 4. The July Monthly Treasury Statement showed a $1.799 trillion deficit for the first ten months of fiscal 2026—already $23 billion larger than the entire fiscal-2025 deficit. Net interest was $931 billion through July, while accrued interest through August reached $1.268 trillion, 12.3% above the comparable 2025 period and 56.3% above 2023.[17][18][19]
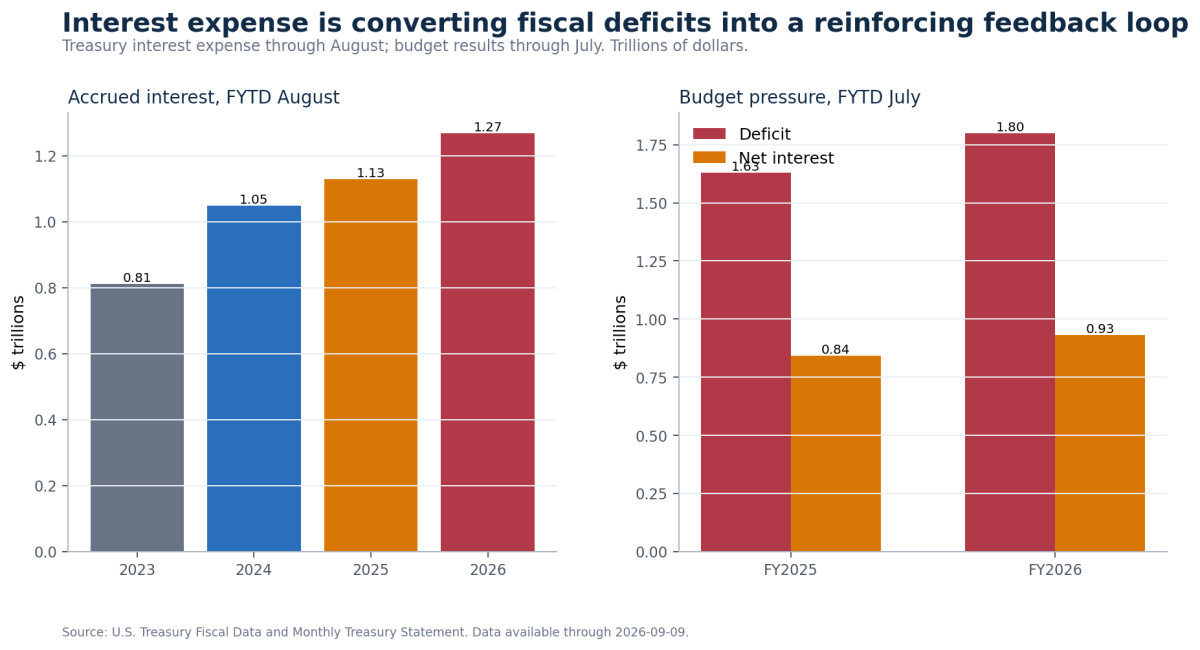
This is fiscal dominance in market form. The central bank does not need to lose legal independence for fiscal conditions to constrain monetary outcomes. Large issuance, rising debt service, and heavy private capital demand can keep term premium and real yields elevated. Front-end easing then has less power over mortgages, project finance, and housing turnover.[36]
Deficits add bills, notes, and bonds that dealers and end investors must absorb.
Higher coupons enlarge future deficits and create more issuance.
Investors demand compensation for duration, inflation, and supply uncertainty.
The Fed can ease the front end while the market keeps the long end restrictive.
The PN 3%–4% 10-year gravity-zone call missed on level and timing. The 10-year is 4.80%. That has to stay on the record. The associated mechanism—high long rates transmitting stress into housing, fiscal interest, and rate-sensitive credit—is visible, but mechanism evidence does not erase a level miss.[37][39]
05 · LABOR AND HOUSEHOLDS
Jobs are appearing, but churn, pay, and resilience are not
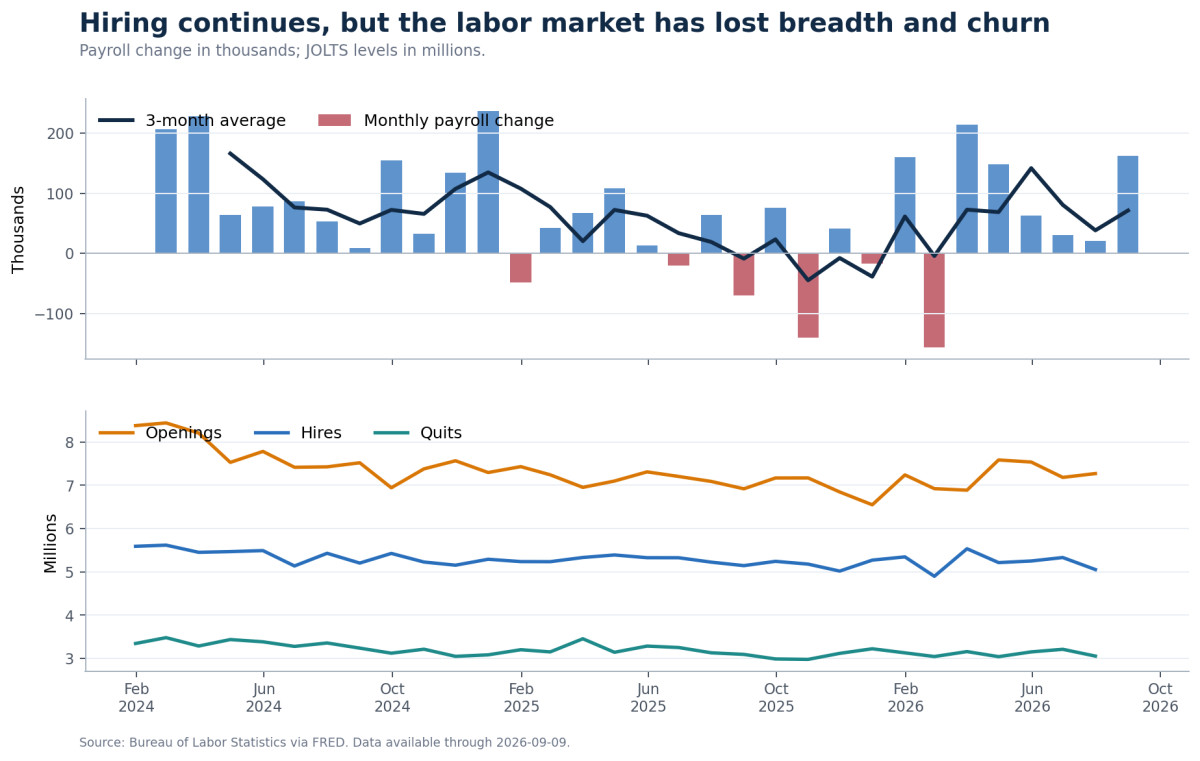
August payrolls rose by 162,000 and unemployment held at 4.1%. The underlying labor market is cooler than that combination suggests. Average payroll growth over the prior twelve months was only 31,000. Food services and local-government education supplied 101,000 of the month’s gain. Information employment fell by 23,000, including an 8,000 decline in data processing and web hosting. Participation was 61.6%, down from 62.3% a year earlier.[4]
July job openings stood at 7.3 million, hires at 5.1 million, quits at 3.1 million, and layoffs at 1.7 million. This is a low-churn labor market: firms are not shedding workers at a classic recessionary pace, but workers have fewer pathways to trade up.[5]
Productivity is rising without broad real-pay acceleration
Nonfarm productivity increased 1.4% annualized in the second quarter and 2.2% over the year. Unit labor costs rose 1.4% year over year. But real hourly compensation fell 3.3% annualized in the quarter and 0.1% over the year, while labor’s income share fell to 52.8%, the lowest reading in the series beginning in 1947. Nonfinancial-corporate unit profits rose 17.8% over the year.[6]
That is the distributional core of the barbell: productivity and profits can validate capital spending without delivering comparable purchasing-power gains to households.
Consumption is being maintained with less insurance
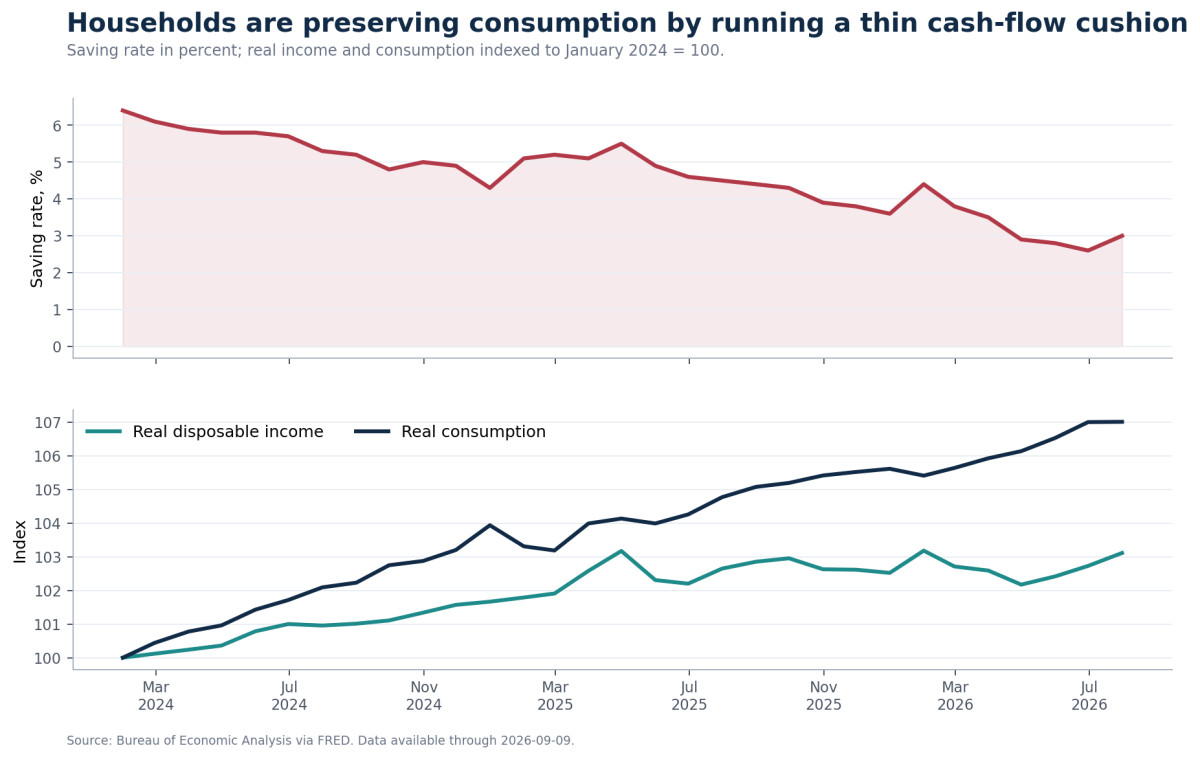
The August Survey of Consumer Expectations makes the imbalance explicit. Median expected earnings growth was 2.9%, expected income growth 3.0%, and expected spending growth 5.2%. The probability that unemployment will be higher in a year rose to 44.4%, its highest since April 2020. The expected chance of missing a minimum debt payment was 13.2%, and respondents reported harder credit access.[16]
Debt is resilient in stock and stressed at the margin
Total household debt was $18.771 trillion in the second quarter. Mortgages accounted for $13.117 trillion, credit cards $1.263 trillion, auto debt $1.713 trillion, and student loans $1.651 trillion. The mortgage-heavy stock dampens immediate systemic stress because many borrowers retain low fixed coupons. Yet 4.7% of outstanding debt was in some stage of delinquency, and serious-delinquency flows on mortgages, cards, and autos were higher than a year earlier.[15]
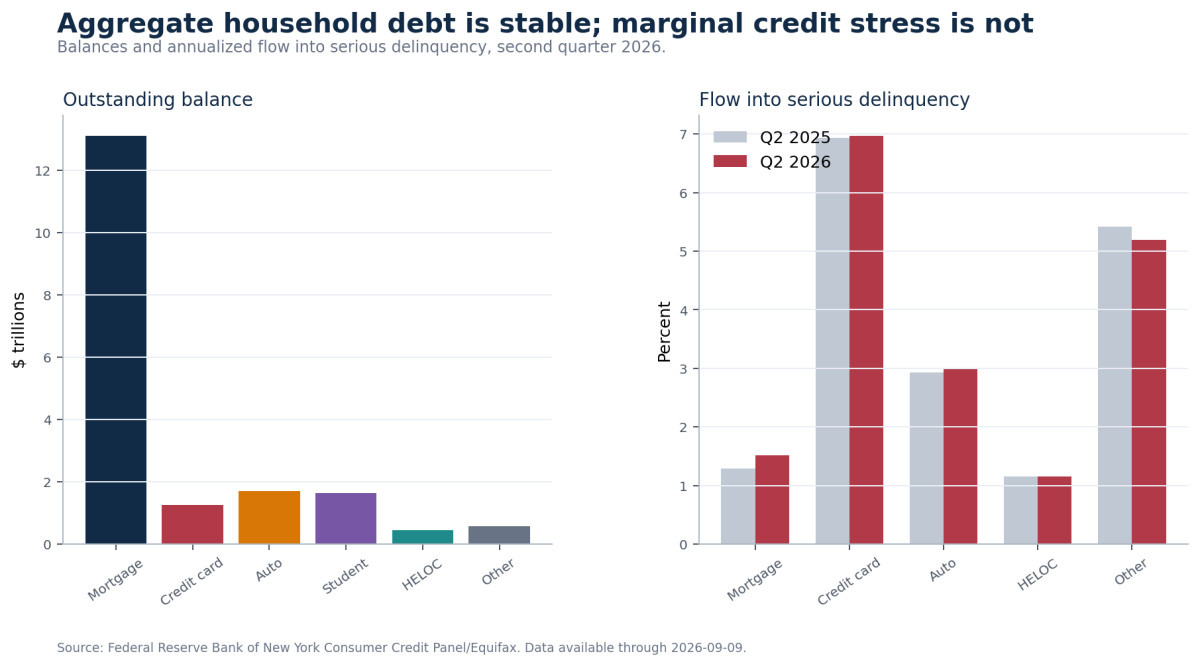
Household trigger: The cycle becomes recessionary if labor churn falls further while saving remains near 3% and serious delinquency spreads from cards and autos into mortgages. A lower policy rate alone will not repair that combination quickly.
06 · HOUSING PLATEAU
Affordability is clearing through volume and time—not a national nominal crash
The average 30-year mortgage rate was 6.71% on September 3, up from 6.00% in early March and 6.50% a year earlier. At the July median new-home price of $393,800 with 20% down, principal and interest is approximately $2,035 per month at 6.71%, versus $1,328 at 3%—a 53% increase before property tax and insurance.[21][24]
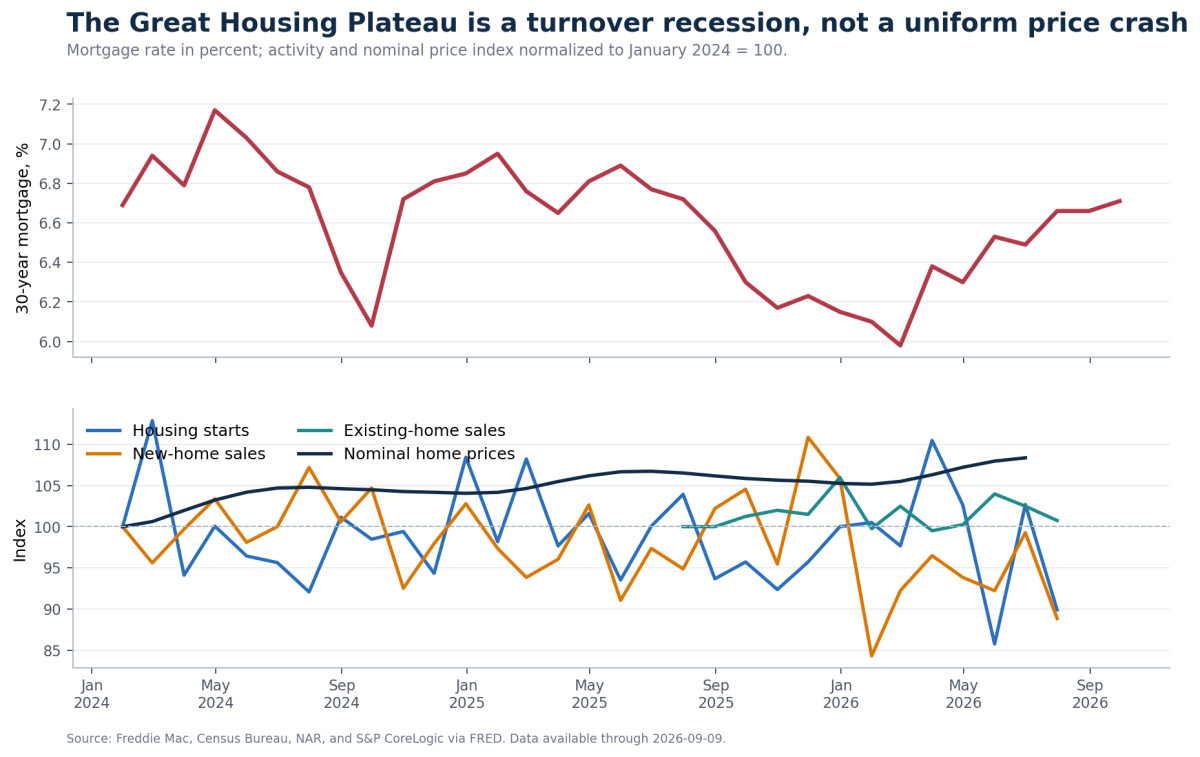
| Plateau feature | Current evidence |
|---|---|
| Demand compression | July housing starts fell 12.4% month over month and 13.5% year over year; single-family starts were 808,000 annualized.[20] |
| Builder inventory | New-home sales fell 10.5% in the month; 488,000 homes were for sale, equal to 9.6 months of supply.[21] |
| Turnover lock | High mortgage rates hit buyers while low legacy coupons deter existing owners from selling. |
| Nominal price rigidity | The Case-Shiller national index rose 1.5% year over year and FHFA prices rose 2.1%.[25][26] |
| Real and regional erosion | Real Case-Shiller values have declined for thirteen months; Chicago was up 6.9% year over year while Seattle was down 2.0%.[25] |
This is the Great Housing Plateau in live data: fewer transactions, builder incentives, local divergence, and inflation-adjusted price decline. A national nominal crash is not required for housing to damage mobility, affordability, household formation, and labor-market matching.[34]
What would falsify the plateau: a sustained rise in starts and turnover while mortgage rates remain above 6.5%, accompanied by broad—not regional—nominal price acceleration. A rapid national nominal decline would also mean the regime had shifted from plateau to liquidation.
07 · AI, INDUSTRY, ENERGY, AND TRADE
The AI trade has crossed from narrative into national infrastructure
July data-center construction ran at a $75.2 billion seasonally adjusted annual rate, 57.2% above a year earlier. Electric-power construction reached $137.9 billion, up 8.0%. Business-equipment industrial output increased 6.6% year over year. These are physical-economy signals, not merely equity multiples.[13][22][38]
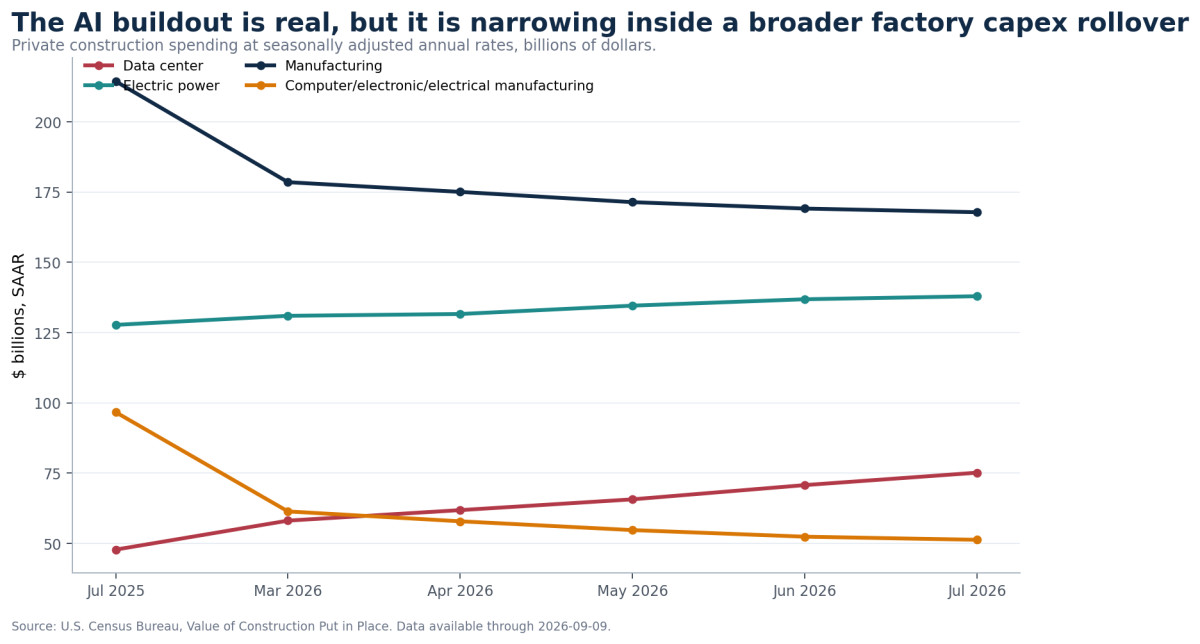
The boom is narrow enough to matter—and narrow enough to be risky
Total manufacturing-construction spending was $167.8 billion annualized, but 21.7% below a year earlier. Computer and electrical manufacturing construction fell 46.9%. Total industrial production grew only 1.1%, while consumer-goods output declined 1.8%. The economy has an investment core, not yet a broad industrial renaissance.[13][22]
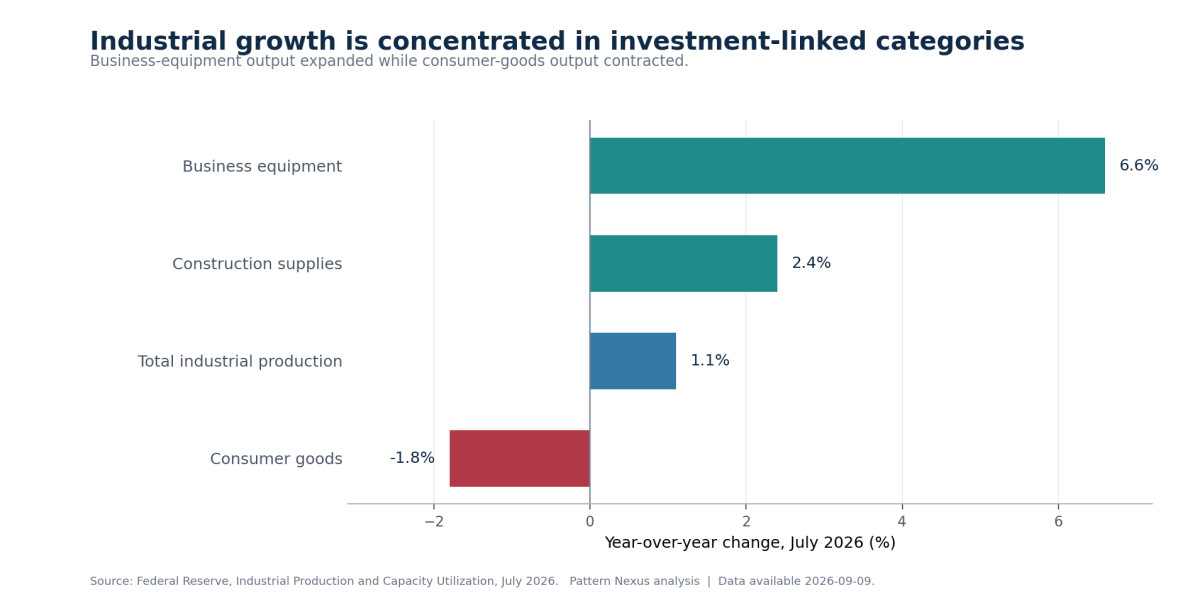
Capital-goods imports reveal the supply chain
The July trade deficit widened to $88.6 billion as imports reached $399.3 billion. Capital-goods imports set a record at $140.3 billion. The domestic buildout still depends on imported machinery, electrical equipment, and technology. Year to date, the trade deficit was lower because exports grew faster than imports.[23]
Energy is both fuel and constraint
The September Short-Term Energy Outlook estimated Brent near $91 in August after global inventories fell by roughly 400 million barrels year to date. EIA projected Brent around $90 in the second half of 2026 before averaging $74 in 2027. It also projected record U.S. electricity sales in 2026 and 2027, driven partly by data centers and manufacturing.[27]
The AI monetary-industrial engine
| Stage | Pattern Nexus transmission |
|---|---|
| 1 · Demand | Model training, inference, cloud workloads, and enterprise adoption raise compute requirements. |
| 2 · Physical build | Data centers, grid connections, generation, cooling, chips, and transmission turn software demand into fixed investment. |
| 3 · Financing | Large firms, nonbanks, project finance, and selected bank exposures fund the build; spreads and covenants become stress sensors.[8][11][12] |
| 4 · Collateral | Rising infrastructure values and expected cashflows support refinancing and additional issuance. |
| 5 · Macro feedback | Capex lifts investment and productivity, but power, equipment, construction labor, and real capital compete for scarce capacity. |
| 6 · Failure mode | Utilization shortfalls, power delays, revenue disappointment, or a long-rate shock break the collateral-refinancing loop. |
Open question: The physical thesis is confirmed. The financial flywheel remains open. The test is whether cashflows broaden fast enough to service the debt layered onto the buildout before long rates, grid constraints, or weak end-demand force cancellations.
08 · CREDIT AND MARKETS
Financial stability is contained, but the risk is asymmetric
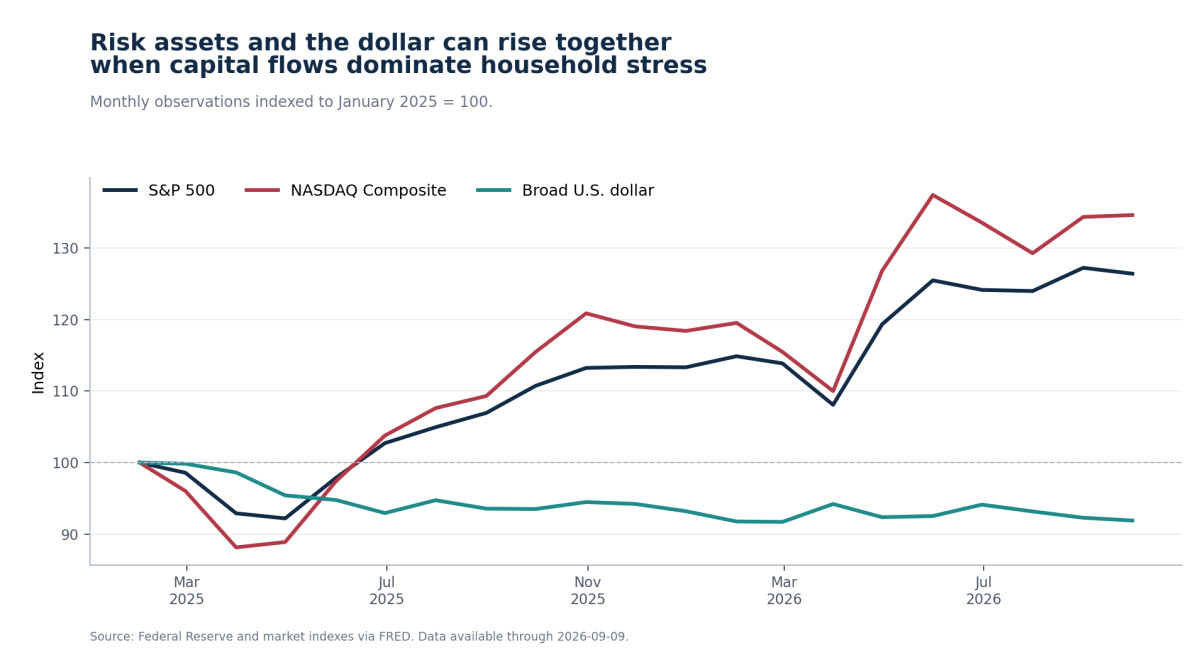
The July FOMC minutes noted that AI-infrastructure equities outperformed while hyperscaler credit spreads widened and business-development-company redemptions increased. Federal Reserve stability work also points to compressed equity risk premiums, high hedge-fund leverage, insurer vulnerabilities, and nonbank interconnections. Large-company and municipal credit remained relatively accommodative, while small-business, household, mortgage, and portions of commercial-real-estate credit remained restrictive.[8][11][12]
| Channel | High-frequency break signals |
|---|---|
| Treasury market | Auction tails, dealer balance-sheet pressure, repo volatility, term premium, a 10-year yield above 5%, or a 30-year above 5.5%. |
| AI credit | Hyperscaler spreads, project-finance terms, BDC redemptions, regional-bank concentration, and capex cancellations. |
| Private credit | Payment-in-kind income, covenant resets, lagged marks, refinancing coverage, and redemption gates. |
| Households | Serious-delinquency flows, minimum-payment expectations, saving, and job-finding expectations. |
| Housing and CRE | Mortgage applications, builder concessions, office and multifamily refinancing, and bank charge-offs. |
| Leveraged intermediaries | Treasury basis-trade leverage, insurer asset-liability mismatch, margin calls, and collateral calls. |
The core stability problem is not simply leverage. It is a mismatch between where leverage sits and where policy support arrives. The largest firms can access public markets, private credit, and infrastructure finance. The marginal household and small firm cannot issue duration to wait out the cycle.
09 · DOLLAR RAILS AND GOLD
Gold and tokenized dollars can rise together
June Treasury International Capital data showed $133.5 billion of net inflows and $207.1 billion of net foreign purchases of long-term U.S. securities, even as foreign Treasury-bill positions declined. The dollar system is still attracting institutional capital.[29]
At the same time, gold rose 13.3% in August to $4,563 per ounce. Global gold ETFs took in $18 billion and holdings reached 4,189 tonnes. Gold is responding to fiscal credibility, geopolitical risk, and demand for a non-liability reserve asset—not simply to a weak dollar.[30]
The stablecoin market exceeded $300 billion by April. The emerging reserve framework privileges cash, deposits, repos, short Treasuries, and money-market instruments. Tokenization can reinforce demand for short-dollar collateral even while reserve managers and households use gold to hedge the fiscal and geopolitical layer.[31][32][35]
Payments, settlement, portability, collateral access, and dollar distribution.
Credibility hedge, geopolitical reserve, duration alternative, and non-liability asset.
Benchmark collateral, income-bearing dollar reserve, and core global balance-sheet asset.
The rails can become more dollarized while the reserve hedge becomes more gold-intensive.
The apparent contradiction disappears once the functions are separated. Stablecoin rails optimize payments and liquidity. Gold protects against credibility, duration, and regime risk.
10 · SCENARIO MAP
Four paths for the next six to twelve months
These probabilities are structured judgments as of the September 9 data cutoff, not model-implied odds or official forecasts. The scenarios are mutually exclusive at the stated horizon and sum to 100%.
| Scenario | Probability | Mechanism | Confirms | Invalidates |
|---|---|---|---|---|
| Controlled compression | 38% | Energy eases, core inflation slows, and long yields fall without a credit accident. | 10-year below 4.25%; mortgage below 6.25%; saving above 4%; AI breadth improves. | Core PCE remains above 3.3%; 10-year above 5%; cross-channel credit stress. |
| Stagflationary squeeze | 30% | Energy, trade frictions, and AI-capacity demand keep inflation sticky while household buffers weaken. | Core PCE near or above 3.3%; saving near 3%; low labor churn; high long yields. | Real income leads spending and inflation falls below 2.8%. |
| Duration or credit break | 20% | Treasury, repo, private credit, CRE, or leveraged intermediaries force an emergency response. | 10-year above 5%; 30-year above 5.5%; auction or repo disorder; spread widening; emergency operations. | Orderly auctions, stable collateral markets, and falling real yields. |
| Broad AI-led reflation | 12% | AI capex spreads into supplier wages, productivity, manufacturing, and household income faster than financing costs rise. | Equipment, factory construction, labor income, and supplier revenues broaden together. | Only data centers and megacap profits remain strong. |
Base case: controlled compression · 38%
Oil moves toward EIA’s projected 2027 path, core inflation slows, and the 10-year returns below 4.25% without a disorderly credit event. Mortgage rates move below 6.25%, real income catches spending, and the AI build broadens. The barbell narrows rather than breaks.[27]
Primary risk: stagflationary squeeze · 30%
Energy, trade frictions, and AI-related capacity demand keep inflation sticky while household buffers weaken. The Fed cannot provide aggressive relief, long yields remain high, and growth stays positive in investment categories but recession-like in household experience.
Tail: duration or credit break · 20%
The 10-year crosses 5% or the 30-year 5.5%; repo, auctions, private credit, CRE, or leveraged intermediaries show stress. A larger Fed balance-sheet response follows. Liquidity support becomes visible because something first breaks.
Upside: broad AI-led reflation · 12%
AI capital spending spreads into supplier wages, manufacturing output, productivity, and household income faster than financing costs rise. This requires broadening evidence—not only megacap earnings or data-center spending.
Global boundary: The IMF projects 3.0% world growth in 2026 and 3.4% in 2027, with China at 4.6%. Global activity is sufficient to support technology and energy demand, but conflict, stalled disinflation, and financial repricing leave little room for policy error.[28]
11 · PN PUBLIC-CALL AUDIT
What the framework got right, what remains open, and what missed
A thesis earns credit only for what was stated before the outcome. Direction, magnitude, and timing are separate scoring dimensions. Mechanism evidence cannot be used to erase a missed level forecast.[39]
| Pattern Nexus thesis | Status | Current evidence | Falsifier or caveat |
|---|---|---|---|
| Liquidity returns after QT | Confirmed—with label caveat | QT ended; reserve-management Treasury purchases began; Fed Treasury holdings are up year over year.[9][14][33] | The official program is reserve management, not announced QE. It has not suppressed the long end. |
| Reserve-floor policy boundary | Confirmed | The Fed is actively maintaining ample reserves as RRP usage is depleted and the TGA remains large. | A durable reserve rebuild without continued purchases would weaken the active-support interpretation. |
| The Great Housing Plateau | Confirmed | Weak turnover and starts, high mortgage rates, builder inventory, sticky national prices, and regional divergence.[20][21][34] | A broad national nominal acceleration with high rates—or a liquidation—would end the plateau regime. |
| Fiscal dominance and sticky term premium | Confirmed | Debt, deficit, interest expense, real yields, and long nominal yields have all risen together.[17][19][36] | A sustained collapse in term premium despite heavy issuance would weaken the mechanism. |
| AI as a monetary-industrial engine | Physical layer confirmed; financial layer open | Data centers, power, equipment, and capital-goods imports show a real buildout.[13][22][23][38] | Revenue, utilization, supplier breadth, and debt service must validate the financing loop. |
| 3%–4% 10-year Treasury gravity zone | Miss on level and timing | The 10-year reached 4.80%, above the forecast corridor.[10][37] | The stress-transmission mechanism is visible, but it does not convert the forecast into a hit. |
| Tokenized Treasuries strengthen dollar rails | Developing | Stablecoin scale and reserve rules increasingly connect tokenized dollars to cash, repos, and short Treasuries.[31][32][35] | The net new demand effect versus bank-deposit recycling remains an open empirical question. |
Audit judgment: The framework has been strongest when mapping constraints and transmission. It has been weakest when compressing those constraints into a clean price corridor or exact timetable.
12 · THE NEXT 90 DAYS
A trigger dashboard for updating the regime call
The sequence matters: long rates and energy affect cashflow; cashflow affects credit; credit determines whether liquidity support broadens or becomes defensive.
| Node | Measure | Green | Amber | Red | Cadence |
|---|---|---|---|---|---|
| Long real rate | 10-year nominal, long real yield, curve | 10-year below 4.25% | 4.25%–5.0% | Above 5% or disorderly auctions | Weekly |
| Inflation | Core PCE, energy, shelter | Core below 2.8% | 2.8%–3.5% | Above 3.5% for three months | Monthly |
| Household buffer | Saving, real income, real spending | Saving above 4%; income leads | Saving 3%–4% | Saving below 3%; spending leads | Monthly |
| Labor churn | Hires, quits, job finding | Hires and quits rise | Stable low churn | Payroll diffusion and hires fall | Monthly |
| Housing | Mortgage rate, sales, starts | Mortgage below 6.25% | 6.25%–7% | Above 7% plus inventory build | Weekly / monthly |
| AI breadth | Equipment, manufacturing, power, wages | Output and pay broaden | Data centers lead | Cancellations or spread blowout | Monthly / quarterly |
| Credit | Cards, autos, BDCs, CRE | Delinquencies turn down | Localized stress | Cross-channel acceleration | Monthly / quarterly |
| Fed plumbing | Reserves, TGA, purchases, repo | Reserves rebuild smoothly | Managed floor | Emergency operations | Weekly |
The decision tree
- If oil falls and core PCE breaks below 2.8%, test for controlled compression: long yields, mortgage rates, and real household income should improve together.
- If inflation stays above 3.3% while job churn and saving remain weak, increase the stagflationary-squeeze weight.
- If the 10-year exceeds 5% or the 30-year 5.5%, inspect auctions, repo, hedge leverage, BDC redemptions, private-credit marks, and regional-bank exposures before interpreting any Fed response.
- If equipment output, manufacturing construction, wages, and supplier revenues broaden, increase the AI-led-reflation weight. If only data centers grow, keep the thesis narrow.
The shortest valid update is: rates → reserves → energy → real household income → credit flows → AI breadth.
13 · METHOD AND EVIDENCE
How this report separates observation, interpretation, and forecast
- Cutoff: macro, energy, and gold releases available through September 9, 2026; Treasury market rates through September 8, 2026.
- Primary evidence: BEA, BLS, Federal Reserve, New York Fed, U.S. Treasury, Census, Freddie Mac, FHFA, EIA, IMF, TIC, S&P Dow Jones Indices, and World Gold Council.
- Framework evidence: Pattern Nexus articles define the analytical map and the public call record. They do not substitute for official data.
- Policy-label rule: reserve-management purchases are not called official QE. Their balance-sheet and reserve effects are analyzed separately.
- Scenario rule: probabilities are structured judgments, not statistical forecasts or official projections.
- Audit rule: direction, magnitude, and timing are scored separately. A mechanism cannot retroactively rescue a missed price level.
Known limitations
- Many July and August releases will be revised; payroll revisions have recently been material.
- Construction spending is an annualized dollar flow, not a count of completed projects, power capacity, or installed compute.
- Consumer expectations are survey medians and probabilities, not realized outcomes.
- Gold, equity, and dollar prices embed global flows and risk preferences that cannot be attributed to one cause.
- Stablecoin reserve demand may recycle bank deposits into Treasury instruments rather than create one-for-one new demand.
- The national housing indexes conceal local differences in inventory, insurance, taxes, migration, and employment.
Research boundary: This is macroeconomic systems research, not individualized investment advice. Current observations, author interpretation, scenario judgment, and public-call auditing are kept distinct.
14 · PATTERN NEXUS LENS
The capital boom and the household squeeze are the same system
The standard debate asks whether the economy is strong or weak.
That is the wrong level of resolution.
The reserve system is being supported.
The duration system is being repriced.
The fiscal system is issuing more collateral and paying more interest.
The AI system is converting software demand into power demand, construction, equipment, imports, and credit.
The housing system is preserving old coupons by sacrificing turnover.
The household system is preserving consumption by sacrificing saving and adding stress at the credit margin.
The labor system is producing jobs without producing the churn and real-pay gains that normally widen an expansion.
These are not separate stories.
Fiscal issuance helps define the long rate.
The long rate sets the cost of housing and infrastructure finance.
AI infrastructure competes for the same power, equipment, and capital that can keep real rates elevated.
High rates preserve returns for capital while raising the hurdle rate for households and small firms.
Mortgage lock-in protects incumbent owners while blocking entrants and geographic mobility.
Thin household buffers make the entire structure more sensitive to energy, labor, or credit shocks.
The U.S. economy can look resilient in GDP and profits while feeling recessionary in cashflow because the buffers and the leverage sit in different places.
The present configuration can persist longer than a conventional recession model expects. Fixed-rate mortgages slow household repricing. Large-company balance sheets and capital-market access slow corporate repricing. Government deficits sustain nominal demand. AI projects create visible investment.
It can also turn abruptly. If the long real rate stays near present levels while energy, fiscal interest, and marginal credit deteriorate, the two sides of the barbell stop offsetting one another. Capital spending becomes more expensive at the same time that consumer demand becomes less reliable.
If the long real rate falls cleanly, the opposite sequence becomes possible. Mortgage rates ease. Housing turnover improves. Real income catches spending. Credit stress stabilizes. The AI build broadens into suppliers, wages, and productivity.
Final PN judgment: Watch the long real rate. It is the bridge between the two economies. If it falls without a credit accident, the unstable barbell can become a broader expansion. If it stays high while household buffers deteriorate, the capital boom and household squeeze will reveal themselves as one balance-sheet event.
FAQ
Frequently Asked Questions
Is the United States currently in a recession?
The available aggregate data do not show a synchronized recession. Real GDP and GDI are positive, private domestic demand is growing, and corporate profits are strong. The more accurate description is a two-speed economy in which household cashflow and rate-sensitive sectors are much weaker than capital formation and large-company balance sheets.
Why are long-term Treasury yields high if the Fed ended QT?
Ending QT and buying Treasury bills can support reserves and short-term market functioning without absorbing the notes and bonds that carry duration risk. Long yields are still being priced through real capital demand, Treasury supply, fiscal risk, inflation uncertainty, and term premium.
Are the Fed’s reserve-management purchases QE?
The Federal Reserve and New York Fed describe them as reserve-management purchases designed to maintain ample reserves and short-rate control, not as a change in monetary-policy stance. The balance sheet and Treasury holdings are growing, but the program is not treated in this report as officially announced QE.
Why has housing not crashed with mortgage rates near 7%?
High rates reduce demand, but they also lock owners into old low-rate mortgages and restrict supply. The adjustment therefore appears through low turnover, builder incentives, regional divergence, and inflation-adjusted erosion before a broad national nominal price decline.
Is AI spending strong enough to support the whole economy?
Not yet. Data centers, power, equipment, and capital-goods imports show a powerful physical buildout, but manufacturing construction and consumer-goods output remain weak. The key test is whether the boom broadens into suppliers, wages, productivity, and durable cashflows.
Where is household stress most likely to appear first?
Credit cards, auto loans, minimum-payment expectations, and other marginal cashflow channels should weaken before the mortgage-heavy aggregate debt stock. The recession risk rises if that stress spreads while saving stays near 3% and labor churn falls further.
Can gold rise while the dollar system remains strong?
Yes. Tokenized dollars and Treasuries serve payments, collateral, and liquidity functions. Gold serves as a hedge against credibility, duration, and geopolitical risk. Those functions can attract demand at the same time.
What is the most important indicator to watch?
The long real rate is the central bridge, but it should not be read alone. The shortest valid update also includes reserve balances, energy, real household income, credit flows, and the breadth of AI-linked activity.
What would invalidate the unstable-barbell thesis?
A durable combination of lower long real yields, saving above 4%, real income leading spending, stronger labor churn, broader manufacturing output, easier housing turnover, and improving credit quality would show that the expansion had broadened beyond the capital side.
SOURCES
Research, Data, and Pattern Nexus Record
- [1] Bureau of Economic Analysis, GDP, Second Estimate, and Corporate Profits, Second Quarter 2026, August 26, 2026.
- [2] Bureau of Economic Analysis, Personal Income and Outlays, July 2026, August 28, 2026.
- [3] Bureau of Labor Statistics, Consumer Price Index, July 2026, August 12, 2026.
- [4] Bureau of Labor Statistics, Employment Situation, August 2026, September 4, 2026.
- [5] Bureau of Labor Statistics, Job Openings and Labor Turnover, July 2026, September 1, 2026.
- [6] Bureau of Labor Statistics, Productivity and Costs, Second Quarter 2026, September 3, 2026.
- [7] Federal Reserve, FOMC Statement, July 29, 2026.
- [8] Federal Reserve, Minutes of the July 28–29, 2026 FOMC Meeting, August 19, 2026.
- [9] Federal Reserve, H.4.1 Factors Affecting Reserve Balances, September 3, 2026 release.
- [10] Federal Reserve, H.15 Selected Interest Rates, market observations through September 8, 2026.
- [11] Federal Reserve, Senior Loan Officer Opinion Survey, July 2026, August 3, 2026.
- [12] Federal Reserve, Financial Stability Report, May 2026.
- [13] Federal Reserve, Industrial Production and Capacity Utilization, July 2026, August 18, 2026.
- [14] Federal Reserve Bank of New York, Domestic Open Market Operations During 2025, 2026.
- [15] Federal Reserve Bank of New York, Quarterly Report on Household Debt and Credit, Q2 2026, August 2026.
- [16] Federal Reserve Bank of New York, Survey of Consumer Expectations, August 2026, September 2026.
- [17] U.S. Treasury, Monthly Treasury Statement, July 2026, August 2026.
- [18] U.S. Treasury Fiscal Data, Debt to the Penny, September 4, 2026 observation.
- [19] U.S. Treasury Fiscal Data, Interest Expense on the Public Debt, August 31, 2026 observation.
- [20] Census Bureau, New Residential Construction, July 2026, August 2026.
- [21] Census Bureau, New Residential Sales, July 2026, August 2026.
- [22] Census Bureau, Value of Private Construction Put in Place, July 2026, September 1, 2026.
- [23] Census Bureau and Bureau of Economic Analysis, U.S. International Trade in Goods and Services, July 2026, September 3, 2026.
- [24] Freddie Mac, Primary Mortgage Market Survey, September 3, 2026.
- [25] S&P Dow Jones Indices, S&P CoreLogic Case-Shiller Index, June 2026, August 2026.
- [26] Federal Housing Finance Agency, House Price Index, Second Quarter 2026, August 2026.
- [27] U.S. Energy Information Administration, Short-Term Energy Outlook, September 2026, September 9, 2026.
- [28] International Monetary Fund, World Economic Outlook Update, July 2026, July 2026.
- [29] U.S. Treasury, Treasury International Capital Data, June 2026, August 2026.
- [30] World Gold Council, Gold Market Commentary, August 2026, September 9, 2026.
- [31] Federal Reserve, Stablecoins and Global Dollar Intermediation, 2026.
- [32] U.S. Treasury, GENIUS Act Implementation and Permitted Stablecoin Reserves, 2026.
- [33] Pattern Nexus, QT Ends, Liquidity Returns, November 25, 2025.
- [34] Pattern Nexus, The Great Housing Plateau, October 18, 2025.
- [35] Pattern Nexus, The Tokenized Reserve Era, November 8, 2025.
- [36] Pattern Nexus, Fiscal Dominance and the Sticky Term Premium, October 18, 2025.
- [37] Pattern Nexus, The 10-Year Treasury Gravity Zone, November 18, 2025.
- [38] Pattern Nexus, AI Isn’t a Bubble—It’s a Monetary-Industrial Engine, November 3, 2025.
- [39] Pattern Nexus, Macro Archive and Public Record, July 30, 2026.
Editorial note: This article distinguishes current observations, official policy labels, Pattern Nexus interpretation, scenario judgments, and historical PN calls. It is research and educational analysis, not individualized investment advice.
Pattern Nexus analyzes systems upstream of the public narrative: incentives, chokepoints, liquidity, infrastructure, energy, balance sheets, and control structures.
Christopher Grenke / Pattern Nexus Research Desk · September 10, 2026
What's Your Reaction?
 Like
0
Like
0
 Dislike
0
Dislike
0
 Love
0
Love
0
 Funny
0
Funny
0
 Wow
0
Wow
0
 Sad
0
Sad
0
 Angry
0
Angry
0

Nexus (Christopher)
Founder of Pattern Nexus. I research markets, macro, geopolitics, AI, history, ancient systems, and the patterns most people overlook. I’m also building Market Radar, a trading scanner designed to read pressure, risk, confirmation, and setup quality before ch…
Related research

The Yen Line Broke: The Intervention That Changed the Global Liquidity Map
yen-line-broke-us-japan-intervention-global-liquidity-map Meta description: Pattern Nexus reconstructs the yen’s plunge to a 40-year low, …
42 shared topics.
The Oil Inventory War Machine: How Long the Global Buffer Can Hold
A full Pattern Nexus reconstruction of U.S. and global oil inventories from the 1970s through the 2026 war shock, including original regres…
49 shared topics, same research avenue.
Hard Assets Follow Liquidity, Not Inflation? The Full Data Reconstruction — 2026 Update
A 2003–2026 reconstruction of Fed liquidity, gold, housing and NASDAQ data, plus an experimental stablecoin-augmented liquidity index. Met…
46 shared topics, 3 shared assets.
The Sixes Are Never Good: Q3, October Surprises, and the Pattern Window Opening in 2026
The number is not the mechanism. The window is. Across 1976, 1987, 1996, 2006, and 2016, major shocks kept clustering around Q3 and October…
45 shared topics.
The Oil Cushion Is Breaking: Hormuz, Inventories, and the Liquidity Shock Hiding Inside Energy
Oil Crisis, Strait of Hormuz, Hormuz, Energy Shock, Inflation, Brent Crude, WTI Crude, Strategic Petroleum Reserve, SPR, Oil Inventories, G…
86 shared topics, same research avenue.
America’s New Map of Power 2026: Data Centers, Grid Triage, and the Backlash That Will Not Stop the AI Buildout
The AI data center boom has moved from abstract tech hype into physical infrastructure conflict. The map now runs through substations, wate…
45 shared topics, 1 shared asset.
How Severe Is the Commercial Real Estate Downturn Really?
The public CRE index says stabilization. The transaction tape says office fire sales. This Pattern Nexus Premium Research article separates…
41 shared topics.
What If the 6–7% Treasury Yield Trade Is the Trap?
A lot of smart money is starting to position for a 1970s-style inflation repeat where the 10-year Treasury yield spikes toward 6% or 7%. Th…
50 shared topics, 1 shared asset.
Comments (0)
Security Check
Please complete the captcha to verify you are human.