Polar Vortex Watch 2026–27: The Early Organization Signal, Measured
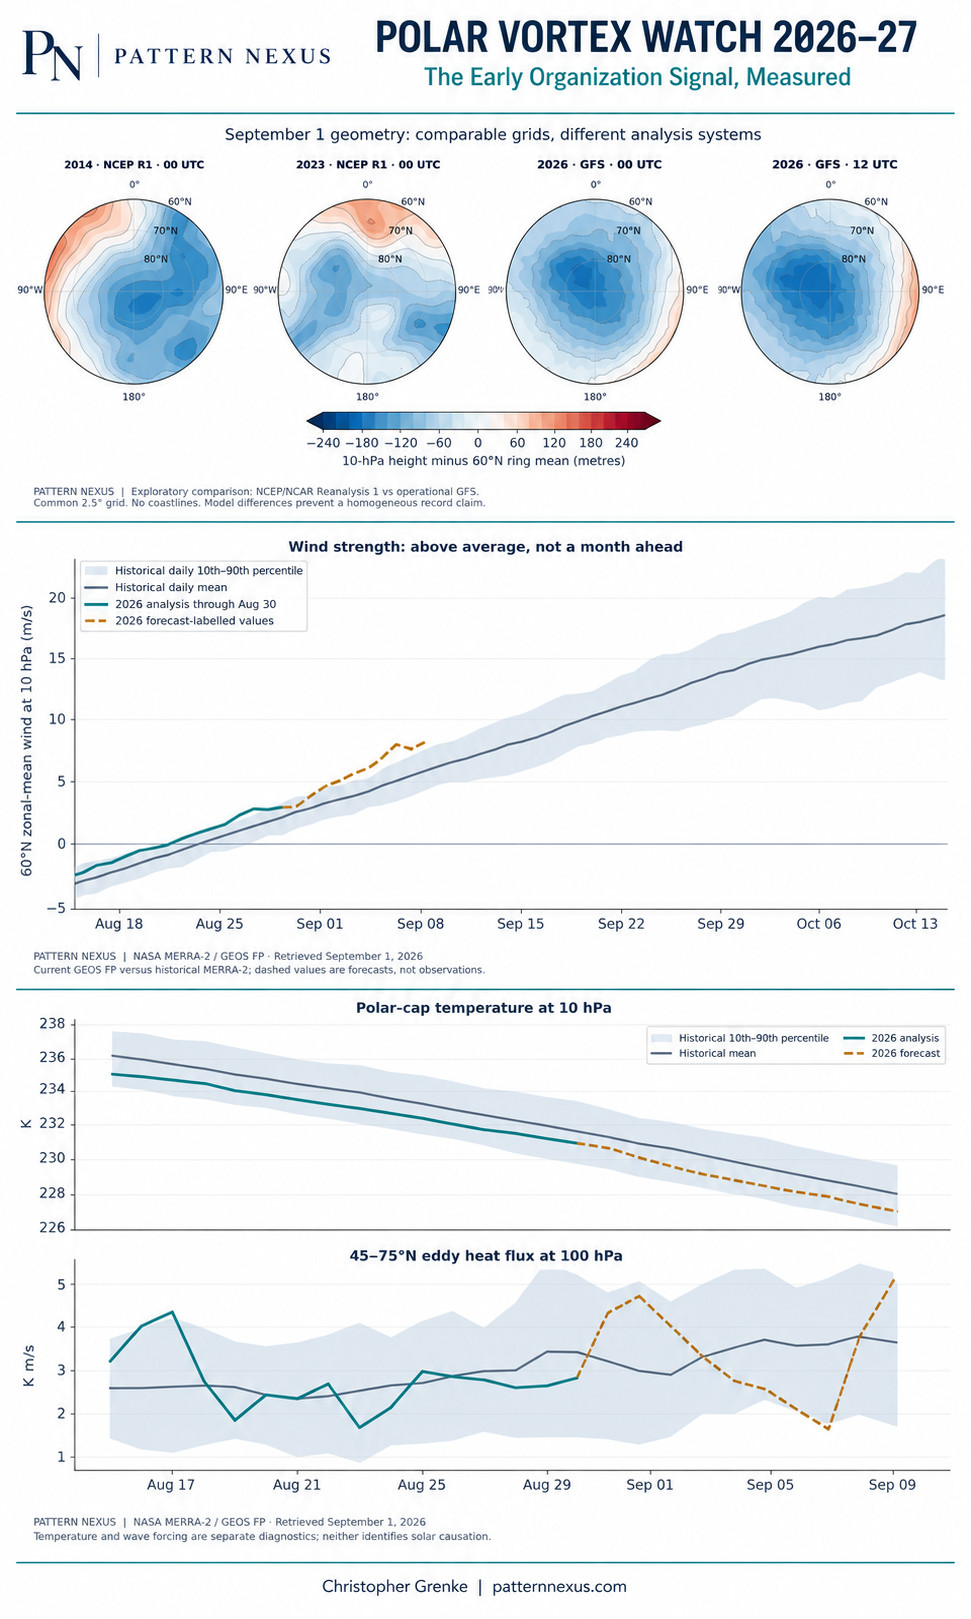
The wind-speed test and the geometry test give different answers. Pattern Nexus compares 48 autumn wind series and 744 historical height fields, then examines solar activity, El Niño/QBO, earthquake counts and the 2014 winter analogue.
 Pattern Nexus Research
Polar Vortex Watch 2026–27: The Early Organization Signal, Measured
The wind-speed test and the geometry test give different answers. A deeper investigation of the Arctic circulation, solar activity, El Niño, earthquakes and the forecasts already on the record.
The structure was the observation. Measuring speed alone would miss the question.
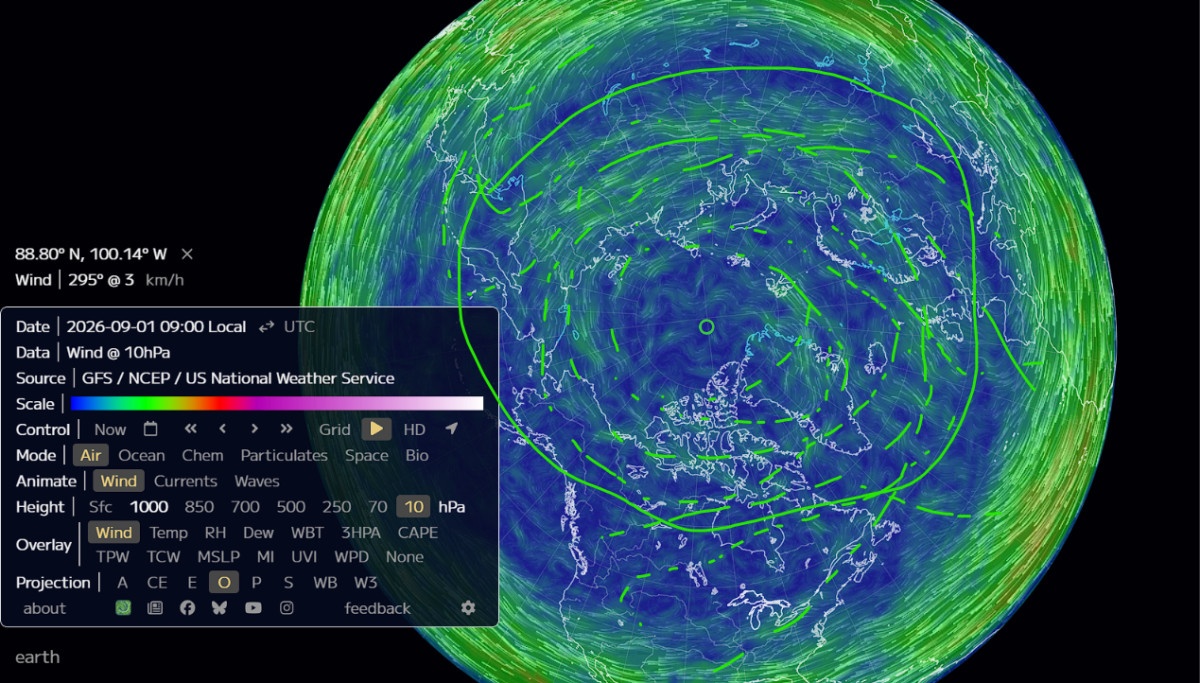
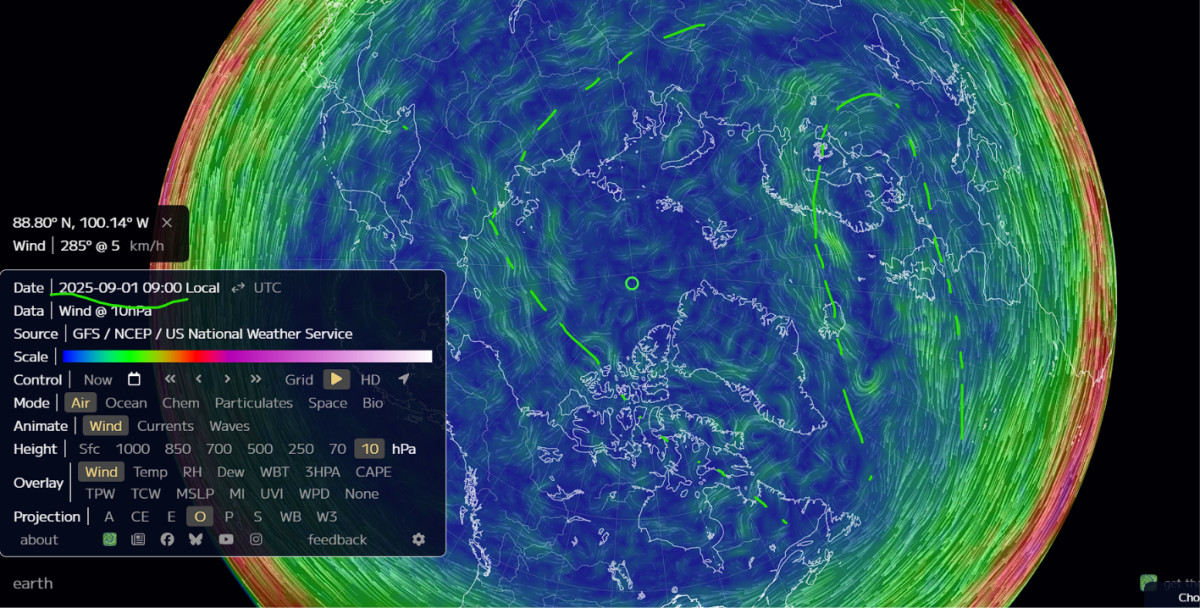
I noticed the Arctic circulation wrapping around the pole in a way that looked unusually organized for late August and September 1. I compared the same date in every year from 2014 through 2025. The important feature was not simply that winds existed. It was the centering and the shape.
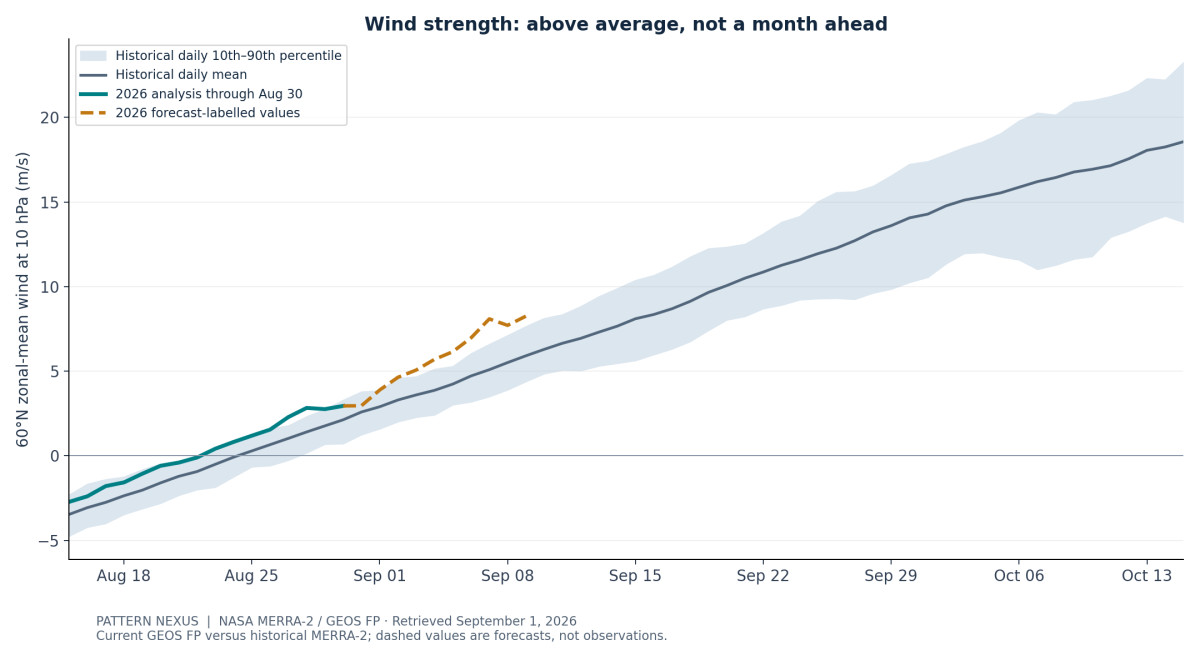
The numerical investigation now gives two distinct results. The conventional 60°N, 10-hPa wind measure shows above-average late-August development, with a small one-day exceedance of the historical maximum on August 28. But sustained westerlies began only about one day ahead of the historical median, and August 30 wind strength corresponds to the long-term average around September 1—not October.
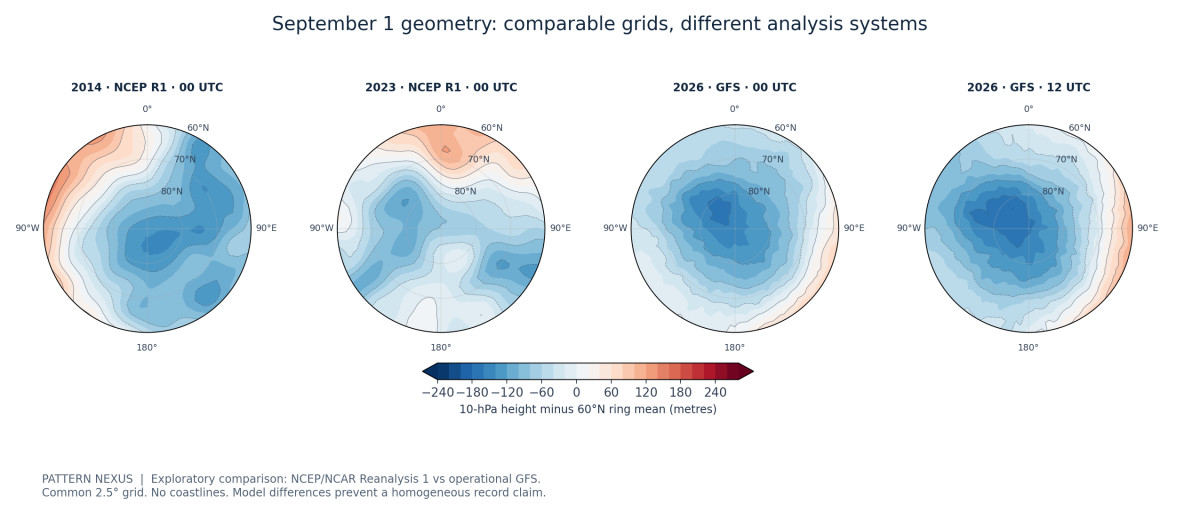
The geometry screen is more interesting. The current GFS height field is markedly more axisymmetric than the twelve historical September 1 fields examined. Searching 744 historical daily fields from August 15 through October 15 finds comparable joint centering and symmetry mostly later in September. For the broad Arctic domain and September 1 noon target, the median first match is September 12. The midnight target gives September 20 among the nine years that match.
Those are exploratory geometry results, not a certified eleven- or nineteen-day developmental lead. The historical fields are NCEP/NCAR reanalysis; the current fields are operational GFS. That mismatch remains a material uncertainty. Still, this is a reason to investigate the structural signal, not dismiss it using a generic statement that the vortex forms every autumn.
The Sun belongs in the investigation. There are researched particle–ozone–circulation pathways, recent geomagnetic disturbances and a changing QBO. El Niño-linked weakening forecasts also exist, but the retrieved forecasts predominantly target midwinter and allow earlier strengthening. Earthquake counts are modestly above recent averages at some magnitude thresholds, not uniformly at every threshold. The result is a connected-system watch with measured branches, not an established single cause.
Numerical sources and reproducible methods are linked below. Analyses, forecasts and mixed-system comparisons are explicitly separated throughout. [1][4][5]
A seasonal calendar does not answer a structural question
When I say the circulation looks early, I am not saying there should be no air moving around the Arctic in September. I am asking whether the arrangement already resembles a more developed stage of the autumn circulation. Those are different questions.
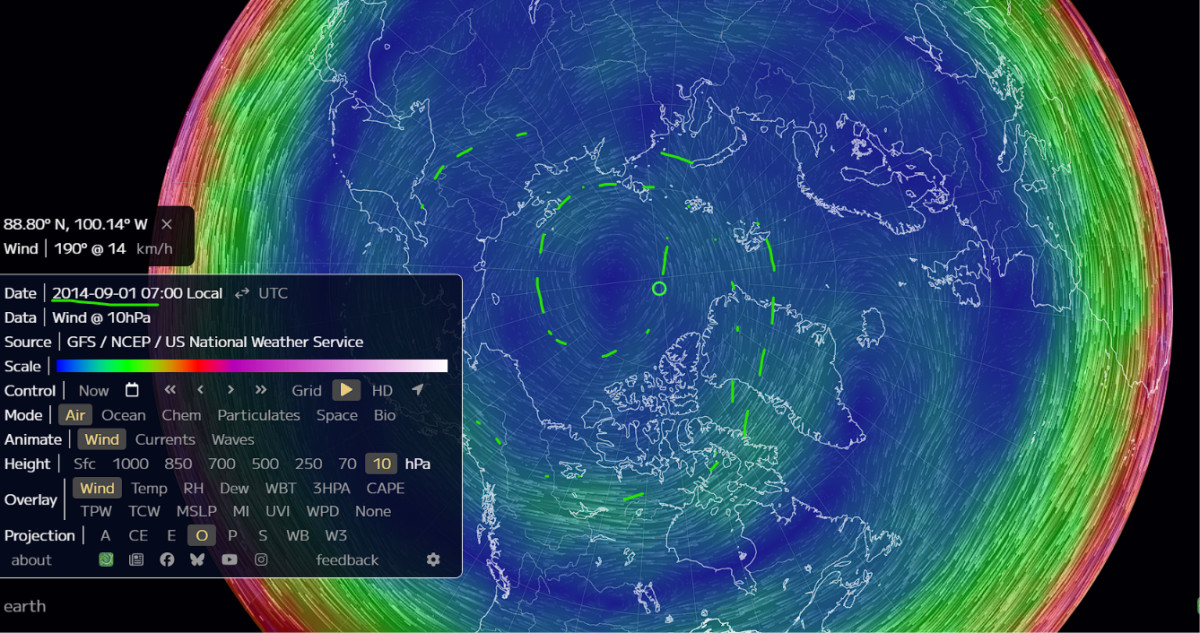
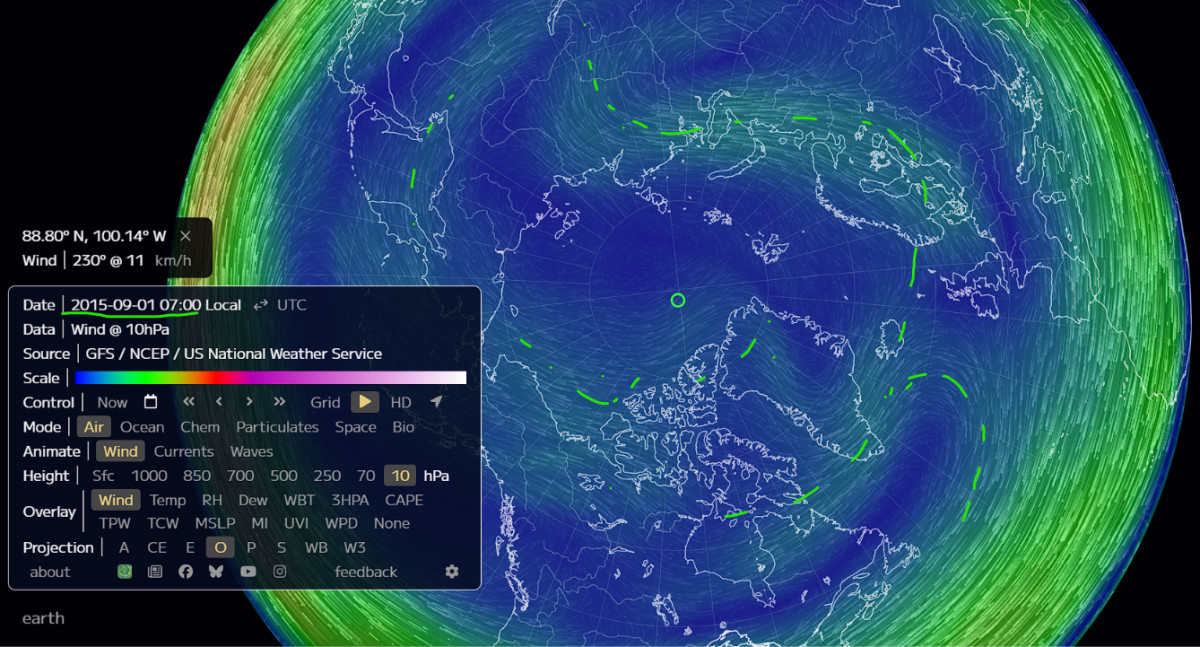
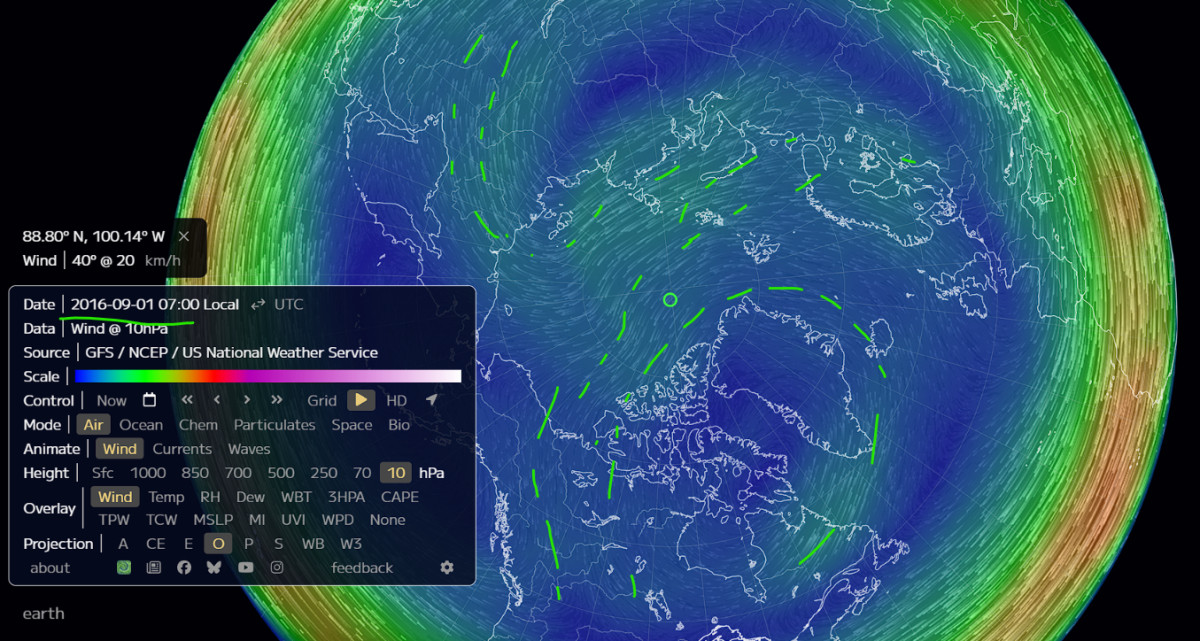
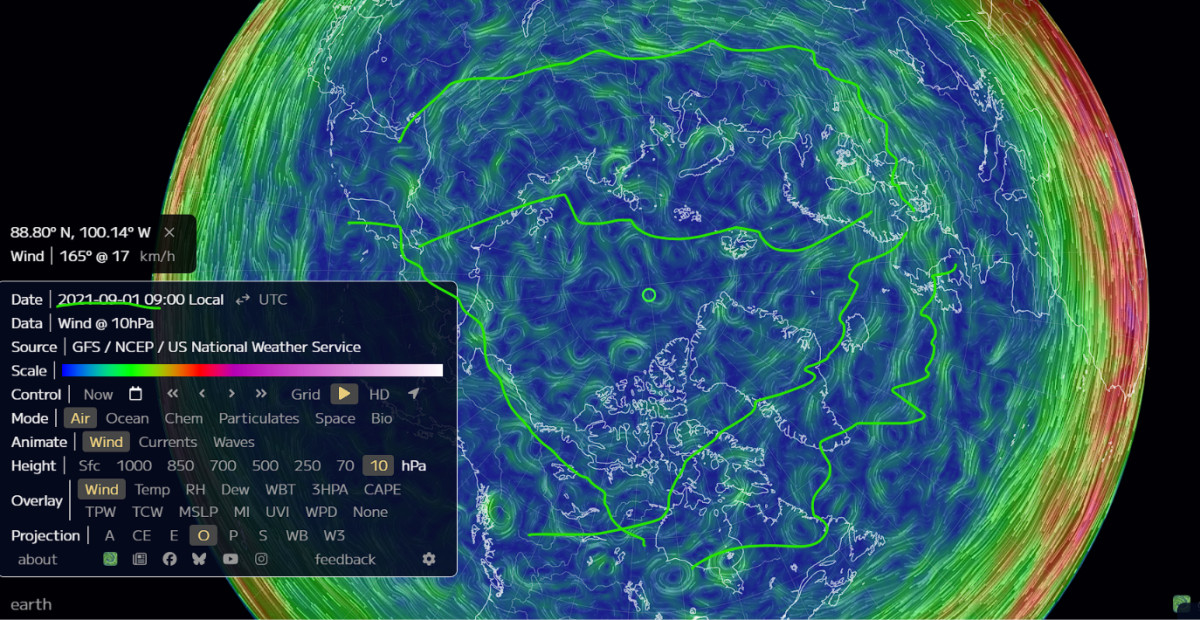
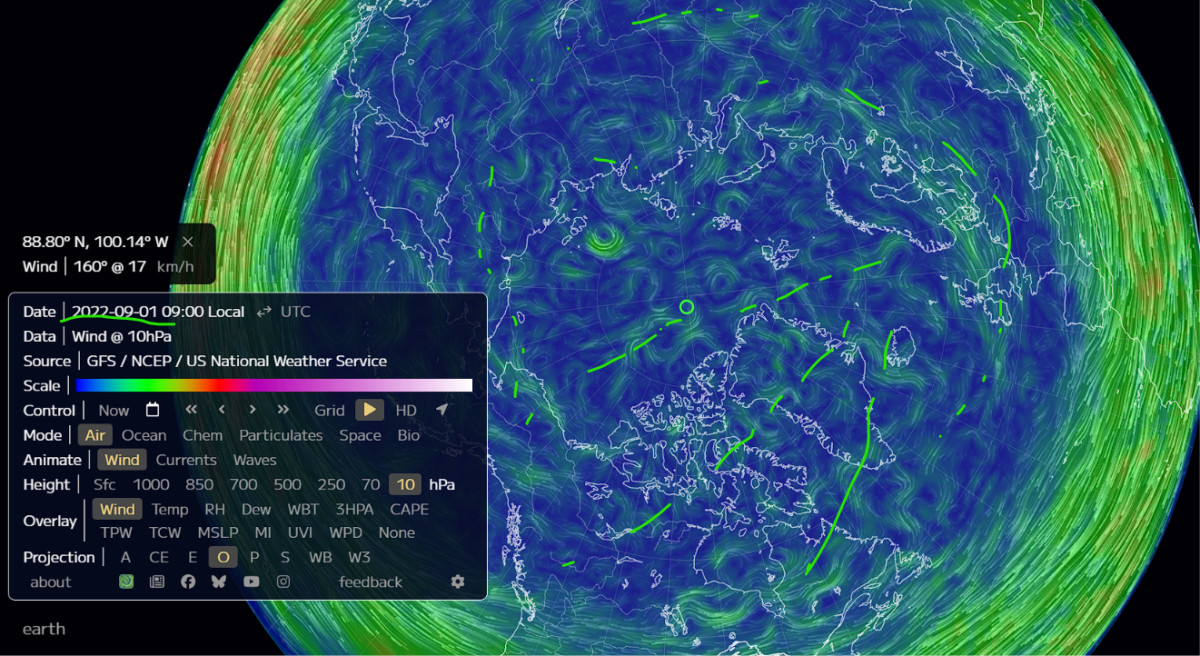
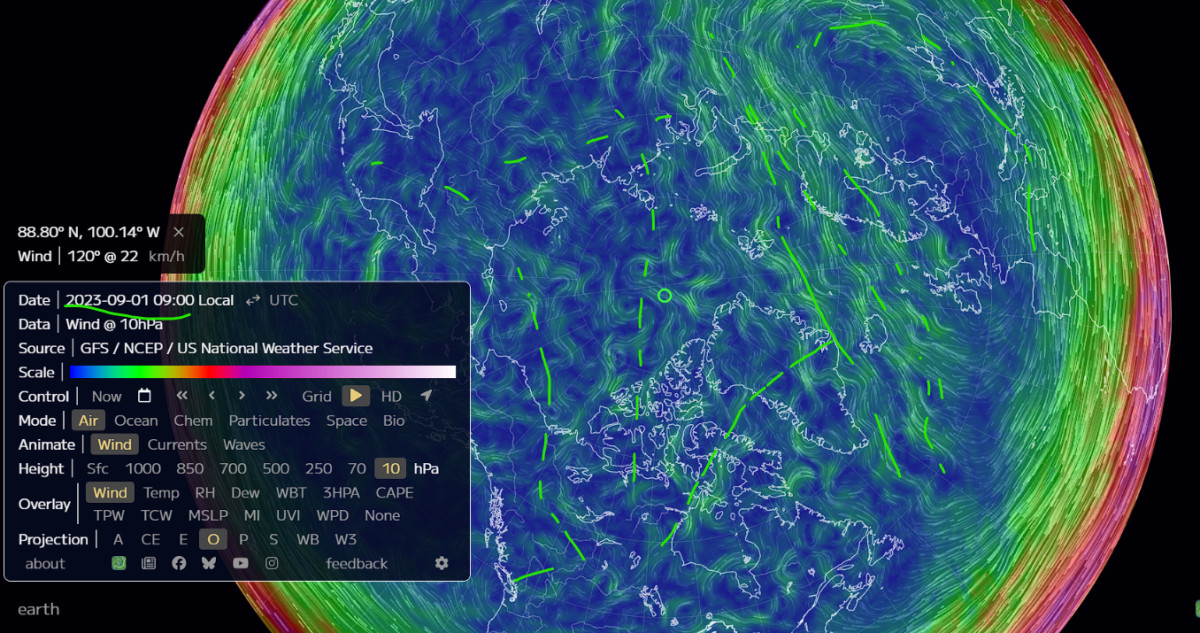
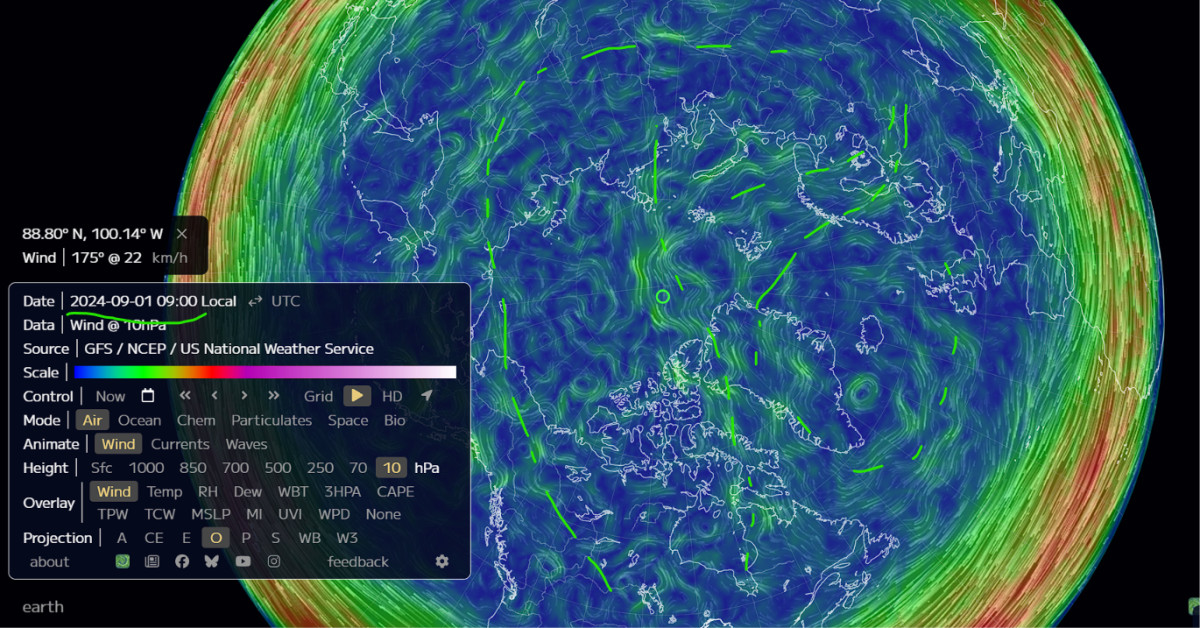
The supplied screenshots all display the 10-hPa wind field from GFS through Earth Nullschool. They span September 1, 2014–2026. The recent frame shows broad, smoother arcs around a weak central region, rather than the more irregular structures visible in many earlier frames. That visual observation was the starting point.
I separated the investigation into three tests: wind strength at a standard latitude and pressure; the seasonal timing of that wind transition; and the geometry of the pressure-height field. A circulation can be rounder without being exceptionally fast. Conversely, a fast circulation can be displaced or distorted. One number cannot stand in for all three.
The screenshots also have comparability limits: displayed local times differ, framing changes, and GFS has undergone upgrades, including the 2019 dynamical-core change and the 2021 increase in vertical resolution. A numerical comparison therefore uses explicit grids and times rather than counting bright pixels or tracing the visible green lines. [7]
Above-average winds are real. A month-long wind lead is not what the numbers show.
NASA publishes daily zonal-mean zonal winds at 60°N and 10 hPa, a conventional stratospheric circulation diagnostic. Positive values indicate westerlies. I retrieved 48 seasonal files, covering the autumns of 1979–2026, and compared 2026 against both 47 earlier years and the same twelve years shown in the screenshot archive. Recent NASA values use GEOS FP until MERRA-2 becomes available; they are not all retrospective reanalysis values. [1][6]
| Date / status | 10-hPa wind (m/s) | 1979–2025 mean | Historical comparison |
|---|---|---|---|
| Aug 23 · analysis | 0.42 | −0.50 | Above 44 of 47 earlier values |
| Aug 28 · analysis | 2.83 | 1.41 | Earlier maximum 2.79; margin only 0.04 |
| Aug 30 · analysis | 2.95 | 2.13 | Above 37 of 47; below 6 of the last 12 |
| Sep 1 · 12-hour forecast | 3.89 | 2.90 | Above 42 of 47; below 2017, 2020 and 2021 |
August 28 deserves attention: 2.83 m/s is above the 2.79 m/s maximum in the earlier date-matched series. The margin is only 0.04 m/s, and current GEOS FP versus historical MERRA-2 is not a perfectly homogeneous comparison. It is a small daily exceedance in the retrieved product, not evidence of an unprecedented mature winter vortex.
By August 30, the value remained above the long-term mean but was below six of the twelve recent comparison years. That tells us why one striking day and one smooth-looking image cannot be converted into a blanket seasonal strength record.
There are also actual September 1 GFS analyses in the gridded retrieval: the regridded 60°N wind averages are 2.89 m/s at 00 UTC, 4.60 m/s at 06 UTC and 3.42 m/s at 12 UTC. These confirm westerly circulation and show variation within the day. They are individual analysis times from a different system, not directly interchangeable with the NASA daily historical values. [5]
The transition date
I defined a simple, reproducible wind transition: the first day after August 1 followed by six more days with positive 60°N, 10-hPa winds. This is not a universal definition of vortex formation; it is a sustained-westerly diagnostic. The 2026 crossing is August 23. The median is August 24 in both the 1979–2025 and 2014–2025 samples. Twelve of the 47 earlier years, and five of the last twelve, crossed on or before August 23.
A second calculation matches the current wind speed to the historical mean seasonal curve. August 30's 2.95 m/s is closest to the mean on September 1, a two-day lead. The forecast-labelled September 1 value is closest to the mean around September 4, a three-day lead. These scalar wind comparisons do not support a month-long advance. They also do not answer whether the shape is ahead.
The original twelve-year comparison, now with numbers
| September 1 | 10-hPa wind (m/s) | Sustained westerlies begin | Following Illinois winter (°F) |
|---|---|---|---|
| 2014 | 3.65 | 08-24 | 26.3 |
| 2015 | 2.78 | 08-20 | 33.9 |
| 2016 | 1.65 | 08-28 | 34.0 |
| 2017 | 3.94 | 08-23 | 28.6 |
| 2018 | 3.69 | 08-21 | 29.7 |
| 2019 | 0.50 | 08-31 | 33.1 |
| 2020 | 4.52 | 08-24 | 27.8 |
| 2021 | 4.48 | 08-24 | 30.1 |
| 2022 | 1.72 | 08-24 | 33.7 |
| 2023 | 2.41 | 08-26 | 35.6 |
| 2024 | 2.53 | 08-22 | 28.8 |
| 2025 | 1.55 | 08-23 | 29.6 |
Historical winds are NASA MERRA-2 daily values; transition dates use the seven-day rule above. Winter temperatures are NOAA's Illinois statewide December–February means for the winter following each autumn. They are regional outcomes, not hemispheric vortex measurements. [1][24]
This is where the original observation becomes more interesting
I retrieved September 1, 00 UTC, 10-hPa geopotential-height fields for 2014–2025 from NCEP/NCAR Reanalysis 1, and current GFS analysis fields for September 1 at 00, 06 and 12 UTC. The current fields were interpolated onto the same 2.5-degree grid used for the historical comparison. These are numerical atmospheric fields, not measurements extracted from screenshots. [4][5]
The first metric locates a height-deficit-weighted center within the Arctic. The second measures what fraction of the height variation is not symmetric around the pole. Smaller center displacement means more pole-centered; a smaller non-zonal fraction means more axisymmetric. I tested domains north of 60°, 65° and 70°N rather than relying on one Arctic boundary.
| Field | Center offset from pole | Non-zonal height variance |
|---|---|---|
| 2014-09-01 00 UTC | 9.28° | 76.9% |
| 2015-09-01 00 UTC | 11.16° | 85.5% |
| 2016-09-01 00 UTC | 12.81° | 98.3% |
| 2017-09-01 00 UTC | 9.19° | 76.6% |
| 2018-09-01 00 UTC | 9.99° | 92.3% |
| 2019-09-01 00 UTC | 16.39° | 85.0% |
| 2020-09-01 00 UTC | 9.26° | 72.4% |
| 2021-09-01 00 UTC | 14.62° | 96.0% |
| 2022-09-01 00 UTC | 14.42° | 99.7% |
| 2023-09-01 00 UTC | 4.74° | 83.6% |
| 2024-09-01 00 UTC | 11.89° | 91.8% |
| 2025-09-01 00 UTC | 11.21° | 82.9% |
| 2026-09-01 00 UTC | 3.96° | 24.5% |
| 2026-09-01 06 UTC | 6.25° | 39.5% |
| 2026-09-01 12 UTC | 6.24° | 43.2% |
The broad-domain non-zonal fraction is 24.5% at midnight, 39.5% at 06 UTC and 43.2% at noon in the current GFS fields. The twelve historical September 1 fields range from 72.4% to 99.7%. The same qualitative contrast persists in the smaller domains. That supports investigating the unusually smooth, pole-centered arrangement you can see in the screenshot.
Centering alone is less unique. The 2023 historical centroid is only 4.74° from the pole, closer than the 2026 noon centroid at 6.24°. Yet the 2023 field is much less axisymmetric by the second metric. A centered average can hide an irregular arrangement. This is why both measurements matter.
These are height-field diagnostics, not a potential-vorticity-edge centroid, and the September circulation is relatively weak. I am using them as a transparent structural screen, not quietly relabeling them as an official vortex-maturity index.
When did earlier autumns first reach comparable centering and symmetry?
The next step was the one the initial article had left undone. I retrieved daily 00 UTC height fields from August 15 through October 15 in every year from 2014 through 2025: 744 fields in total. For each year I found the first field that was at least as centered and at least as axisymmetric as the chosen 2026 field, using both thresholds simultaneously.
For the September 1 noon target and domain north of 60°N, all twelve years matched somewhere in that window. First matches ranged from September 6 to October 5, with a median of September 12—eleven calendar days after September 1. For the more symmetric midnight target, nine years matched, with a median of September 20. The other three did not meet both thresholds by October 15.
| 2026 target time | Domain north of | Matching years / 12 | Median first-match date offset |
|---|---|---|---|
| 00:00 UTC | 60°N | 9 | 19.0 days after Sep 1 |
| 00:00 UTC | 65°N | 4 | 14.5 days after Sep 1 |
| 00:00 UTC | 70°N | 3 | 23.0 days after Sep 1 |
| 06:00 UTC | 60°N | 12 | 13.5 days after Sep 1 |
| 06:00 UTC | 65°N | 9 | 16.0 days after Sep 1 |
| 06:00 UTC | 70°N | 9 | 18.0 days after Sep 1 |
| 12:00 UTC | 60°N | 12 | 11.0 days after Sep 1 |
| 12:00 UTC | 65°N | 9 | 16.0 days after Sep 1 |
| 12:00 UTC | 70°N | 10 | 20.0 days after Sep 1 |
This is a meaningful difference from the wind-speed result. The scalar wind is only a few days ahead of its mean seasonal progression, while the exploratory joint-geometry screen reaches into later September. That is the strongest numerical support found here for the original early-organization observation.
But the table is also a sensitivity test, and it needs to be read in full. Some strict cases match only three or four years; their medians describe that selected subset, not the whole historical population. One smaller-domain comparison finds a qualifying 2023 field on August 18. First threshold crossings are not the same as sustained formation, and the cross-model issue carries through every row.
The supported statement is therefore not “the vortex is exactly a month early.” It is: this mixed-system geometry screen identifies a candidate early-organization signal whose historical equivalents often occur later in September, with substantial dependence on the diagnostic and analysis time. That is now a calculated result with a method and a limitation—not a visual impression dressed up as a statistic.
The circulation is organizing in a cooler-than-average upper polar cap
The latest analysis date shared by the NASA diagnostic files is August 30. Winds are above their historical means at 10, 30, 50 and 100 hPa. The polar-cap temperature at 10 hPa is 0.75 K below the long-period mean. The 100-hPa eddy heat flux is below its date-matched average. [2][3]
| August 30 analysis | Value | Historical mean | Difference |
|---|---|---|---|
| 10-hPa wind · m/s | 2.95 | 2.13 | 0.82 |
| 30-hPa wind · m/s | 3.41 | 2.25 | 1.16 |
| 50-hPa wind · m/s | 5.13 | 3.73 | 1.40 |
| 100-hPa wind · m/s | 8.09 | 7.65 | 0.44 |
| 10-hPa cap temperature · K | 231.07 | 231.82 | -0.75 |
| 100-hPa heat flux · K m/s | 2.95 | 3.51 | -0.56 |
The pattern is consistent with an atmosphere permitting organization: westerlies through multiple levels, a relatively cool upper polar cap and no exceptionally large upward-wave heat-flux value on that date. “Consistent with” is important here. A single day's heat-flux proxy is not the complete wave-momentum budget, and aligned winds do not establish causal downward coupling.
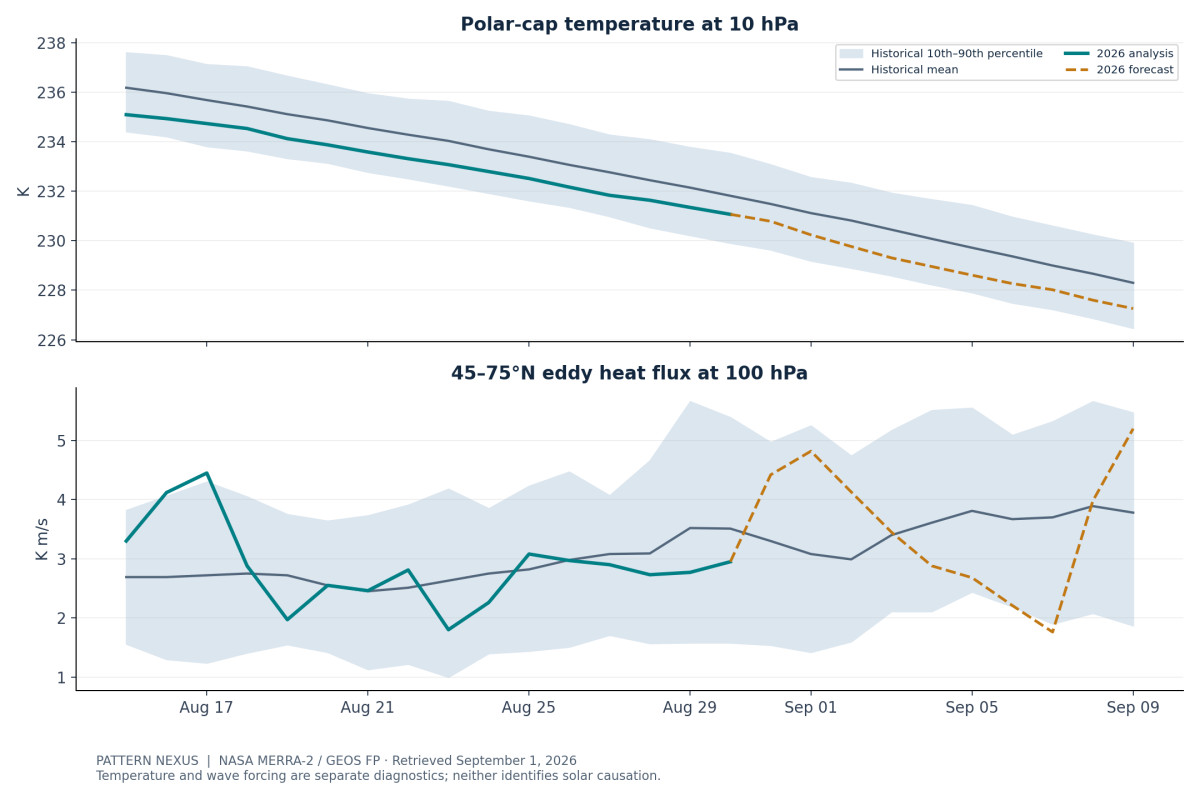
The colder-than-average result also depends on the baseline. It is relative to the long-period climatology, not a claim that 2026 is colder than all recent Septembers. Likewise, “strong for the date” is not “strong by January standards.”
The weak-vortex articles exist. Their time horizons need to stay attached.
There has been public coverage explicitly linking the developing El Niño to a weaker or disrupted vortex. Severe Weather Europe's record-strength El Niño article uses the phrase “weaker from the very start of the season.” Its warning-signs article discusses disruption and possible collapse. The August 26 first winter forecast cites ECMWF and UKMO weakening signals around late December and January. [10][11][12]
Those are real published claims, not something to dismiss because one exact headline could not initially be found. But the retrieved warning-signs and August 26 articles also allow a stronger early circulation before weakening later. I did not verify an article explicitly predicting that no vortex would form at all.
That distinction determines the fair test. September organization would challenge a literal non-formation forecast. It does not yet falsify a late-December or January weakening forecast. Conversely, the existence of a winter weakening forecast cannot be used to declare the present structural signal irrelevant. The current state is evidence the next forecasts must assimilate.
A potentially historic El Niño is not yet a measured record peak
NOAA's August 13 advisory gives a greater than 90% chance of a very strong event and a 69% chance of an October–December event exceeding earlier events since 1950 under its stated three-month relative Niño index criterion. These are forecasts of the coming peak. They are not a completed observation that every historical ENSO measure has already been surpassed. [8]
The QBO is changing with height
The CPC original-data series shows July equatorial winds of +8.52 m/s at 30 hPa, but −6.88 m/s at 50 hPa. The upper level has become westerly while the lower level remains easterly. August is missing in the retrieved monthly files. Calling the whole stratosphere simply “west QBO” loses that vertical transition. These are original wind values, not the standardized indices also included in the files. [9]
El Niño, QBO structure and the seasonal wave environment can produce different responses at different times. NOAA's discussion of the 2015–16 El Niño provides a useful example: an exceptionally strong early-winter vortex preceded a March breakdown. That precedent makes early organization and later weakening physically compatible; it does not prove this winter will repeat it. [32]
A dated forcing sequence is more useful than calling everything heightened
The solar question is not an add-on. It is whether recent forcing from outside the atmosphere could be contributing to the state developing inside it. But there is more than one solar variable: ultraviolet radiation, flares, coronal mass ejections, coronal-hole streams, geomagnetic activity and particle precipitation have different pathways and timing.
The broader August record matters. NOAA's estimated planetary Kp reaches 5.33 on August 18 and 5.00 on August 19. Its daily solar table records M-class flares on August 19–21, before the sustained-westerly crossing on August 23. Later, the weekly summary records seven M-class flares during August 24–30, including M6.9 on August 25, and attributes active geomagnetic conditions on August 28–30 to a coronal-hole high-speed stream. [13][15]
This corrects an overly narrow timeline that would consider only the last stream. The atmosphere was already transitioning before August 28, but there were earlier solar and geomagnetic disturbances worth examining. That creates candidate lag windows; it does not establish their effects.
By NOAA's September 1 12:30 UTC discussion, solar wind was easing toward 400 km/s and geomagnetic conditions were quiet. Geosynchronous high-energy electron flux had been elevated, while high-energy protons were at background. A radiation-belt electron measurement is not itself a measurement of electrons entering the polar atmosphere. [14]
The physical pathway is real research, not a claim that solar wind pushes the vortex into a circle
Salminen and colleagues' 2019 work associated energetic-electron precipitation with nitrogen-oxide and ozone changes and a stronger northern winter vortex, with a QBO-dependent response. That is directly relevant to investigating strengthening rather than assuming all solar activity must disrupt the circulation. The study concerns winter relationships; it does not specifically establish September centering. [16]
A 2025 Nature Communications modeling study found that mesospheric ozone loss can change heating and wind shear, initiating a faster downward dynamical pathway that includes the subtropics. That broadens the mechanisms beyond slow chemical descent inside the vortex. [17]
The response is not one-directional under every setup. Meraner and Schmidt's idealized experiments found warming and weakening from winter stratospheric ozone loss, illustrating why the altitude, season and background state matter. [18]
My connected-system hypothesis is therefore specific: solar-related forcing may alter chemistry and heating in a way that changes the circulation's response to its seasonal and tropical background. The measured early-looking geometry makes that question worth pursuing. It does not identify the Sun as the cause, because this investigation has not measured the event-specific precipitation–ozone–heating chain or separated it statistically from wave forcing and internal variability.
The latest stream also does not quantify an exceptional number of coronal holes. To establish “more coronal holes than usual,” we need a consistent count or area series. To establish geoeffectiveness, the stream and geomagnetic measurements are more informative than the number of visible dark patches alone.
Activity is somewhat elevated at some thresholds—not uniformly across the catalog
I expanded the first earthquake check beyond M6.7. The USGS extraction covers global earthquakes at all depths through August 31, 2026 UTC, and compares like-for-like August and January–August windows against 2014–2025. Counts include aftershocks and use catalog-preferred magnitudes. [21]
| Threshold | Aug 2026 / historical mean | Jan–Aug 2026 / historical mean | Earlier Jan–Aug range |
|---|---|---|---|
| M≥6.0 | 13 / 11.58 | 96 / 89.67 | 65–117 |
| M≥6.7 | 4 / 2.83 | 18 / 18.67 | 11–27 |
| M≥7.0 | 2 / 1.33 | 11 / 9.17 | 3–16 |
This is a more complete answer than saying simply that earthquake activity is normal or heightened. August is above its mean at all three selected thresholds. January–August is above its mean for M6+ and M7+, but slightly below for M6.7+. All three year-to-date counts remain inside the twelve-year historical ranges. These are descriptive comparisons, not significance tests or evidence that events are independent.
The four M6.7+ August events occurred on August 10, 14, 15 and 20. They precede the late-August coronal-hole stream. Earlier forcing remains a separate question, especially given the August 18–19 geomagnetic activity, but selecting a nearby disturbance after seeing the earthquakes is not a validated prediction method.
There is research to examine. Marchitelli and colleagues reported a proton-density/earthquake timing association in a 2020 study and proposed a possible perturbation of already stressed faults. Love and Thomas found no consistent significant triggering relationship using other solar and geomagnetic predictors. The predictors and methods differ, so this is a contested literature rather than a settled common mechanism. [19][20]
The seismic question stays in the system map. It does not receive the same confidence as solar-wind interaction with Earth's magnetic environment. A proper next test would specify the forcing variable and lag before evaluation, remove or model aftershock clustering, and test later data that were not used to select the relationship.
The winter point was worth checking, not brushing aside
There are two nearby winters to distinguish. Chicago's December–February 2013–14 season ranked third coldest and third snowiest in the NWS report. That winter occurred before the September 2014 screenshot. The winter following that screenshot, 2014–15, was also colder than normal regionally, and February 2015 tied for Chicago's coldest February in the cited NWS summary. [22][23]
So the date distinction does not erase the severe-weather point. The following winter genuinely deserves consideration. NOAA's statewide series puts Illinois at 26.3°F for December 2014–February 2015, the coldest following-winter mean in this particular twelve-year comparison. [24]
I also checked whether the September 1 measurements tracked the following Illinois winter across all twelve years, rather than choosing one memorable case. The exploratory rank correlations are shown below. This is a small regional screen, not a calibrated winter forecast.
| September 1 predictor | Spearman correlation with following Illinois winter temperature | Unadjusted p | Three-test corrected p |
|---|---|---|---|
| 60°N / 10-hPa wind | -0.51 | 0.090 | 0.270 |
| Height-center offset from pole | 0.28 | 0.379 | 1.000 |
| Non-zonal height-variance fraction | 0.61 | 0.036 | 0.107 |
The symmetry relationship is worth retaining: the rank correlation is +0.61 between the non-zonal fraction and the following winter temperature. In this sample, lower non-zonal fractions—more symmetric fields—tend to precede colder Illinois winters. The unadjusted p-value is 0.036; correcting for the three relationships checked raises it to 0.107. The wind-strength association points toward colder winters too, but its unadjusted p-value is 0.090. These are exploratory findings, not a validated forecast rule.
This means the winter-analogue question was worth testing. It also means twelve observations cannot establish reliable forecast skill. A useful analogue must match more than one attractive feature: tropical conditions, QBO structure, ocean patterns, wave forcing and the subsequent evolution matter. The regional result does not establish where cold air will be delivered across the hemisphere, and it does not validate solar causation.
This continues the work, with a better measurement layer
The December 2025 polar-vortex deformation report and Polar Vortex Watch, Part II followed changing geometry and the question of downstream cold delivery. The January circulation, natural-gas and ERCOT report carried that framework into energy-system constraints. [26][27][28]
The broader climate-as-circulation article put solar and stratospheric influences inside the larger system. That is the appropriate conceptual starting point here: not one isolated variable, but interacting processes with different response times. [25]
The August solar-cycle and financial-turning-points study and The Sun, Money and the Global Core: What Survived a 375-Year Test belong in the research trail as well. Those studies asked different questions and operated on different timescales. Their financial tests are not atmospheric evidence, but their emphasis on defining the system and testing timing rather than assuming it carries forward. [29][30]
The earlier geomagnetic-storm and power-grid report adds another distinct route by which solar conditions can matter to infrastructure. Direct geomagnetic exposure and weather-driven demand should be considered separately before examining whether they overlap. [31]
The difference this time is the stage of the cycle. Last winter's watch asked how an established circulation was deforming. This watch asks whether organization is emerging early, how to measure it, and what influences might be contributing.
The geometry is the stronger signal. Its cause and winter consequences remain open.
The investigation does not reduce to “nothing unusual” or “everything is connected, therefore the explanation is settled.” It finds a narrower and more useful result: above-average early-season winds, a much more pronounced geometry contrast in an exploratory cross-system comparison, and candidate solar and atmospheric influences that need different tests.
The immediate working interpretation is that the Arctic circulation has acquired a relatively organized pressure-height structure without a comparably exceptional lead in conventional wind strength. Modestly lower heat flux and cooler upper-polar temperatures are compatible with that organization. El Niño and the descending QBO transition remain relevant to how the circulation evolves later, while solar-related chemistry and dynamics remain a physically motivated upstream hypothesis.
I would strengthen the early-organization conclusion if the same geometry persists in consecutive analyses and survives a homogeneous reanalysis comparison. I would weaken it if the contrast is largely a model-system offset, if the symmetry disappears quickly, or if a potential-vorticity-based diagnostic shows a different story.
The winter forecasts now have a clear test: do their projected December–January wind reductions occur, and do they produce displacement, disruption or surface coupling? September organization neither guarantees nor prevents those later developments. For energy and infrastructure, the actionable exposure comes when the evolving circulation supports a regional demand event—not merely when an upper-air map becomes circular.
The original screenshot archive
The twelve prior September 1 screenshots below are preserved unchanged. The 2026 image appears near the beginning. The numerical geometry plots elsewhere are independently generated from downloaded height fields, not reconstructions of these screenshots.
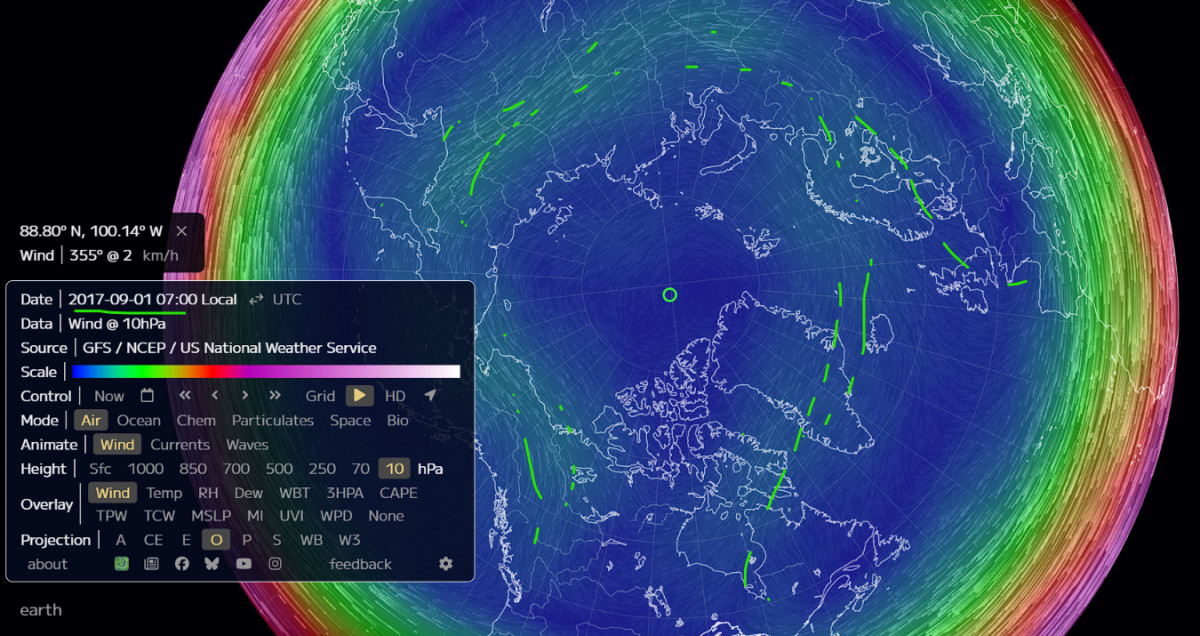
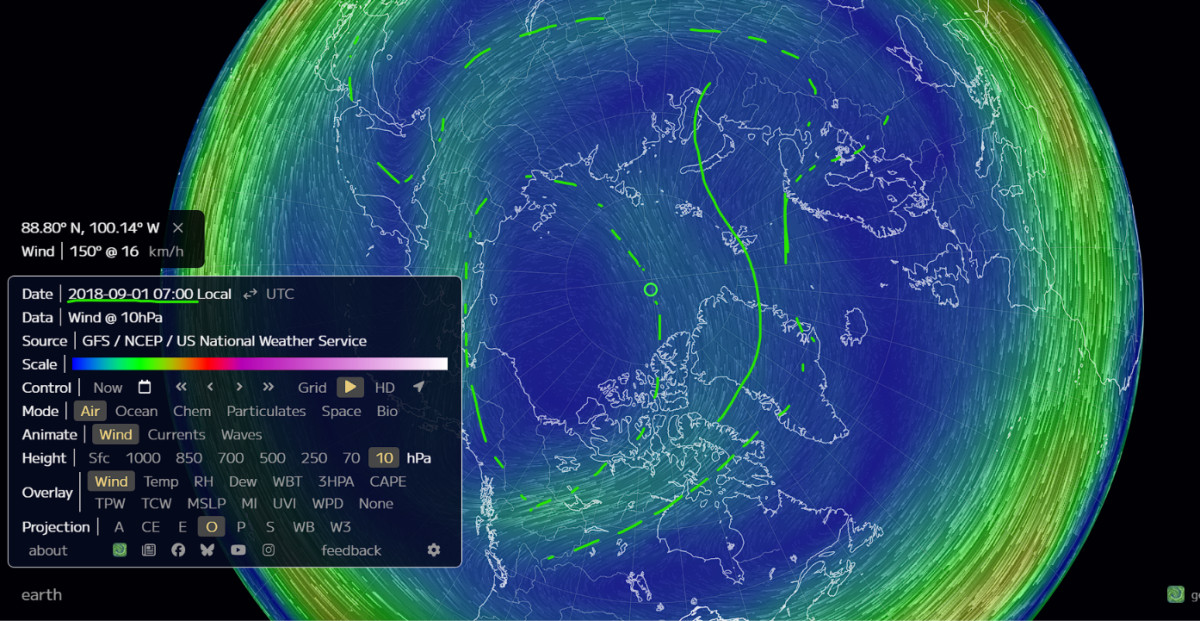
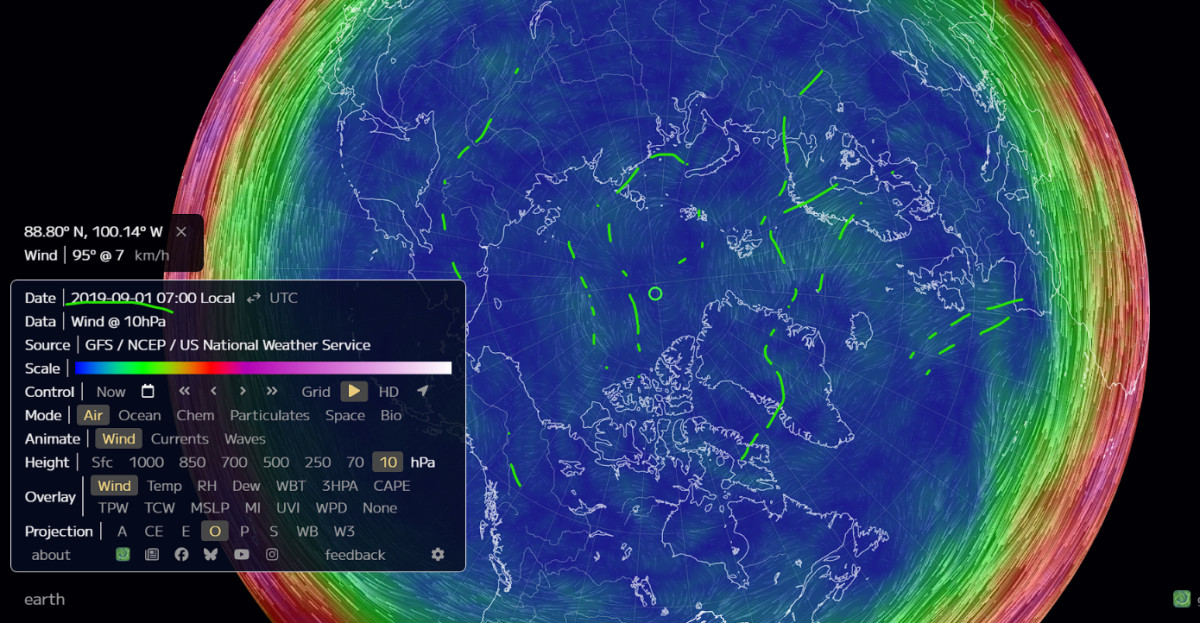
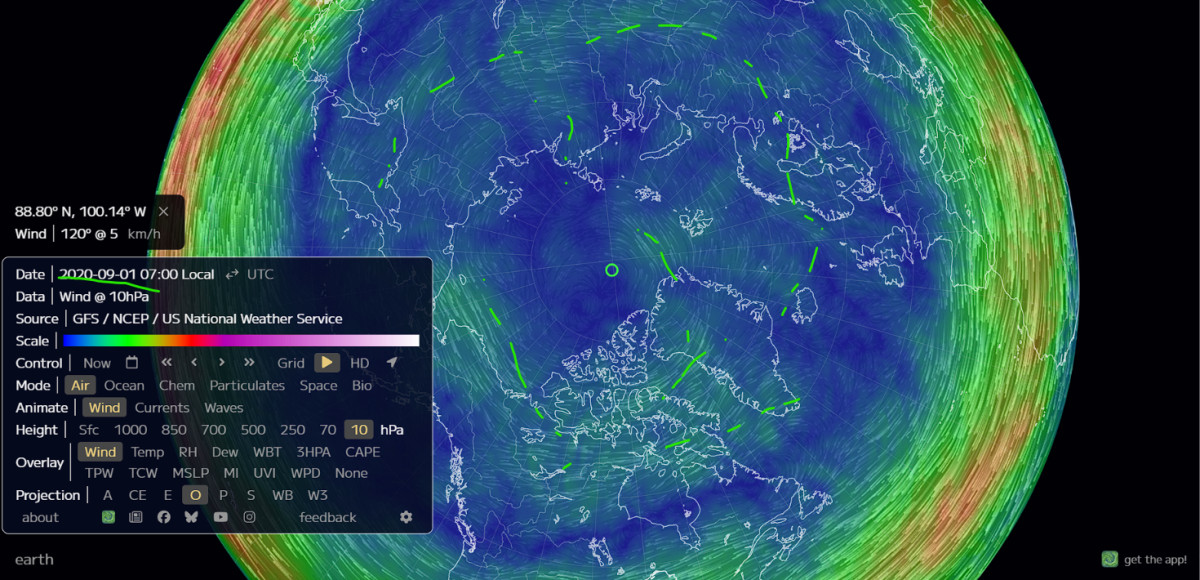
Methods, scope and reproducibility
The package includes all retrieved NASA text files, selected NOAA gridded fields, solar and geomagnetic products, the USGS catalog extracts, Illinois winter-temperature data, calculation scripts and machine-readable results. The numerical investigation is reproducible from those snapshots; later live-source revisions may change a rerun.
- Wind baseline: 47 autumns, 1979–2025, plus a 2014–2025 subset. Historical files without a forecast column are retrospective data. Current forecast flags are retained; missing values are excluded.
- Wind transition: seven consecutive positive daily 60°N/10-hPa values beginning no earlier than August 1. This diagnostic is not a formal complete-vortex identification.
- Wind-equivalent date: nearest historical mean seasonal wind between August 1 and October 31. It is a scalar match, not a complete-state analogue.
- Geometry: 10-hPa geopotential height on a common 2.5° latitude–longitude grid. Positive height deficits relative to the domain-edge zonal mean weight a spherical centroid. Cosine-latitude weights approximate cell area. The non-zonal fraction is longitudinal-departure variance divided by total cap-height variance.
- Geometry timing: 62 daily 00 UTC fields per year from August 15 to October 15, 2014–2025. The first day satisfying both current geometry thresholds is retained. Three current times and three latitude domains are reported; unmatched years remain unmatched rather than being assigned October 16.
- System mismatch: the historical geometry is NCEP/NCAR Reanalysis 1; the current geometry is GFS. Available current-year NCEP reanalysis endpoints did not extend to this event. No homogeneous historical-record claim is made. The noon and 06 UTC sensitivity targets also differ from the historical 00 UTC sampling time.
- Earthquakes: global catalog-preferred magnitudes at M6.0, M6.7 and M7.0; all depths; no declustering. January–August and August are compared with the same windows in earlier years.
- Winter association: twelve autumn-to-following-winter pairs, Illinois statewide December–February temperature, three exploratory Spearman correlations. No out-of-sample forecast skill is established.
The solar section is an event-timeline and mechanism investigation, not a completed multivariate attribution model. No regression coefficient, causal probability or solar effect size has been invented to fill that gap.
Frequently asked questions
Is the polar vortex forming a month early?
The wind-transition test says about one day ahead of the historical median, while the exploratory geometry test often finds comparable states later in September. An exact month-long developmental lead is not established.
Is it stronger than in all twelve earlier years?
Not by the standard wind diagnostic. August 28 narrowly exceeds the retrieved earlier same-date values, but August 30 and the September 1 forecast do not. Geometry gives a different, more pronounced contrast.
Does El Niño prevent formation?
The retrieved forecasts concern weakening or disruption, principally later in winter, and allow stronger early circulation. A literal no-formation forecast was not verified.
Does the geometry prove a solar cause?
No. It identifies a candidate atmospheric signal. The solar timeline and published mechanisms justify investigation, but event-specific chemistry and attribution remain unmeasured.
Were the earlier winter observations wrong?
No. Both Chicago's 2013–14 winter and the following 2014–15 winter had notable cold, but they must be matched to the correct autumn and region.
What would make the strongest follow-up?
Persistence of the structural signal, a same-system historical comparison, a potential-vorticity-based geometry diagnostic, and dated particle/ozone observations aligned with the circulation changes.
Sources and prior Pattern Nexus work
Data and source cutoff: September 1, 2026. Rolling products are archived in the accompanying evidence files. Calculated comparisons are PN research results, not rankings published by the data providers. Prior PN links document the research trail; not every older page could be freshly reopened.
- NASA Ozone Watch wind archive; 2026 60°N/10-hPa daily data. Earlier annual files and exact URLs accompany atmosphere_check.py.
- NASA Ozone Watch temperature diagnostics.
- NASA Ozone Watch eddy heat-flux diagnostics.
- NOAA PSL NCEP/NCAR Reanalysis 1 pressure-level geopotential height. Exact 2014–2025 spatial/time-subset URLs are preserved in the geometry result files.
- NOAA NOMADS GFS analyses. September 1, 2026, 00/06/12 UTC, 10 hPa, analysis step zero. Exact subset URLs and GRIB2 bytes accompany geometry_check.py.
- NASA Ozone Watch plot and data documentation; source descriptions on individual diagnostic pages explain MERRA-2 and GEOS FP supplementation.
- NOAA/NCEP GFS implementation history.
- NOAA CPC ENSO Diagnostic Discussion, August 13, 2026 edition retrieved for this report.
- NOAA CPC QBO original-data files: 30 hPa and 50 hPa.
- Severe Weather Europe — Super El Niño Forecast Pushes Toward Record Strength as Winter 2026/2027 Signals Emerge.
- Severe Weather Europe — Polar Vortex Warning Signs Emerge for Winter 2026/2027 as Super El Niño Builds.
- Severe Weather Europe — Winter 2026/2027 First Forecast, August 26, 2026.
- NOAA SWPC weekly highlights, August 31, 2026 edition; archived copy included.
- NOAA SWPC forecast discussion, September 1, 2026, 12:30 UTC edition; archived copy included.
- NOAA SWPC daily geomagnetic indices and daily solar indices; September 1 retrievals. Estimated planetary Kp is distinguished from final indices.
- Salminen et al. — Effect of Energetic Electron Precipitation on the Northern Polar Vortex, 2019.
- Seppälä et al. — Polar mesospheric ozone loss initiates downward coupling of solar signal in the Northern Hemisphere, 2025.
- Meraner and Schmidt — Climate impact of idealized winter polar mesospheric and stratospheric ozone losses as caused by energetic particle precipitation, 2018.
- Marchitelli et al. — On the correlation between solar activity and large earthquakes worldwide, 2020.
- Love and Thomas — Insignificant solar-terrestrial triggering of earthquakes, 2013.
- USGS earthquake catalog API; raw M6+ and M6.7+ queries and count calculations are included in the package.
- NWS Chicago — Winter 2013–14 ranked as third coldest winter for Chicago.
- NWS Chicago — Winter and February 2015 Climate Summary.
- NOAA NCEI — Illinois December–February average temperature, 2015–2026; raw response included.
- Pattern Nexus — Earth's Climate Is a Control System, Not a Thermostat, December 2025.
- Pattern Nexus — Polar Vortex Deformation, December 2025.
- Pattern Nexus — Polar Vortex Watch, Part II, December 2025.
- Pattern Nexus — Polar Vortex Now: NatGas and ERCOT Night-Ramp Stress Test, January 2026; retained from the recovered article record.
- Pattern Nexus — Solar Cycles, Liquidity, and Financial Turning Points, August 2026; accessible language route used.
- Pattern Nexus — The Sun, Money and the Global Core: What Survived a 375-Year Test, August 17, 2026; canonical URL recovered from the original article file.
- Pattern Nexus — geomagnetic-storm and power-grid research, November 2025.
- NOAA Climate.gov — El Niño and the stratospheric polar vortex, including the 2015–16 example.
คุณมีปฏิกิริยาอย่างไร?
 ชอบ
0
ชอบ
0
 ไม่ชอบ
0
ไม่ชอบ
0
 รัก
0
รัก
0
 ตลก
0
ตลก
0
 ว้าว
0
ว้าว
0
 เศร้า
0
เศร้า
0
 โกรธ
0
โกรธ
0

Founder of Pattern Nexus. I research markets, macro, geopolitics, AI, history, ancient systems, and the patterns most people overlook. I’m also building Market Radar, a trading scanner designed to read pressure, risk, confirmation, and setup quality before chasing a move. Pattern Nexus is where I connect the dots between data, history, technology, and the bigger system playing out around us.













ความคิดเห็น (0)