
Interest Rates, Recession, and the Current Environment
A Pattern Nexus deep research analysis on interest rates, recession risk, energy-led inflation, commercial real estate stress, private credit, AI labor pressure, and why the current environment feels like 2006 without being a direct replay of 2008.

Quick read
The current U.S. macro environment is not a clean boom, and it is not yet a confirmed recession. It is a late-cycle economy that still shows positive aggregate growth while the internal refinancing math keeps getting worse. That is the point. The danger is not that the headline data already screams collapse. The danger is that the headline data still looks survivable while the weaker layers of the credit system are already repricing.
As of early May 2026, the Federal Reserve’s target range for the federal funds rate is 3.50% to 3.75%. The 10-year Treasury yield is around 4.43% to 4.45%, the 2-year is about 3.93%, the 10-year minus 2-year curve is positive by roughly 50 basis points, the 10-year breakeven inflation rate is about 2.47%, and the average 30-year fixed mortgage rate is 6.30%. Even after rate cuts, the long end is still expensive.[1][2][3][4]
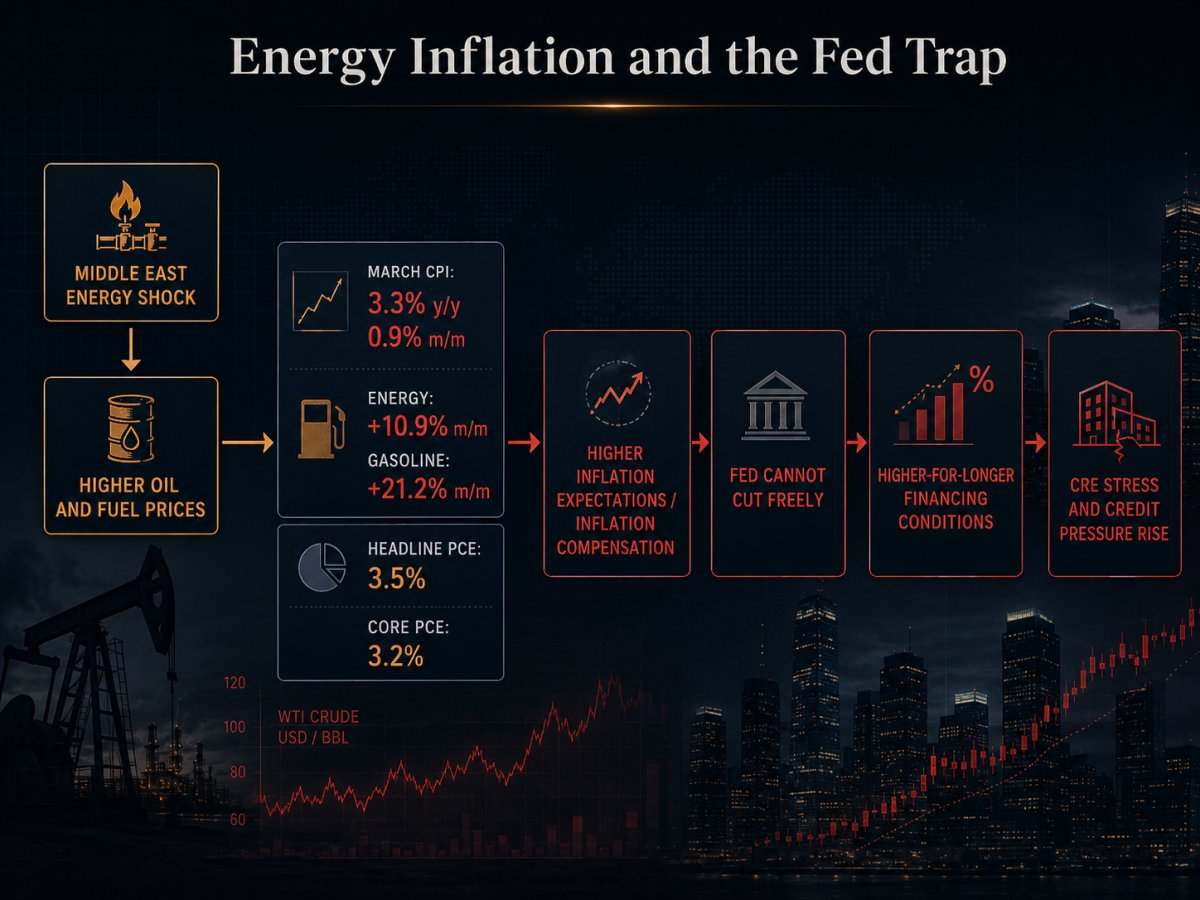
The latest inflation acceleration was heavily energy-led. March CPI rose 0.9% month over month and 3.3% year over year. Energy rose 10.9% in the month, gasoline rose 21.2%, and gasoline alone accounted for nearly three-quarters of the monthly CPI increase. That is not a normal slowdown backdrop. It is a supply-side energy shock layered on top of still-sticky core inflation, while commercial real estate and private credit are already under visible pressure.[8]
The missing bridge is now the real-economy layer. Household debt has climbed, credit-card and auto balances are large, small-business optimism has fallen back below its long-run average, capital-outlay plans have weakened, and bankruptcy filings are rising again. That does not prove a recession is already here. It shows that the pressure is moving beyond abstract market plumbing and into the balance sheets that actually hire, borrow, refinance, and fail.[31][32][33][34][35]
The long end is the trap
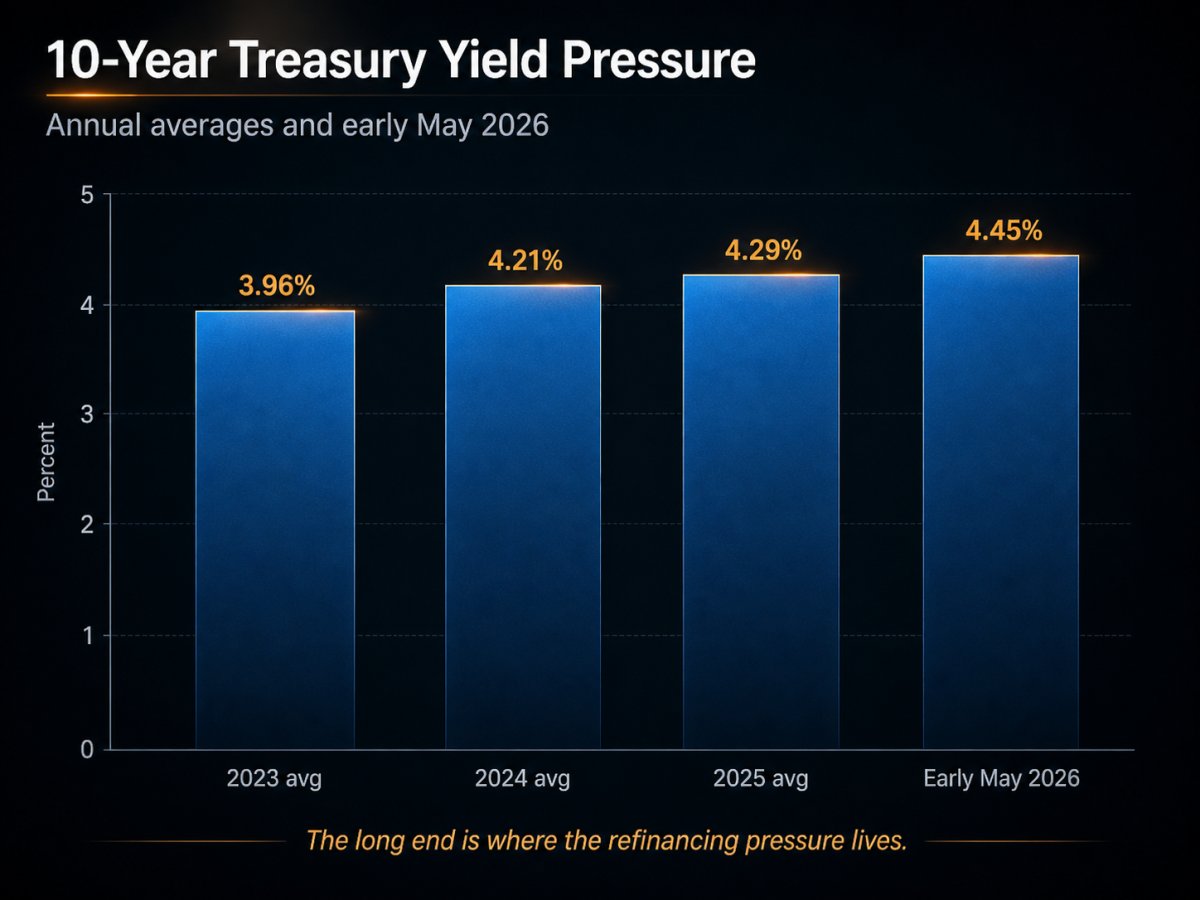
The Fed funds rate matters, but the economy refinances off the term structure. A mid-4% 10-year keeps mortgages, CRE, cap rates, loan proceeds, and long-duration assets under pressure.
Energy changes the policy math
Energy-led inflation acts like a tax on the economy while also limiting the Fed’s ability to cut aggressively into credit stress.
Office CRE is not theoretical
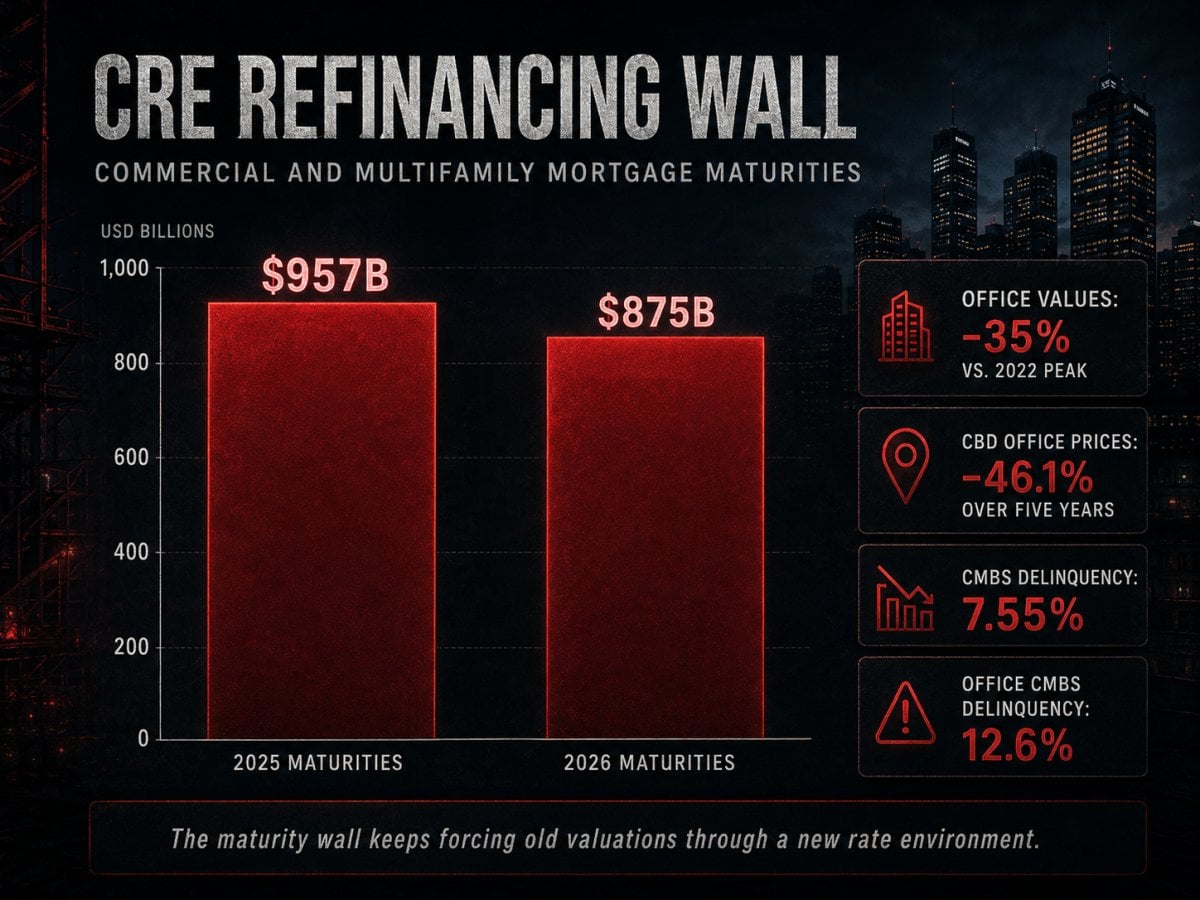
Office values are already down sharply, CMBS delinquency is elevated, and the maturity wall keeps forcing old valuations through a new rate environment.
Private credit is the transmission map
Private credit is not automatically a systemic crisis, but bank commitments, NDFI lending, liquidity needs, and default risk show how stress could move through the plumbing.
Consumer stress is the bridge
Credit cards, auto loans, debt-service costs, and small-business pullbacks show how financial stress moves out of Wall Street and into the real economy.
Bankruptcy is confirmation
Rising bankruptcy filings do not prove recession by themselves, but they show that weak borrowers and thin-margin businesses are already running into the wall.
Executive summary
The cleanest way to frame the current United States macro environment is this: the economy is still expanding, but it is expanding under the wrong mix of conditions. Long-term rates are still high, inflation has re-accelerated through the energy channel, job growth has slowed, and the most rate-sensitive corners of the credit system—especially office commercial real estate and parts of nonbank credit—are already under visible stress. That is why the “this feels like 2006” analogy resonates. The resemblance is not that today is a carbon copy of the housing bubble era. The resemblance is that the headline economy still looks survivable while the refinancing math underneath it is getting worse.
On inflation and growth, the picture is conflicted. The latest available data show March CPI up 3.3% year over year, core CPI up 2.6%, headline PCE up 3.5%, and core PCE up 3.2%. March payrolls rose by 178,000, unemployment was 4.3%, and real GDP grew at a 2.0% annual rate in the first quarter. The Federal Reserve Bank of Atlanta’s GDPNow estimate for the second quarter was 3.7% as of May 5. That is not a recessionary snapshot. But it is also not a clean disinflationary expansion. It is an economy with positive aggregate growth and worsening internal strain.[8][6][7][5][9]
One important correction matters. The current policy debate is not a live “should the Fed hike right now?” fight. At its April 29 meeting, the Fed held rates steady; one voter preferred a cut, and three dissented because they did not want the statement to retain an easing bias. No one voted to raise rates. So the real policy trap is not an active new tightening campaign. It is that the central bank cannot cut freely into a renewed inflation impulse, while higher-for-longer financing conditions keep squeezing refinancing-heavy sectors.[1]
My core view is simple: this is not boom town, and it is not yet a confirmed recession. It is a late-cycle pressure map. The public sees GDP. The system sees maturities. The public sees rate-cut headlines. The system sees the 10-year. The public sees a labor market that has not broken. The system sees credit stress, lower asset marks, shrinking small-business confidence, higher bankruptcy pressure, and a refinancing wall moving through commercial property and nonbank credit. That is why the macro surface can look calm while the lower layers are already moving.
The rate structure that matters
The first macro fact that matters is the long end. The 10-year Treasury did not average above 4% in 2023, but it came very close at 3.96%. It then averaged 4.21% in 2024 and 4.29% in 2025. By early May 2026 it was back near 4.45%. Combined with a 10-year breakeven near 2.47%, that implies a roughly 2% real long rate—still restrictive for real estate, mortgages, and long-duration assets.[2][3]
That matters because the economy does not refinance off the federal funds rate alone. It refinances off the term structure, and the term structure remains expensive. The Fed can lower the policy rate from prior peaks and still leave the economy facing tight financial conditions where the real decisions happen: mortgages, commercial real estate debt, project financing, cap-rate math, acquisition financing, private credit, corporate refinancing, and anything valued off long-duration cash flows.
The connection between long rates and rate-sensitive sectors is direct. Freddie Mac shows the average 30-year fixed mortgage rate at 6.30%. Green Street’s property commentary explicitly said elevated Treasury yields were keeping property pricing in check. In other words, even though the Fed has brought the policy rate down from its prior highs, the economy still feels tight where it counts: housing affordability, cap-rate math, loan proceeds, and refinancing capacity.[4][15]
| Indicator | Latest reading used here | Pattern Nexus read |
|---|---|---|
| Federal funds target range | 3.50% to 3.75% | The policy rate is below prior highs, but the Fed is constrained by renewed inflation pressure. |
| 10-year Treasury yield | About 4.43% to 4.45% | The long end remains high enough to pressure mortgages, CRE, and long-duration assets. |
| 2-year Treasury yield | About 3.93% | The front end reflects that cuts are not automatic while inflation remains elevated. |
| 10-year minus 2-year spread | Positive by roughly 50 basis points | The curve has re-steepened, but that does not erase localized credit stress. |
| 10-year breakeven inflation rate | About 2.47% | Inflation expectations are not fully unanchored, but they are still above target. |
| 30-year fixed mortgage rate | 6.30% | Housing affordability and refinancing capacity remain strained. |
That said, the market is not pricing an immediate systemic collapse. The yield curve has re-steepened: the 10-year minus 2-year spread was about 0.50 percentage point on May 5. The Federal Reserve Bank of New York’s Treasury-spread model put the probability of recession 12 months ahead at 17.6% using data through April 2026. Its DSGE model, however, still put the probability of a recession over the next four quarters at 35.8% in March. The message is not “all clear.” It is “risk elevated, but not settled.”[10][11]
This is why the loudest macro arguments can miss the point. If you only look at current GDP, there is no recession. If you only look at inflation, there is no clean path to immediate easing. If you only look at the curve, you can talk yourself into optimism. The reality is that the broad aggregates are still positive while the financing backdrop remains restrictive enough to keep producing localized breakage. That is a classic late-cycle setup.
Energy-led inflation and the Fed trap
The latest inflation acceleration was real, and it was heavily energy-led. The Bureau of Labor Statistics reported that March CPI rose 0.9% month over month and 3.3% year over year. The energy index jumped 10.9% in the month, with gasoline up 21.2%; gasoline alone accounted for nearly three-quarters of the monthly increase in overall CPI. BLS also noted that this was the largest monthly increase in the energy index since September 2005. That matters for the analogy to the mid-2000s: the present inflation impulse is not just about sticky services. It is also about a supply-side energy shock hitting at a vulnerable point in the cycle.[8]
The energy backdrop was not random. The U.S. Energy Information Administration said crude oil and petroleum product prices rose sharply in the first quarter of 2026, especially after military action in the Middle East on February 28 and the subsequent de facto closure of the Strait of Hormuz. Its April Short-Term Energy Outlook projected U.S. gasoline prices peaking near $4.30 per gallon in April 2026. The Fed’s March minutes also said higher near-term inflation concerns tied to surging energy prices had pushed up inflation compensation.[13][12][30]
The cleaner way to say it is this: the current inflation impulse is energy-led, not energy-only. Core CPI still rose 0.2% in March and was up 2.6% over the year. Shelter rose 0.3% in the month and 3.0% over the year. Headline PCE was 3.5% in March and core PCE was 3.2%. So energy is amplifying the problem, but the floor under inflation is still being provided by services and shelter. That is exactly what makes policy harder.[8][6]
If the entire problem were oil, the Fed could look through it more easily. If the entire problem were domestic demand, it could tighten or hold more confidently. Instead, it has both. Energy is raising the headline pressure, core prices remain above target, the labor market has not collapsed, and credit stress is already visible in rate-sensitive assets. That is not a clean policy environment. It is exactly the kind of environment where the wrong move can turn a rolling squeeze into a broader contraction.
That is why “stagflation” is too strong as a literal label for the present moment, but “stagflationary pressure” is fair. Economic activity is still growing. Unemployment at 4.3% is not a classic labor collapse. Yet inflation is elevated, job gains have “remained low, on average,” in the Fed’s language, and the latest shock is supply-side rather than demand-led. The International Monetary Fund made the key policy point in its April 2026 Global Financial Stability Report: if monetary policy was already properly calibrated before the current shock, central banks may benefit from waiting for more clarity rather than reacting mechanically. That is effectively what the Fed is doing now.[7][22]
Commercial real estate is the visible fire
The most important break under the surface is commercial real estate, especially office. The Mortgage Bankers Association said $875 billion of outstanding commercial and multifamily mortgages were scheduled to mature in 2026, after $957 billion in 2025. That is still a massive refinancing wall. It means the market is not just dealing with lower values in theory. It is dealing with the forced reality of loans coming due under a completely different rate structure.[14]
At the same time, Green Street’s December 2025 pricing data showed office values 35% below their 2022 peak, while MSCI’s repeat-sales index showed central business district office prices down 46.1% over five years. So when market participants talk about portfolios or assets clearing at 30% to 50% below old marks, that is not outlandish chatter. It is directionally consistent with the market-level repricing already visible in major office benchmarks.[15][16]
The distress is also showing up in credit performance. Trepp reported the overall U.S. CMBS delinquency rate at 7.55% in March 2026. KBRA said office CMBS delinquency was 12.6% in April 2026. The Federal Deposit Insurance Corporation, looking at bank books rather than securitizations, said the past-due and nonaccrual rate on non-owner-occupied CRE loans at banks with assets above $250 billion was 4.06% in the fourth quarter of 2025—well below its 2024 peak, but still far above the pre-pandemic average of 0.58%. These are not niche indicators anymore. They are the visible footprint of a refinancing problem moving through the system.[17][18][19]
| Stress point | Data point | Pattern Nexus read |
|---|---|---|
| Commercial and multifamily mortgage maturities | $875 billion scheduled to mature in 2026 after $957 billion in 2025 | The maturity wall keeps pushing old valuations through a new rate environment. |
| Office values | Green Street: office values 35% below their 2022 peak | The old cap-rate world is gone. Property marks are being forced down. |
| CBD office pricing | MSCI: central business district office prices down 46.1% over five years | The 30% to 50% haircut chatter fits the benchmark direction. |
| CMBS delinquency | Trepp: overall U.S. CMBS delinquency rate at 7.55% in March 2026 | Stress is visible in securitized credit, not just private deal talk. |
| Office CMBS delinquency | KBRA: office CMBS delinquency at 12.6% in April 2026 | Office is the clearest damage zone. |
| Large-bank non-owner-occupied CRE loans | FDIC: 4.06% past-due and nonaccrual rate in Q4 2025, versus 0.58% pre-pandemic average | The bank-book version of the stress is not imaginary, even if it is below the 2024 peak. |
The second important refinement is that “extend and pretend” is not the whole story. FDIC said banks have used loan modifications to provide relief, especially at larger institutions. But recent Fed research on CRE extensions found that terms on extensions became more stringent during the stress period, not looser. Borrowers were more likely to have to pay down principal or accept harsher terms, especially on riskier loans. That suggests the market is not simply hiding all losses by rolling everything forward. A lot of the pain is being delayed, negotiated, and restructured—but not painlessly erased.[20][21]
Private credit and nonbank linkages
The third fault line is private credit and its banking linkages. The IMF said the global direct-lending universe is about $2 trillion, with roughly $300 billion in semiliquid structures. In its April 2026 report, it warned that while liquidity mismatches in private credit remain limited enough to contain systemic impact for now, signs of higher borrower defaults ahead could cascade into broader concerns about corporate credit. That is not a crisis call by itself. It is a warning that the pressure point is now large enough to matter.[22]
A 2025 Fed note said private credit was about $1.34 trillion in the U.S. and nearly $2 trillion globally by mid-2024, while bank commitments to private credit vehicles reached about $95 billion by 2024-Q4. Under a stress scenario in which undrawn lines were fully pulled, those drawdowns could rise by roughly $36 billion—about 2% of large banks’ CET1 capital. Again, that is not the same as saying the system is already breaking. It is a map of the transmission channel.[23]
The bank/nonbank connection is getting stronger, not weaker. FDIC said lending to nondepository financial institutions has been the fastest-growing bank loan segment since the global financial crisis, reaching $1.32 trillion by the third quarter of 2025. The Fed’s April 2026 Senior Loan Officer Opinion Survey said banks tightened standards for NDFI loans over the past year, but demand for those loans strengthened across every NDFI category, with banks citing liquidity needs as a major reason. That is precisely the kind of setup that can turn a contained credit problem into a broader funding problem if defaults rise and drawdowns accelerate at the same time.[24][25]
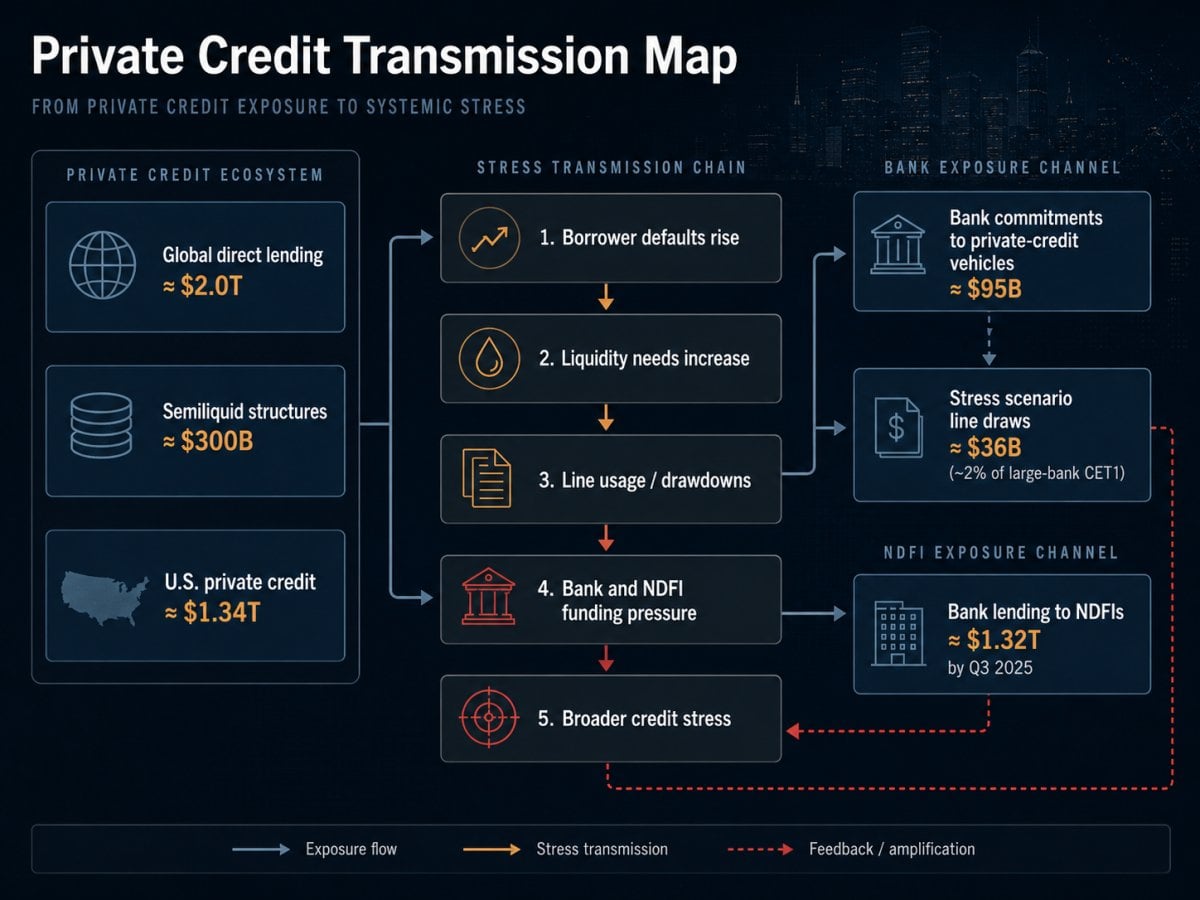
Private credit is not automatically the next 2008. But when bank lines, NDFI liquidity needs, CRE repricing, and borrower defaults all sit in the same pressure field, the transmission channel deserves attention.
This is where the “credit crisis” language has to be handled carefully. There is a visible credit problem in CRE. There is a growing vulnerability in private credit. There is a bank-to-nonbank linkage that matters more than most public macro commentary admits. But that does not mean every part of the credit system is already in crisis. The better frame is that the refinancing wall is moving through the most rate-sensitive balance sheets first. If stress remains contained, the economy absorbs it as a rolling squeeze. If stress migrates, it becomes a broader recession problem.
Consumer, small-business, and bankruptcy stress
The part that needed to be added is the bridge between credit plumbing and the real economy. Rates, CRE maturities, and private-credit linkages can sound abstract until they start showing up in households, small businesses, and bankruptcy courts. That is where the current environment gets more serious. The pressure is not only sitting in charts. It is moving into the places where people carry balances, delay purchases, cut capital spending, and eventually restructure or fail.
The New York Fed’s latest Household Debt and Credit Report showed total household debt rising by $191 billion in the fourth quarter of 2025 to $18.8 trillion. Credit-card balances rose by $44 billion to $1.28 trillion, while auto-loan balances increased by $12 billion to about $1.67 trillion. That does not automatically mean the household sector is broken, but it does mean the consumer side of the economy is carrying a larger nominal debt load into a higher-rate environment.[31]
The Fed’s household debt-service data gives the same message from a different angle. Total required household debt payments reached 11.32% of disposable personal income in the fourth quarter of 2025. That is still below the pre-2008 extremes, which matters, but it is also clearly above the temporary relief levels seen after the pandemic-era collapse in rates and payment burdens. So the consumer is not 2007, but the consumer is also not sitting in the same low-rate cushion that existed a few years ago.[32]
Small business is where the energy shock, rate structure, and consumer strain start to meet. NFIB said its Small Business Optimism Index fell 3.0 points in March to 95.8, below its 52-year average of 98.0. The Uncertainty Index rose to 92, profit trends worsened sharply, and only 16% of owners planned capital outlays in the next six months, the lowest reading since November 2009. That is not the kind of small-business backdrop that screams clean expansion. It looks more like an owner class trying to protect cash while input costs, financing costs, and demand uncertainty press in from multiple sides.[33]
Bankruptcy data is the confirmation layer. U.S. Courts reported that total bankruptcy filings rose 11.9% during the 12-month period ending March 31, 2026, with total filings increasing to 591,850. Business filings rose 11.4%, from 23,309 to 25,960. Epiq AACER separately reported 8,436 total commercial bankruptcies in the first quarter of 2026, up 14% from the first quarter of 2025, while total commercial Chapter 11 filings rose 37% to 2,422. Subchapter V small-business elections rose 67% to 833 filings.[34][35]
| Stress layer | Current signal | Pattern Nexus read |
|---|---|---|
| Household debt | Total household debt at $18.8 trillion in Q4 2025 | The consumer is carrying a larger nominal debt load into a high-rate, high-cost environment. |
| Credit cards | Credit-card balances at $1.28 trillion | Revolving credit is the pressure-release valve when wages and cash flow do not keep up with costs. |
| Auto loans | Auto-loan balances near $1.67 trillion | Transportation debt remains part of the household squeeze, especially if labor conditions weaken. |
| Debt-service ratio | Household debt service at 11.32% of disposable personal income | Not a 2008-level household leverage picture, but clearly less forgiving than the low-rate relief period. |
| Small-business optimism | NFIB index at 95.8, below its 52-year average | The owner class is losing confidence before the headline economy has fully broken. |
| Small-business capex | Only 16% planning capital outlays, lowest since November 2009 | Expansion plans are being pulled back, which is how stress becomes slower hiring and weaker local demand. |
| Bankruptcy filings | Business filings up 11.4% year over year; Q1 commercial filings up 14% | Failures are rising again, which confirms stress is already moving through weaker balance sheets. |
This is the reason the article should not stop at CRE and private credit. The financial plumbing is the early-warning system, but the recession path only becomes real when the pressure leaks into hiring, purchasing, business investment, consumer credit, and bankruptcy. That does not make a downturn inevitable. It does mean the no-recession case has to explain why these stress points stay contained instead of broadening.
Credit stress becomes macro stress when it leaves the spreadsheet and enters payrolls, capex, consumer balances, and bankruptcy courts.
Why this feels like 2006 and why it is not 2006
The “2006” analogy works best as a description of timing and psychology, not as a one-to-one replay of the old balance-sheet structure. In both cases, the headline macro picture looked better than the underlying refinancing picture. In both cases, real estate mattered disproportionately. In both cases, the loudest public narratives could still plausibly argue that growth was fine while deeper credit plumbing was already giving way.
Today, though, the weak collateral is not mass U.S. owner-occupied housing financed through subprime securitization. It is office CRE, maturity-heavy commercial loans, and opaque nonbank credit arrangements funded in part through bank lines. That distinction matters because the risk does not have to follow the same path to still rhyme with the same cycle logic.
The analogy also breaks down when you look at aggregate leverage. Fed financial-stability analysis said the private nonfinancial-sector credit-to-GDP ratio was near a 20-year low in 2024, and household debt relative to GDP was also at a 20-year low. It also said the largest banks’ CET1 ratios were near or above the top quartile of their past-decade range. The Fed’s 2026 stress-test scenario likewise described commercial real estate prices as relatively stable since early 2024 after large earlier declines, and noted that BBB corporate spreads were low relative to history. That is very different from the pre-2008 combination of extreme household leverage, broad housing overexposure, and deteriorating capital quality across the system.[26][27]
| Comparison point | 2006 echo | Current difference |
|---|---|---|
| Headline economy | Growth still looked survivable before the system fully admitted the damage. | GDP is still positive and nowcasting remains positive. |
| Real estate stress | Real estate was the hidden pressure point. | The center is office CRE and commercial refinancing, not mass subprime owner-occupied housing. |
| Credit plumbing | Structured and opaque channels mattered more than the public understood. | Private credit and bank-to-nonbank lending are the modern transmission channels to watch. |
| Household leverage | Households were a central weak point before 2008. | Household debt relative to GDP is much lower than it was before the financial crisis. |
| Bank capital | The pre-2008 system was more fragile at the core. | Large-bank capital ratios are stronger, reducing but not eliminating systemic risk. |
So the best Pattern Nexus formulation is this: it feels like 2006 because the macro surface is still calm enough to confuse people, while the wrong assets are already rolling lower underneath it. But it is not 2006 because household leverage is lower, bank capital is stronger, and the current weakness is much more concentrated in commercial property and nonbank credit intermediation.
What the recession path looks like from here
The no-recession case is straightforward. First-quarter GDP was positive, second-quarter nowcasting is positive, the yield curve is positive again, and market-based long-run inflation expectations—while higher than target—are not unanchored. If the energy shock fades and long rates stop pushing higher, the economy can continue expanding while inflation gradually cools back down. On that path, the pain stays concentrated in office, select borrowers, and refinancing-heavy capital structures, rather than becoming a broad macro contraction.
The recession case is more subtle, and therefore more dangerous. It does not require a dramatic macro shock tomorrow morning. It only requires the current contradictions to persist: energy stays elevated, the Fed cannot deliver meaningful relief, long rates stay restrictive, CRE maturities keep colliding with lower property values, private-credit borrowers begin to default at a higher clip, small businesses pull back spending and hiring, and consumers lean harder on debt while bankruptcy filings keep rising.
That kind of environment can create a rolling recession—first in office, then in credit, then in hiring, and only later in the headline GDP data. The point is not that recession is already here. The point is that the conditions for one are visible in the refinancing channels.
Pattern note
The public waits for the word “recession.” The system does not. It reprices assets, tightens credit, extends maturities under harsher terms, demands more equity, reduces proceeds, and quietly changes what deals can get done. By the time the word arrives, the process has usually been underway for a while.
AI as a labor-market amplifier
The AI point belongs in the analysis, but as a medium-term amplifier rather than the current primary driver. IMF work in early 2026 said nearly 40% of global jobs are exposed to AI-driven change and that about 1 in 10 job vacancies in advanced economies now require at least one new skill. Another IMF write-up said employment in AI-vulnerable occupations can run lower in regions with high demand for AI skills. Anthropic’s April 2026 survey also found greater displacement concern among workers in more AI-exposed roles.[28][29]
But the current aggregate labor data do not show AI as the dominant reason unemployment is 4.3% or payroll growth has slowed. Right now, AI is a pressure building in the labor pipe, not the main macro crack already visible in the data. It matters because it can worsen the labor side of the cycle if companies use AI adoption as a cover for cost-cutting during a credit slowdown. That is where the risk becomes more interesting: not AI alone, but AI plus higher long rates, refinancing stress, and tighter credit.
Pattern Nexus Lens
The real pattern is not “recession or no recession” in the lazy headline sense. The real pattern is constraint stacking.
One constraint is the long end of the rate structure. The Fed can pause, hint, wait, or argue around the edges, but if the 10-year stays in the mid-4s and real long rates stay restrictive, the refinancing math still bites. That is the pressure valve under housing, commercial real estate, cap rates, deal flow, loan proceeds, and long-duration assets.
The second constraint is energy. Inflation that comes from an energy shock is not the same as inflation that comes from a clean demand boom. It hits the public like a tax, raises the cost floor, and limits the Fed’s ability to ride to the rescue. That is why the setup is dangerous: the Fed can see credit stress, but if inflation is still pushing higher through energy, the normal cut response becomes politically and economically harder.
The third constraint is credit plumbing. Office CRE, CMBS, bank CRE exposure, private credit, and bank-to-nonbank lending are not separate stories. They are different faces of the same higher-for-longer refinancing problem. The public sees GDP. The system sees maturities.
The fourth constraint is the real-economy pass-through. Consumers can absorb pressure for a while by using credit. Small businesses can absorb pressure for a while by delaying capital spending, cutting inventory plans, or holding back hiring. Weak borrowers can survive for a while through extensions and restructuring. But if those delays all happen at once, the system stops looking resilient and starts looking frozen.
This feels like 2006 because the surface data is still calm enough to confuse people while the lower layers are already repricing.
That does not mean every balance sheet is the same. It does not mean the next crash has to look like the last crash. It means the pattern is similar: decent headline data, rising stress in the assets most exposed to refinancing, public confidence that lags the plumbing, and a policy environment where the obvious rescue tool is constrained by inflation.
Pattern Nexus Watchlist
The way to track this thesis from here is not to wait for one official recession headline. The better method is to watch whether the stress stays trapped in isolated sectors or keeps moving down the chain into financing, business investment, hiring, consumer credit, and defaults.
| Signal | Why it matters | What would strengthen the recession case |
|---|---|---|
| 10-year Treasury yield | The long end drives mortgages, CRE refinancing, cap rates, and long-duration valuations. | The 10-year stays pinned above roughly 4.25% to 4.50% instead of breaking lower. |
| Oil and gasoline | Energy acts like a tax on consumers and keeps the Fed boxed in. | Crude and gasoline fail to normalize, keeping headline inflation pressure alive. |
| Office and CRE delinquency | CRE is the clearest visible stress point in the refinancing cycle. | Office CMBS delinquency keeps rising and bank CRE stress stops improving. |
| Private-credit defaults and drawdowns | Private credit is the modern opaque credit channel, especially through bank commitments and NDFI linkages. | Borrower defaults rise while funds draw on bank lines or face liquidity pressure. |
| Bank and NDFI loan demand | Liquidity-driven demand can show stress before it shows in headline losses. | NDFI loan demand stays strong because borrowers need liquidity rather than growth capital. |
| Small-business capex and profits | Small businesses translate macro pressure into hiring, inventory, and local spending decisions. | Profit trends weaken further and capital-outlay plans stay near recession-type levels. |
| Credit-card and auto delinquencies | Consumer credit is the bridge between household strain and broader demand weakness. | Serious delinquencies rise while balances keep climbing. |
| Payrolls and unemployment | The labor market is the final confirmation layer for a broad recession call. | Payroll growth weakens materially and unemployment starts moving higher in a persistent way. |
If those signals cool together, the no-recession case gets stronger. If they deteriorate together, then the story stops being a localized CRE/private-credit problem and becomes a full macro contraction path.
Timeline and argument map
This section replaces the raw Mermaid timeline and flowchart with normal HTML, so the site will display the map cleanly even if the page does not render Mermaid blocks.
| Period | Pressure point | Pattern Nexus read |
|---|---|---|
| 2023 | 10-year Treasury averaged near 3.96% | The long end had already moved out of the old low-rate regime. |
| 2024 | 10-year Treasury average rose to 4.21% | The rate structure kept pressing real estate, mortgages, and duration-sensitive assets. |
| 2025 | 10-year Treasury average rose to 4.29% | Higher-for-longer stopped being a temporary scare and became the operating environment. |
| 2025 | $957 billion in commercial and multifamily mortgages were scheduled to mature | The maturity wall started forcing old loan math through the new rate structure. |
| 2025 Q4 | Large-bank non-owner-occupied CRE past-due and nonaccrual rate sat at 4.06% | The bank-book version of CRE stress remained visible. |
| 2025 Q4 | Total household debt reached $18.8 trillion | Households entered 2026 with larger nominal balances and higher debt-service pressure. |
| 2026 Feb 28 | Middle East military action preceded sharp oil and product price moves | Energy became the shock that complicated the Fed’s ability to respond to credit stress. |
| 2026 Mar | CPI rose 0.9% month over month; energy rose 10.9%; gasoline rose 21.2% | The inflation impulse became energy-led but not energy-only. |
| 2026 Mar | Payrolls rose 178,000 and unemployment sat at 4.3% | The labor market had slowed but had not fully broken. |
| 2026 Q1 | Real GDP grew at a 2.0% annual rate | The headline economy still looked positive while lower layers were repricing. |
| 2026 Q1 | Commercial bankruptcies rose 14% year over year and commercial Chapter 11 filings rose 37% | Corporate stress was already showing up in failure and restructuring data. |
| 2026 Apr | Fed held rates at 3.50% to 3.75% | The policy trap remained: inflation pressure limited the rescue path. |
| 2026 Apr | KBRA reported office CMBS delinquency at 12.6% | Office remained the clearest visible damage zone. |
| 2026 May | 10-year Treasury remained around the mid-4% range | The long end continued to define the refinancing environment. |
| Starting pressure | Transmission channel | Possible result |
|---|---|---|
| High long-term rates | Expensive refinancing, lower loan proceeds, weaker cap-rate math | CRE value pressure, weaker deal flow, and forced restructurings |
| Energy-led inflation | Higher household costs and less Fed flexibility | Consumers get squeezed while policy relief becomes harder |
| CRE maturity wall | Old loans mature into lower property values and higher rates | CMBS delinquency, bank CRE stress, asset sales, and extensions under tougher terms |
| Private-credit growth | Opaque borrower stress, bank commitments, and NDFI liquidity needs | Contained rolling squeeze if absorbed, broader credit stress if defaults and drawdowns rise together |
| Household balance pressure | Credit-card balances, auto loans, and debt-service costs | Lower discretionary spending and higher delinquency risk if labor weakens |
| Small-business uncertainty | Weaker profit trends, lower capital-outlay plans, and cautious hiring | Slower local investment, weaker payroll momentum, and more bankruptcy pressure |
| AI labor pressure | Companies gain a cost-cutting tool during a credit slowdown | Hiring quality weakens and displacement risk becomes an amplifier |
| Stress broadens across channels | Credit, labor, consumer, and business failures reinforce each other | Rolling recession risk becomes headline recession risk |
Frequently asked questions
Is the economy already in recession?
Not based on the headline data used here. First-quarter real GDP was positive, payrolls were still rising, unemployment was 4.3%, and second-quarter nowcasting was still positive. The point is not that recession is already here. The point is that the refinancing channels are showing stress before the broad aggregates fully reflect it.
Why does this feel like 2006?
Because the surface economy still looks survivable while the deeper credit math is getting worse. In both periods, public narratives could still argue that growth was fine while rate-sensitive assets and credit plumbing were already weakening. The comparison is about timing and psychology, not a direct replay of every balance-sheet detail.
Why is it not exactly like 2006 or 2008?
The weak point is different. Before 2008, the center of the problem was owner-occupied housing, subprime mortgages, and structured credit tied to household leverage. In the current setup, the pressure is more concentrated in office commercial real estate, refinancing-heavy commercial loans, private credit, and bank-to-nonbank lending. Household leverage is lower and large-bank capital is stronger.
Why do long-term interest rates matter more than just the Fed funds rate?
The real economy does not refinance only off the policy rate. Mortgages, commercial real estate loans, cap rates, long-duration assets, and credit pricing are heavily tied to the term structure, especially the 10-year Treasury. That is why a mid-4% 10-year can keep financial conditions tight even after the Fed has cut from prior highs.
Is this inflation mostly from energy?
The latest impulse is energy-led, but not energy-only. March CPI was heavily driven by gasoline and energy, but core CPI, shelter, headline PCE, and core PCE were still elevated. That makes policy harder because the Fed cannot simply ignore the shock as pure oil noise when underlying inflation is still above target.
What is the biggest visible credit problem?
Office commercial real estate is the clearest stress point. Values are down sharply from prior peaks, CMBS delinquency has risen, office CMBS delinquency is elevated, and a large commercial mortgage maturity wall remains. That is where the higher-for-longer rate structure is most visibly forcing repricing.
Is private credit already a crisis?
Not yet. The article frames private credit as a fast-growing vulnerability, not a proven systemic crisis. The concern is the transmission channel: direct lending has grown, some structures have liquidity mismatches, bank commitments to private-credit vehicles are meaningful, and bank-to-nonbank lending has expanded. If defaults and drawdowns rise together, the stress could spread.
What would make the recession case stronger?
The recession case strengthens if energy stays elevated, the Fed cannot cut meaningfully, the 10-year remains restrictive, CRE maturities keep colliding with lower property values, private-credit defaults rise, and hiring weakens. That would create a rolling recession path that starts in credit and only later appears in headline GDP.
What would make the no-recession case stronger?
The no-recession case strengthens if energy prices cool, inflation expectations remain anchored, long rates fall, CRE stress stays contained, private credit does not force broad funding strains, and the labor market continues to absorb the pressure without a sharp unemployment spike.
Why add consumer and bankruptcy stress to the analysis?
Because CRE and private credit are the early pressure points, but recession risk becomes broader only when the stress moves into households, small businesses, hiring, investment, and failures. Rising household balances, weaker small-business confidence, reduced capital-outlay plans, and higher bankruptcy filings show that the pressure is no longer just theoretical.
Does rising bankruptcy mean recession is already here?
No. Bankruptcy is a confirmation layer, not a complete recession call by itself. The stronger point is that bankruptcies are rising while the headline economy still looks positive. That fits the late-cycle setup: visible failures appear before the broad public narrative catches up.
Where does AI fit into this economic setup?
AI is treated as a medium-term labor-market amplifier rather than the current primary recession driver. AI exposure is real, and worker concern is rising in AI-exposed roles, but the current aggregate labor data do not show AI as the main reason unemployment is 4.3% or payroll growth has slowed. Right now, AI is pressure building in the labor pipe, not the main macro crack already visible in the data.
Uncertainties and limitations
The biggest timing caveat is that the economy is not currently confirmed to be in recession by the data used here. The argument is about conditions, pressure channels, and recession risk, not a declaration that the downturn has already officially started.
The biggest comparison caveat is that “this feels like 2006” should not be read as “this is a perfect 2008 replay.” Household leverage is lower, large-bank capital is stronger, and the weak collateral is more concentrated in office CRE and nonbank credit rather than mass subprime owner-occupied housing.
The biggest credit caveat is that private credit is not treated here as a proven systemic crisis. It is treated as a fast-growing vulnerability with clear bank linkages and plausible stress-transmission pathways. That is a different claim, and the distinction matters.
The biggest inflation caveat is that energy is the current accelerator, not the entire inflation story. Core inflation, shelter, and PCE remain important because they are what make it harder for policymakers to dismiss the shock as temporary oil noise.
The biggest consumer caveat is that household debt stress is not currently the same as 2007. The stronger argument is not that households are already in a pre-2008 position. The stronger argument is that higher nominal balances, higher debt-service pressure, weaker small-business confidence, and rising bankruptcy filings make the system less forgiving if labor weakens from here.
Sources
- Board of Governors of the Federal Reserve System. (2026, April 29). Federal Reserve issues FOMC statement. https://www.federalreserve.gov/newsevents/pressreleases/monetary20260429a.htm
- Federal Reserve Bank of St. Louis. (2026). Market yield on U.S. Treasury securities at 10-year constant maturity. FRED. https://fred.stlouisfed.org/series/DGS10
- Federal Reserve Bank of St. Louis. (2026). 10-year breakeven inflation rate. FRED. https://fred.stlouisfed.org/series/T10YIE
- Freddie Mac. (2026, April 30). Primary Mortgage Market Survey. https://www.freddiemac.com/pmms
- Bureau of Economic Analysis. (2026, April 30). Gross domestic product, 1st quarter 2026 advance estimate. https://www.bea.gov/news/2026/gdp-advance-estimate-1st-quarter-2026
- Bureau of Economic Analysis. (2026, April 30). Personal income and outlays, March 2026. https://www.bea.gov/news/2026/personal-income-and-outlays-march-2026
- Bureau of Labor Statistics. (2026, April 3). The employment situation—March 2026. https://www.bls.gov/news.release/empsit.htm
- Bureau of Labor Statistics. (2026, April 10). Consumer Price Index—March 2026. https://www.bls.gov/news.release/cpi.htm
- Federal Reserve Bank of Atlanta. (2026, May 5). GDPNow. https://www.atlantafed.org/research-and-data/data/gdpnow
- Federal Reserve Bank of New York. (2026, May 3). Probability of U.S. recession predicted by Treasury spread. https://www.newyorkfed.org/medialibrary/media/research/capital_markets/prob_rec.pdf
- Federal Reserve Bank of New York. (2026, March 20). The New York Fed DSGE model forecast—March 2026. https://libertystreeteconomics.newyorkfed.org/2026/03/the-new-york-fed-dsge-model-forecast-march-2026/
- U.S. Energy Information Administration. (2026, April). Short-Term Energy Outlook. https://www.eia.gov/outlooks/steo/
- U.S. Energy Information Administration. (2026, April 7). Crude oil and petroleum product prices increased sharply in the first quarter of 2026. https://www.eia.gov/todayinenergy/detail.php?id=67424
- Mortgage Bankers Association. (2026, February 9). 17% of commercial and multifamily mortgage balances to mature in 2026. https://newslink.mba.org/mba-newslinks/2026/february/mba-newslink-tuesday-feb-10-2026/17-of-commercial-and-multifamily-mortgage-balances-to-mature-in-2026/
- Green Street. (2025, December 4). Modest price gains for fairly valued real estate. https://info.greenstreet.com/hubfs/GSCPPI-20251204press.pdf
- MSCI. (2026, February). RCA CPPI US. https://www.msci.com/downloads/web/msci-com/research-and-insights/paper/rca-commercial-property-price-indexes-rca-cppi/2603-rca-cppi-us.pdf
- Trepp. (2026). CMBS delinquency rate jumps in March 2026. https://www.trepp.com/trepptalk/cmbs-delinquency-rate-jumps-in-march-2026
- KBRA. (2026, May). CMBS loan performance trends: April 2026. https://www.kbra.com/publications/jKQskxtK
- Federal Deposit Insurance Corporation. (2026). Quarterly Banking Profile: Fourth quarter 2025. https://www.fdic.gov/news/speeches/2026/fdic-quarterly-banking-profile-fourth-quarter-2025
- Federal Deposit Insurance Corporation. (2026). 2026 Risk Review. https://www.fdic.gov/analysis/2026-risk-review-full.pdf
- Board of Governors of the Federal Reserve System. (2026). Pretend or amend? On evergreening in CRE. https://www.federalreserve.gov/econres/feds/files/2026025pap.pdf
- International Monetary Fund. (2026, April). Global Financial Stability Report. https://www.imf.org/en/publications/gfsr/issues/2026/04/14/global-financial-stability-report-april-2026
- Board of Governors of the Federal Reserve System. (2025, May 23). Bank lending to private credit: Size, characteristics, and financial stability implications. https://www.federalreserve.gov/econres/notes/feds-notes/bank-lending-to-private-credit-size-characteristics-and-financial-stability-implications-20250523.html
- Federal Deposit Insurance Corporation. (2026, February 17). Bank lending to nondepository financial institutions. https://www.fdic.gov/analysis/2026-02/bank-lending-nondepository-financial-institutions
- Board of Governors of the Federal Reserve System. (2026, May 4). The April 2026 Senior Loan Officer Opinion Survey on Bank Lending Practices. https://www.federalreserve.gov/data/sloos/sloos-202604.htm
- Board of Governors of the Federal Reserve System. (2024). Financial Stability Report / annual report financial stability discussion. https://www.federalreserve.gov/publications/2024-ar-financial-stability.htm
- Board of Governors of the Federal Reserve System. (2026). 2026 stress test scenarios. https://www.federalreserve.gov/publications/2026-stress-test-scenarios.htm
- International Monetary Fund. (2026, January 14). New skills and AI are reshaping the future of work. https://www.imf.org/en/blogs/articles/2026/01/14/new-skills-and-ai-are-reshaping-the-future-of-work
- Anthropic. (2026, April 22). What 81,000 people told us about the economics of AI. https://www.anthropic.com/research/81k-economics
- Board of Governors of the Federal Reserve System. (2026, April 8). Minutes of the Federal Open Market Committee, March 17–18, 2026. https://www.federalreserve.gov/monetarypolicy/fomcminutes20260318.htm
- U.S. Department of the Treasury. (2026, May 5). Daily Treasury par yield curve rates. https://home.treasury.gov/
- Federal Reserve Bank of New York. (2026, February 10). Quarterly Report on Household Debt and Credit, 2025: Q4. https://www.newyorkfed.org/microeconomics/hhdc
- Board of Governors of the Federal Reserve System. (2026, March 20). Household Debt Service and Financial Obligations Ratios. https://www.federalreserve.gov/releases/dsr/
- National Federation of Independent Business. (2026, April 14). Small business optimism fell in March survey. https://www.nfib.com/news/press-release/new-small-business-optimism-fell-in-march-survey/
- Administrative Office of the U.S. Courts. (2026, April 23). Bankruptcies increase 11.9 percent. https://www.uscourts.gov/data-news/judiciary-news/2026/04/23/bankruptcies-increase-119-percent
- Epiq. (2026, April 8). First quarter Subchapter V small business filings increase 67% over previous year. https://www.epiqglobal.com/en-us/resource-center/news/first-quarter-subchapter-v-small-business-filings-increase-67-over-previous-year
Frequently Asked Questions
Tepkiniz Nedir?
 Beğen
0
Beğen
0
 Beğenmiyorum
0
Beğenmiyorum
0
 Aşk
0
Aşk
0
 Komik
0
Komik
0
 Vay
0
Vay
0
 Üzgün
0
Üzgün
0
 Öfkeli
0
Öfkeli
0

Founder of Pattern Nexus. I research markets, macro, geopolitics, AI, history, ancient systems, and the patterns most people overlook. I’m also building Market Radar, a trading scanner designed to read pressure, risk, confirmation, and setup quality before chasing a move. Pattern Nexus is where I connect the dots between data, history, technology, and the bigger system playing out around us.

Yorumlar (0)