
The War Economy Is Not Coming. It Is Being Built in Public.
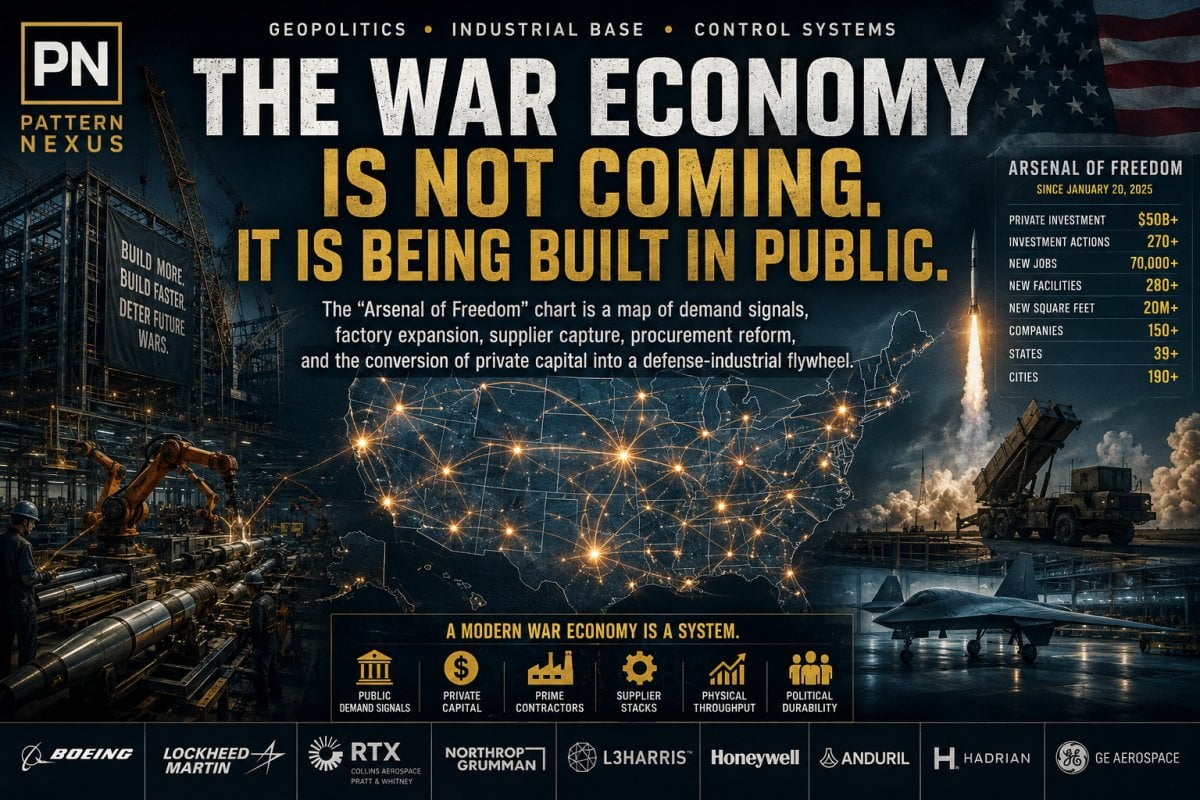
The Arsenal of Freedom chart is not just a defense graphic. It shows the United States shifting from peacetime procurement into a public-private war economy built around factories, missiles, suppliers, and long-term demand signals.
Quick Read
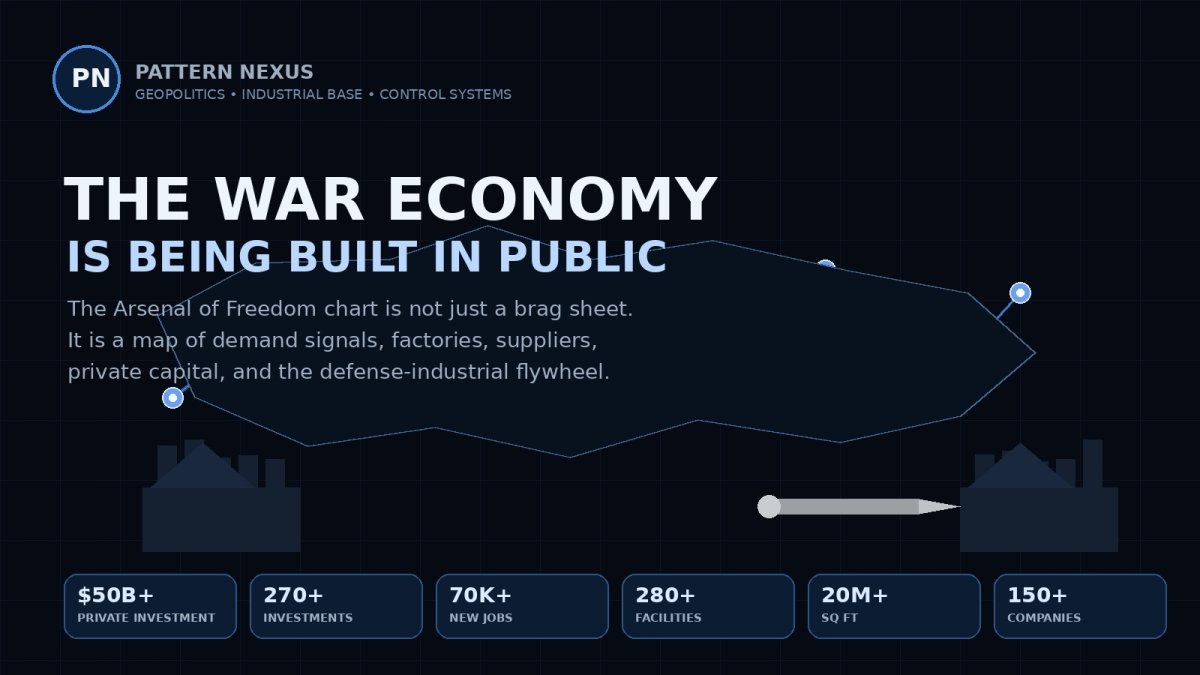
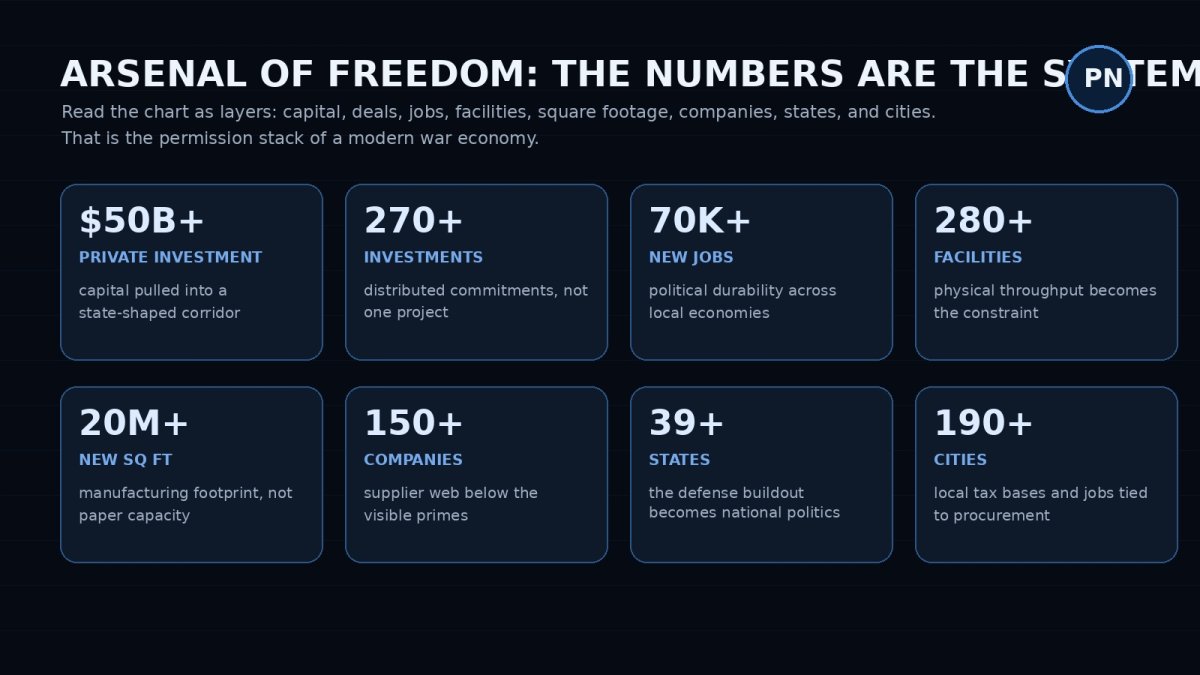
The “Arsenal of Freedom” graphic claims more than $50 billion in private investment, 270+ investment actions, 70,000+ new jobs, 280+ new facilities, 20 million+ square feet of manufacturing, 150+ companies, 39+ states, and 190+ cities tied to defense-industrial expansion since January 20, 2025.
The point is not only to buy weapons. The point is to send long-term demand signals strong enough that companies spend their own capital before the government fully writes the next check.
The bottlenecks are factories, rocket motors, interceptors, navigation systems, actuators, skilled labor, tooling, testing capacity, supply chains, and the legal authority to lock in multi-year production.
This is what a modern war economy looks like before most people admit it is a war economy. It does not start with ration cards. It starts with framework agreements, production floors, supplier commitments, and capital allocation.
The Chart Is the Message
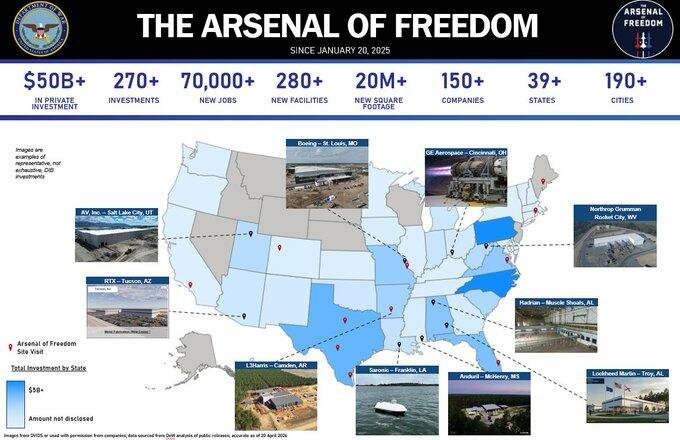
The chart circulating under the title “The Arsenal of Freedom” is easy to dismiss as political branding. That would be the wrong read.
On the surface, it looks like another government map with big numbers across the top: more than $50 billion in private investment, 270+ investments, 70,000+ new jobs, 280+ new facilities, 20 million+ new square feet, 150+ companies, 39+ states, and 190+ cities. It shows dots scattered across the country and highlights names like Boeing, GE Aerospace, Northrop Grumman, RTX, L3Harris, Anduril, Saronic, Hadrian, and Lockheed Martin. [1]
But the deeper story is not the graphic.
The deeper story is the structure underneath the graphic.
This is not just a defense announcement. It is a visible piece of a much larger transition: the United States is moving from a slow, brittle, peacetime procurement model toward an industrial mobilization model. The language is still dressed up as business efficiency, private investment, smart deals, domestic manufacturing, jobs, and supply-chain strength. But structurally, this is a war-economy conversion.
That does not mean every factory is producing tanks tomorrow. It does not mean every worker is being drafted into weapons production. It means the permission stack has changed.
The system is telling private capital, defense primes, Tier 1 suppliers, local governments, workforce pipelines, and industrial contractors that the demand will be there long enough to justify expansion.
That is the part most people miss.
The government does not need to own every factory to steer production. It only has to control the demand signal, the contract horizon, the regulatory path, the funding expectation, and the strategic narrative. Once those layers align, private capital begins moving as if the war economy already exists.
That is exactly what this chart shows.
Not a future possibility.
A system already moving.
The Arsenal of Freedom Table
The chart works because it compresses the entire defense-industrial buildout into one visual. But the numbers need to be slowed down and read as a system, not as isolated stats.
| Chart Metric | Claimed Scale | Pattern Nexus Reading |
|---|---|---|
| Private Investment | $50B+ | This is the capital layer. The government is not only spending directly; it is using procurement certainty to pull private balance sheets into the defense buildout. |
| Investment Actions | 270+ | This shows fragmentation across many deals instead of one single mega-project. The war economy is being assembled through distributed commitments. |
| New Jobs | 70,000+ | This is the political durability layer. Once defense jobs spread across states and cities, the buildout becomes harder to reverse. |
| New or Expanded Facilities | 280+ | This is the physical throughput layer. Production capacity is not theoretical; it has to become buildings, floors, machines, tooling, safety systems, and workers. |
| New Square Footage | 20M+ | This is the footprint layer. The system is expanding the physical surface area of defense manufacturing, not just moving money around on paper. |
| Companies | 150+ | This shows the supplier-web problem. A modern missile, drone, interceptor, ship system, or radar platform depends on many firms underneath the visible prime contractor. |
| States | 39+ | This is the political map. When defense production touches most of the country, it becomes a national constituency. |
| Cities | 190+ | This is the local-government layer. City-level jobs, tax bases, training programs, housing demand, and supplier ecosystems become tied to defense expansion. |
The important part is not just that the numbers are large. The important part is that they sit across every layer of the system: capital, labor, facilities, geography, politics, procurement, and suppliers. That is what makes this different from a normal defense headline.
In PN terms, this table is the permission stack in numeric form. The state creates the demand signal. Private capital responds. Factories expand. Workers are hired. Cities and states become tied to the contracts. Suppliers scale underneath the primes. The industrial base becomes a political and economic flywheel.
Featured Facilities Shown on the Chart
The callouts on the map matter because they show the buildout is not limited to one weapons platform, one prime contractor, or one region. It is spread across aircraft, missiles, propulsion, shipbuilding, autonomous systems, advanced manufacturing, and supplier expansion.
| Company / Site | Location | Why It Matters |
|---|---|---|
| Boeing | St. Louis, Missouri | A major aerospace and defense manufacturing node tied to aircraft, weapons systems, and long-running military production capacity. |
| GE Aerospace | Cincinnati, Ohio | Represents the propulsion and aerospace supplier layer, where engine and component capacity become strategic bottlenecks. |
| Northrop Grumman | Rocket City, West Virginia | Signals the importance of advanced defense systems, missile-related production, and distributed industrial capacity. |
| RTX | Tucson, Arizona | Central to the precision-munitions layer, including missiles and interceptors that are consumed quickly in modern conflict. |
| L3Harris | Camden, Arkansas | Important because solid rocket motors and propulsion capacity are among the deepest physical bottlenecks in missile production. |
| Saronic | Franklin, Louisiana | Shows the autonomous maritime layer entering the defense-industrial map, especially as drones and unmanned systems reshape naval competition. |
| Hadrian | Muscle Shoals, Alabama | Represents advanced manufacturing capacity and the attempt to rebuild machine-shop and precision-production capability inside the United States. |
| Anduril | McHenry, Mississippi | Shows the newer defense-tech layer moving from software and prototypes into physical production, autonomy, drones, and military hardware. |
| Lockheed Martin | Troy, Alabama | A legacy prime contractor node tied to missiles, munitions, and the broader U.S. precision-strike production base. |
This is how the modern war economy gets hidden in plain sight. It does not appear as one giant factory with a flag over it. It appears as a distributed network of aerospace plants, missile lines, rocket-motor campuses, autonomous-system facilities, supplier upgrades, and advanced manufacturing sites spread across the country.
What “War Economy” Actually Means
When most people hear “war economy,” they picture World War II: rationing, mass conscription, bond drives, factories converted overnight, civilian production redirected toward aircraft, ships, ammunition, and vehicles. That version is still the mental model most people use.
But a modern war economy does not need to look exactly like 1942.
It can operate through contracts, investment guarantees, framework agreements, subsidies, industrial policy, supplier acceleration, dual-use technology, software, drones, precision munitions, cyber systems, satellite networks, AI targeting infrastructure, logistics resilience, and long-term procurement horizons.
In the old version, the state directly commandeered capacity. In the modern version, the state creates the conditions where private industry voluntarily builds the capacity because the demand signal is too obvious to ignore.
That is why this “Arsenal of Freedom” chart matters. The numbers are not only a scorecard. They are a permission structure.
They tell industry: build.
They tell capital: allocate.
They tell states and cities: compete for defense production.
They tell suppliers: expand.
They tell workers: this sector is hiring.
They tell Wall Street: the defense cycle is not a short-term headline trade; it is becoming a structural industrial theme.
This is why I keep coming back to control systems. The system does not announce itself as a control system. It appears as “investment,” “resilience,” “security,” “jobs,” “domestic manufacturing,” “supply-chain strength,” and “national competitiveness.” Those words sound separate. They are not. They are the language of mobilization.
The Demand Signal Model
The key phrase in this entire story is demand signal.
That phrase sounds boring. It is not boring. It is the whole machine.
The public defense-industrial argument is that the department has changed its business model. Instead of operating through slow one-off purchases that leave suppliers uncertain, the government is trying to send long-term signals strong enough to make industry expand ahead of final delivery.
Reuters described this as a push to place the U.S. military on a “wartime footing,” with framework agreements involving major defense firms to expand munitions and defense-system production. Those agreements included Honeywell, BAE Systems, and Lockheed Martin, with additional pressure on the defense industry to prioritize production over shareholder payouts. [2]
That matters because defense production is not like ordering consumer goods from a warehouse. A missile is not just a missile. It is an entire layered ecosystem: explosives, solid rocket motors, actuators, guidance systems, chips, sensors, radars, propulsion, rare materials, test ranges, skilled labor, quality assurance, security clearances, machine tools, subcontractors, and logistics.
If the government only orders a small batch, suppliers do not build new capacity. They protect margins, stretch production, and avoid capital risk.
If the government signals seven years of demand, the calculation changes. Companies can justify new buildings, new tooling, automation, workforce expansion, supplier agreements, and balance-sheet commitments.
This is why multi-year procurement is not just an accounting tool. It is a control lever.
The public-private model works like this:
- The government identifies a strategic shortfall.
- It tells industry the demand will persist.
- It uses framework agreements to reduce uncertainty.
- Companies commit private capital to capacity expansion.
- States and cities compete for facilities and jobs.
- Suppliers receive downstream demand confidence.
- The industrial base reorganizes around the new signal.
That is the real machine. The chart is just the public-facing dashboard.
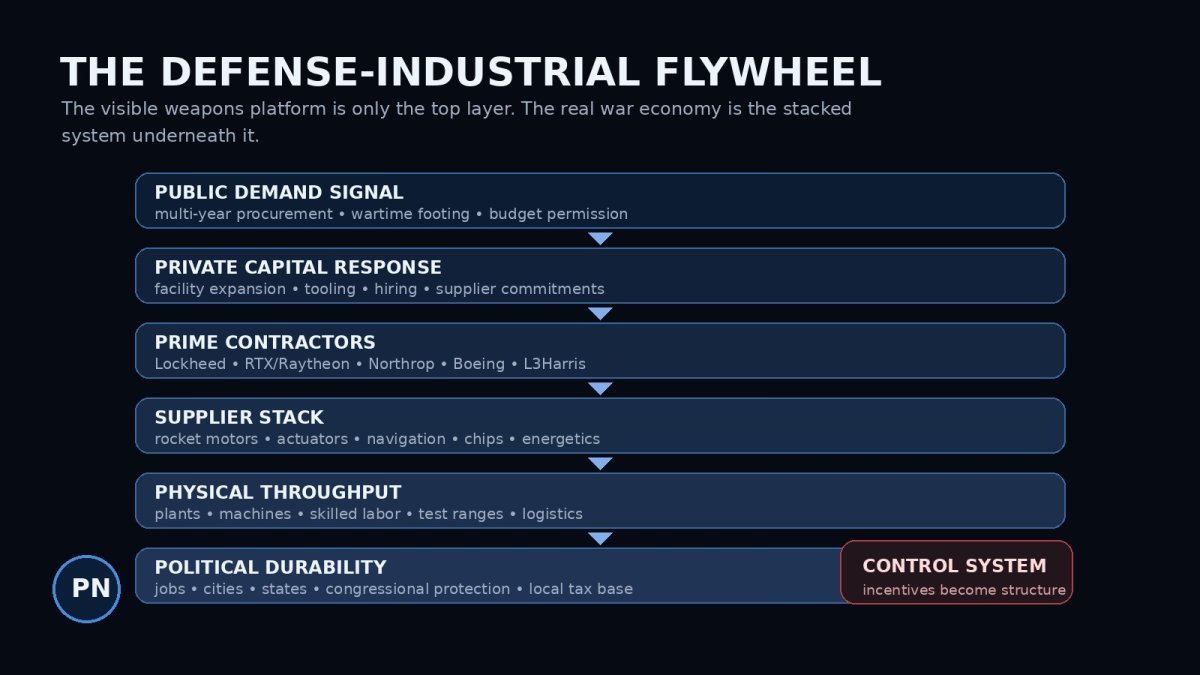
The System Stack Behind the Chart
The reason this matters is because the buildout does not happen in one clean line. It happens through layers. That is why it is so easy for people to miss it. They look for one person, one contract, one war, one factory, one headline. That is not how this works.
The modern war economy is a stack.
The state makes future demand believable enough for companies to invest before every final order is locked in.
Companies spend their own money because the government-shaped corridor makes expansion look rational.
Lockheed, RTX, Northrop, Boeing, L3Harris, and others become the visible layer people recognize.
Rocket motors, navigation systems, actuators, sensors, chips, explosives, test capacity, and skilled labor decide whether the visible layer can actually scale.
The real economy decides what is possible: land, machines, power, materials, workers, permits, logistics, and time.
Once jobs and facilities spread across states and cities, the buildout becomes a political constituency, not just a procurement policy.
That is why I keep calling it a flywheel. Once each layer starts feeding the next layer, the system gets harder to stop. Procurement creates investment. Investment creates jobs. Jobs create political support. Political support protects procurement. Procurement creates more investment.
That is not random.
That is structure.
The Companies Behind the Buildout
Lockheed Martin: THAAD, PAC-3, PrSM, and the Camden Node
Lockheed Martin is one of the clearest examples of the new model.
In January 2026, Lockheed announced a framework agreement with the Department of War to quadruple THAAD interceptor production from 96 interceptors per year to 400 interceptors per year. The same announcement tied the THAAD ramp to earlier PAC-3 Missile Segment Enhancement production acceleration and a new Munitions Acceleration Center in Camden, Arkansas. [3]
That is not a small adjustment. Moving from 96 to 400 interceptors per year is a structural production shift. It requires workforce planning, supplier expansion, floor-space utilization, advanced manufacturing, testing capacity, and long-term confidence that the demand will exist.
Lockheed also stated that it had invested more than $7 billion since Trump’s first term to expand capacity for priority systems, including roughly $2 billion dedicated to accelerating munitions production. The company said it planned additional multibillion-dollar investment over the next three years to expand production and build or modernize more than 20 facilities across Arkansas, Alabama, Florida, Massachusetts, and Texas. [3]
That is the map underneath the map. Camden, Arkansas is not just a dot. It is part of the missile-production geography of the United States. The question is no longer only what weapons the U.S. has in inventory. The question is what places, suppliers, workers, and machines can keep replacing those weapons once the inventory is consumed.
RTX / Raytheon: Tomahawk, AMRAAM, SM-3, and SM-6
RTX’s Raytheon business announced five framework agreements in February 2026 to expand production of Tomahawk, AMRAAM, SM-3 Block IB, SM-3 Block IIA, and SM-6 systems.
RTX said the agreements could run up to seven years and would increase annual production of Tomahawks to more than 1,000, AMRAAMs to at least 1,900, and SM-6 to more than 500. The company also said many of these munitions would grow by two to four times existing production rates. [4]
Reuters reported the same shift in practical terms: Raytheon’s Tomahawk production would move from roughly 60 per year for the U.S. to eventually 1,000 units annually, while SM-6 production would grow to more than 500 from about 125. [5]
This is where the phrase “war economy” becomes more than rhetoric. A country that expects low-intensity operations does not need to radically expand precision munition output. A country preparing for sustained high-intensity conflict, deterrence failure, or simultaneous theaters does.
Tomahawks, AMRAAMs, SM-3s, and SM-6s are not symbolic products. They are the consumable backbone of modern air, naval, missile-defense, and long-range strike operations. They are the type of weapons that disappear fast in a real conflict. Once they are fired, the relevant question becomes: how fast can the industrial base replace them?
That replacement rate is the war economy.
Honeywell: The Supplier Layer Becomes Strategic
The Honeywell agreement is important because it shows the strategy moving below the prime contractor layer.
In March 2026, Honeywell Aerospace announced a supplier framework agreement with the Department of War that includes a $500 million multi-year investment to upgrade production capacity. The production ramp includes navigation systems, Assure electronic control and actuation systems, and electronic warfare solutions. [6]
This matters because the defense industrial base does not fail only at the final assembly line. It fails inside the supplier stack. A missile can be delayed because one specialized component, actuator, chip, sensor, casing, motor, or test process cannot scale.
That is why the Honeywell deal is more important than it may look. It tells you the system understands the visible prime contractor is not the whole machine.
That is pure Pattern Nexus. The visible system is the prime. The controlling layer is often the supplier node underneath it.
L3Harris: Solid Rocket Motors as a Strategic Bottleneck
L3Harris is another major piece of this buildout.
In November 2025, L3Harris broke ground on the Arkansas Advanced Propulsion Facilities in Camden. The campus includes more than 20 buildings across 110 acres and is expected to increase large solid rocket motor manufacturing capacity six-fold. The company said the campus would add 230,000 square feet of manufacturing and office space to the broader 2,000-acre Camden site, bringing total manufacturing square footage to more than 1.5 million. It also described more than $400 million invested in the campus and more than half a billion dollars across major solid rocket motor sites nationally. [7]
Solid rocket motors are one of the easiest places to see the real constraints. You can announce missile demand all day. You cannot produce missiles at scale without propulsion. If rocket motor capacity is constrained, the whole missile stack is constrained.
This is why “industrial base” is not a vague phrase. It is physical. It is land, buildings, explosive handling, environmental permitting, workforce skill, safety rules, robotic manufacturing, quality inspection, and the ability to produce at repeatable volume without blowing up the supply chain or the factory.
Why the Map Matters
The most important part of the “Arsenal of Freedom” image is not the headline number. It is the geography.
The chart shows a national distribution of defense investment. That matters because defense production is not just an economic sector. It is political infrastructure.
Once factories, jobs, suppliers, training programs, local tax bases, and state economic development strategies become tied to defense production, the war economy becomes embedded into domestic politics.
This is how a temporary policy becomes a permanent constituency.
Factories create jobs. Jobs create local support. Local support creates congressional pressure. Congressional pressure protects contracts. Contracts justify more investment. More investment deepens the supplier base. The supplier base becomes too strategically important to shrink.
That is the flywheel.
That is why the map shows states and cities. It is not just telling the public where the money is going. It is showing how the defense economy is being distributed across the country so it becomes politically durable.
In PN terms, this is how the system turns procurement into a permission stack:
- Narrative permission: America must rebuild the arsenal.
- Budget permission: multi-year procurement and larger defense top lines justify spending.
- Industrial permission: companies expand factories because demand looks durable.
- Political permission: jobs and facilities spread across states and cities.
- Strategic permission: peer-adversary competition makes delay look dangerous.
- Capital permission: private money moves because government demand reduces risk.
That is the control system. Nobody has to say it out loud. The incentives say it for them.
Private Capital, Public Demand
The phrase “private investment” is doing a lot of work here.
The chart and public messaging frame the buildout as private companies investing their own money. Technically, that can be true. But the reason they are investing is not spontaneous market optimism. It is public demand being translated into private capital allocation.
This is the modern model. The state does not need to directly fund every brick, tool, robot, building, and job. It only has to make the future demand credible enough that companies treat expansion as rational.
That is exactly what long-term procurement does. It compresses uncertainty. It tells companies that the risk of underbuilding is now greater than the risk of overbuilding.
This is also why the language around “their capital, not Uncle Sam’s” needs to be read carefully. The capital may be private. The demand is public. The strategic direction is public. The funding expectation is public. The war-risk narrative is public. The end customer is often public.
So yes, private capital is moving.
But it is moving inside a government-shaped corridor.
That is not a criticism by itself. It is how industrial policy works. It is also how the war economy scales without needing to look like direct nationalization.
The Real Bottleneck: Supply Chains
The most dangerous mistake in this entire conversation is assuming the United States can solve military readiness with money alone.
Money is the permission layer.
It is not the production layer.
You can allocate billions of dollars and still run into shortages of motors, castings, energetics, chips, skilled machinists, engineers, test ranges, explosives-handling capacity, long-lead materials, certified suppliers, and factory floor space.
That is why the new strategy is focused so heavily on facilities and suppliers.
The United States has spent decades optimizing around efficiency, global supply chains, lean inventories, just-in-time assumptions, financial engineering, and the belief that high-end war would either be short or avoided.
That model does not hold up in a world of drone swarms, missile salvos, air-defense depletion, Red Sea disruptions, Ukraine-style artillery burn rates, Middle East escalation, Taiwan contingencies, and peer competition.
The system is now learning the old lesson again: finance sits on top of physical throughput.
That is why rocket motors matter. That is why actuators matter. That is why navigation systems matter. That is why facilities in Arkansas, Arizona, Alabama, Massachusetts, Texas, Florida, and other states matter.
The map is not decorative. It is a production map of future military optionality.
The Macro Layer
This buildout also has a macro side that most political coverage misses.
A defense-industrial expansion touches labor markets, construction, heavy equipment, energy demand, steel, electronics, rare materials, logistics, insurance, local housing, state-level economic development, and federal spending expectations.
It is not isolated from the broader economy.
Factories require power. Expansion requires contractors. Skilled labor has to come from somewhere. Supply chains need inputs. If defense, AI data centers, grid expansion, reshoring, semiconductor policy, and energy infrastructure are all competing for overlapping industrial capacity, the result is not clean growth. It is bottlenecked growth.
That is the real 2026 macro story: multiple national priorities are trying to scale through the same physical economy.
AI wants power, land, cooling, chips, transformers, data centers, and grid access. Defense wants rocket motors, munitions, electronics, machine tools, skilled labor, and production redundancy. Energy wants turbines, gas infrastructure, nuclear components, transmission, and storage. Housing wants labor, materials, financing, and permitting.
The state wants resilience, but resilience is not free.
It consumes capacity.
This is why inflation can stay structurally sticky even when headline demand looks weak. The system is not simply overheating from consumers buying too much. It is being reindustrialized under stress.
That kind of economy behaves differently. It can look weak at the household level while remaining hot at the strategic procurement level. It can have consumer strain and industrial acceleration at the same time. It can have layoffs in one sector and hiring in another. It can have recession-like conditions for ordinary people while the defense, energy, AI, and infrastructure layers keep absorbing capital.
That is not a normal business cycle.
That is a controlled reallocation cycle.
The Risk Layer
The “Arsenal of Freedom” buildout is real, but it is not risk-free.
The first risk is execution. Announcing framework agreements is not the same thing as delivering output. Factories take time. Suppliers take time. Workers take time. Tooling takes time. Testing takes time. Regulatory and safety constraints take time. The fastest press release in the world cannot instantly create a qualified industrial base.
The second risk is political durability. Multi-year procurement depends on Congress, budgets, appropriations, and future administrations. If political support fractures, the demand signal weakens. If the demand signal weakens, private capital may slow down.
The third risk is over-concentration. A few strategic nodes can become more important than they look. If too much capacity depends on specific plants, suppliers, states, transportation routes, or skilled-labor pools, then the system remains fragile even after expansion.
The fourth risk is cost. Defense production does not happen in a vacuum. It competes with civilian manufacturing, infrastructure, AI buildout, energy projects, and housing for real resources. The public may hear “jobs” and “investment,” but the deeper macro consequence is competition for capacity.
The fifth risk is strategic escalation. A country does not build a wartime production base for no reason. The more the system prepares for sustained conflict, the more conflict preparation becomes normalized. Deterrence can prevent war, but the infrastructure of deterrence also shapes political expectations.
That does not mean the buildout is wrong. It means it should be understood clearly.
A war economy is not only about what it produces. It is about what it makes politically, financially, and culturally normal.
Pattern Nexus Lens
The “Arsenal of Freedom” chart is not just a chart.
It is a control map.
It shows the public version of a deeper systems transition. The United States is not waiting for a formal war declaration to rebuild war-production capacity. It is using procurement agreements, private capital, supplier commitments, facility expansion, and distributed political incentives to convert the defense industrial base from a slow procurement machine into a faster production network.
This is the same pattern that appears across the entire global system right now:
- Energy is being reframed as national security.
- AI compute is being reframed as strategic infrastructure.
- Supply chains are being reframed as sovereignty.
- Data centers are being reframed as industrial assets.
- Defense production is being reframed as economic revitalization.
- Private capital is being pulled into state-shaped corridors.
The world is not dividing into neat categories. It is merging layers.
Defense is not separate from markets. Markets are not separate from energy. Energy is not separate from AI. AI is not separate from geopolitics. Geopolitics is not separate from manufacturing. Manufacturing is not separate from labor, debt, inflation, and political control.
The chart is called “The Arsenal of Freedom.”
The PN reading is more direct:
This is the industrial permission stack of a war economy being assembled in public.
Not hidden.
Not theoretical.
Not someday.
Already moving.
Sources
- Peterson and Schriever Space Force Base / War Department Graphic — Arsenal of Freedom public-domain graphic
- Reuters — Pentagon reaches deals with defense firms to expand munitions production
- Lockheed Martin — Framework agreement to quadruple THAAD interceptor production capacity
- RTX / Raytheon — Five framework agreements to expand Tomahawk, AMRAAM, SM-3, and SM-6 production
- Reuters — Raytheon secures deal to build thousands of missiles, including Tomahawks
- Honeywell Aerospace — Department of War agreement to accelerate defense technology production
- L3Harris — Arkansas Advanced Propulsion Facilities and solid rocket motor expansion
Pattern Nexus note: The Arsenal of Freedom chart should be read as a systems signal, not only a political graphic. Its real importance is the alignment of procurement, capital, factories, suppliers, labor, geography, and political durability into a defense-industrial cycle.
Frequently Asked Questions
Tepkiniz Nedir?
 Beğen
0
Beğen
0
 Beğenmiyorum
0
Beğenmiyorum
0
 Aşk
0
Aşk
0
 Komik
0
Komik
0
 Vay
0
Vay
0
 Üzgün
0
Üzgün
0
 Öfkeli
0
Öfkeli
0

Founder of Pattern Nexus. I research markets, macro, geopolitics, AI, history, ancient systems, and the patterns most people overlook. I’m also building Market Radar, a trading scanner designed to read pressure, risk, confirmation, and setup quality before chasing a move. Pattern Nexus is where I connect the dots between data, history, technology, and the bigger system playing out around us.





Yorumlar (0)