

The Oil Inventory War Machine: How Long the Global Buffer Can Hold
A full Pattern Nexus reconstruction of U.S. and global oil inventories from the 1970s through the 2026 war shock, including original regressions, depletion scenarios, strategic reserves, refinery constraints, inflation, growth, rates and the path forward. Meta keywords: oil inventory, global oil stocks, U.S. crude inventories, Strategic Petroleum Reserve, SPR, Strait of Hormuz, Iran war, oil shock, petroleum products, diesel inventories, refinery capacity, inflation, CPI, recession, Treasury yields, liquidity, war economy, energy security, Pattern Nexus


The world does not fail when the last barrel disappears
- Global observed oil stocks began 2026 near 8.21 billion barrels, but that number is not eight billion freely usable barrels. About half was in OECD countries, 15% was Chinese crude, 25% was oil on water and the remainder was visible non-OECD inventory. Geography, ownership, crude grade, refinery configuration and delivery time determine what can actually replace a missing flow.[12]
- The 2026 shock attacked flow and location at the same time. The IEA estimated nearly 20 million barrels per day of crude and product exports were disrupted in March. EIA later estimated global inventories fell by 5.1 million barrels per day in the second quarter and would continue drawing by 2.2 million barrels per day in the third.[12][16]
- June's 21-million-barrel headline build was weaker than it looked. Oil on water rose 117 million barrels while onshore stocks fell about 96 million. A barrel moving at sea is real supply, but it is not the same thing as diesel beside a distribution center, jet fuel beside an airport or compatible crude beside a refinery.[15]
- The U.S. still has a large buffer, but it is less comfortable than an absolute barrel count implies. EIA monthly data through May show approximately 1.227 billion barrels of commercial crude and products excluding the SPR, 425 million barrels of commercial crude and 355 million barrels in the SPR. U.S. field production was about 13.7 million barrels per day.[1][4]
- The original regression supports the inventory-price mechanism. Across 474 monthly observations from January 1987 through June 2026, each one-percentage-point rise in year-over-year commercial petroleum inventory growth is associated with a 3.86-percentage-point decline in year-over-year WTI inflation. The model explains 41.7% of variation, with the coefficient significant using 12-month Newey–West errors.
- The central forecast is not “the world runs out.” It is a sequence: recurring disruption prevents rebuilding; governments release strategic stock; crude prices briefly soften as recession destroys demand; product markets remain tight; inflation stops falling cleanly; long yields retain a war-and-supply premium; and physical control becomes more important than nominal price.
This is not a chart of weekly crude alone. It separates commercial crude, refined products, strategic reserves, compulsory stocks, floating barrels, refinery throughput and actual days of deliverable cover. It reconstructs U.S. history, audits the current global number, tests the inventory-price and price-economy relationships, and then places the result inside the Pattern Nexus framework: war is logistics; oil is stored time; liquidity can finance a shortage but cannot manufacture the missing molecule.
Oil inventory is civilization's time account
Production is a flow. Inventory is accumulated flow carried forward through time. When a war, blockade, refinery outage, sanctions regime or shipping shock interrupts the flow, inventory becomes the bridge between the economy that existed yesterday and the economy that can still operate tomorrow.
That bridge is not uniform. Crude cannot fuel a truck. Gasoline cannot substitute for jet fuel. Heavy sour crude cannot always replace light sweet crude without changing refinery yields. Oil stored behind a threatened chokepoint may raise a global total while being unavailable to the importing region that needs it. A strategic reserve may exist physically but still require authorization, compatible pipeline access, refinery capacity and time.
The Pattern Nexus conclusion is therefore sharper than “inventories are falling.” The system is converting a continuous energy flow into a finite political buffer. If durable peace restores the flow, the buffer can be rebuilt. If disruption becomes cyclical, every ceasefire is used to refill tanks rather than normalize the economy. The market may repeatedly price peace before the physical system has actually repaired.
There is no single oil-inventory number
“Oil inventory” is commonly used as if every barrel were equivalent. It is not. The system contains at least five economically different buffers.
Commercial crude
Working feedstock held at refineries, tank farms and pipelines. It keeps refinery runs stable and absorbs timing differences between production, imports and processing.
Refined products
Gasoline, diesel, jet fuel, heating oil, LPG and other products. These are closest to final use and can become scarce even while crude looks abundant.
Strategic reserves
Government-controlled emergency oil. It can replace flow temporarily but is finite, policy-controlled and subject to location and refinery constraints.
Compulsory industry stocks
Private stocks held because governments require them. They may be physically commercial but legally reserved for emergency obligations.
Oil on water
Cargo in transit or floating storage. It is part of observed global supply, but its destination, arrival time, sanctions status and quality matter.
Unobserved and estimated stocks
Non-OECD inventories are less transparent. Analysts infer part of the balance from production, trade, refinery runs, satellite data and tanker tracking.
The IEA's 90-day rule is based on net imports, not total national consumption. It also applies deductions for naphtha yield and unavailable inventory such as tank bottoms. That is a formal recognition that a gross barrel count overstates emergency usability.[11]
The 1970s taught governments that markets cannot instantly replace geopolitically lost flow
The modern inventory regime was built from the memory of the 1973–74 embargo and the 1979 Iranian shock. In both cases, the economic injury was larger than the missing barrels alone. Consumers hoarded. Governments rationed. Refinery and distribution mismatches amplified shortages. Inflation expectations moved. Central banks faced the impossible combination of higher prices and weaker real activity.
The IEA was created in 1974, and its members later formalized a minimum emergency-stock obligation equal to at least 90 days of net imports. The United States began filling the Strategic Petroleum Reserve in 1977. The reserve rose from 2.6 million barrels in October 1977 to more than 500 million by the late 1980s, eventually reaching much higher levels before the releases of the 2020s.[3][10]
But the historical lesson was never that 90 days made a country invulnerable. The rule was designed to buy coordination time: redirect cargoes, increase production elsewhere, suppress nonessential demand, prioritize critical services and repair the disrupted route. A reserve is a bridge to a solution. If no solution arrives, the bridge is consumed.
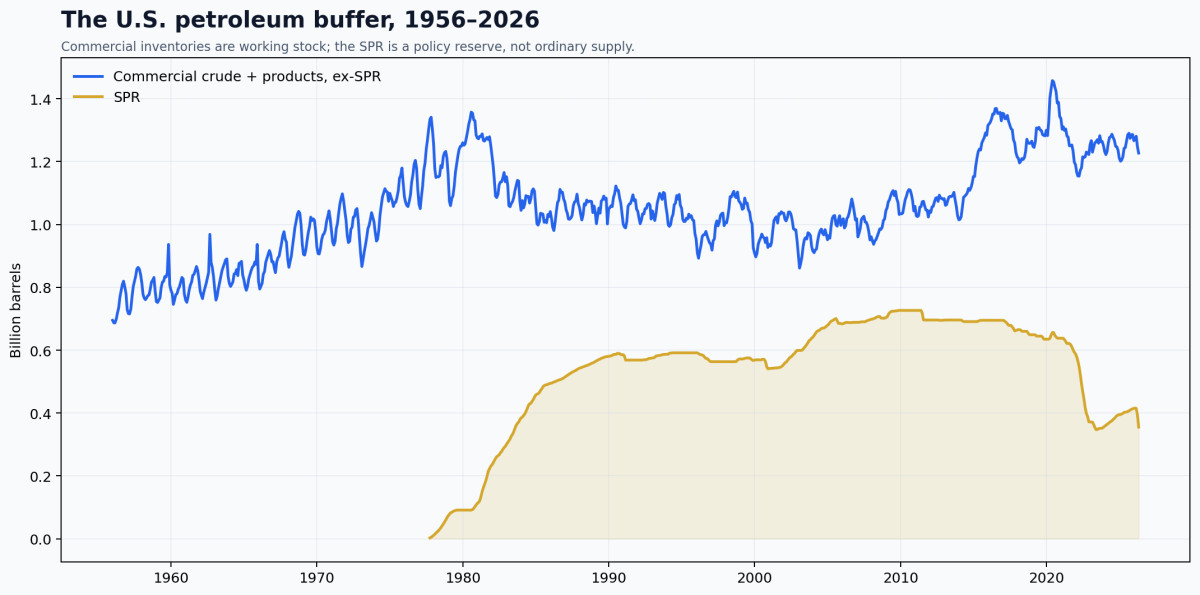
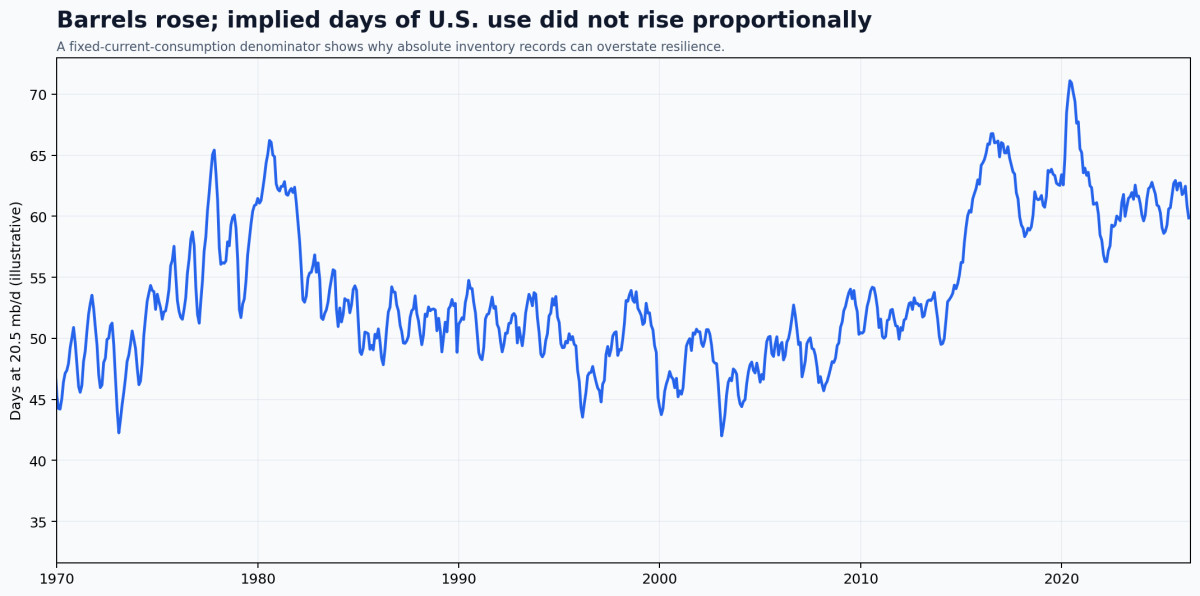
The long chart exposes a critical visual error. Absolute inventories generally rose as the U.S. economy, vehicle fleet, petrochemical complex and distribution system expanded. That does not mean the buffer rose by the same amount relative to consumption. A larger system requires more working stock simply to operate.
The U.S. is better supplied than in the 1970s—and still not independent of the global barrel
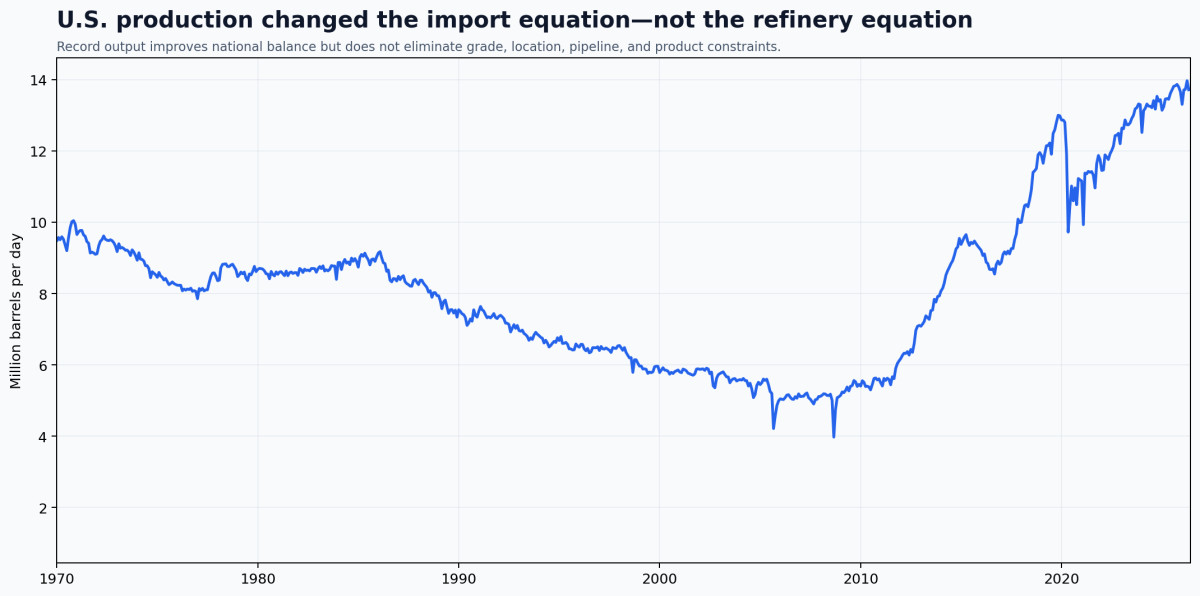
U.S. field production transformed the balance. Monthly output was about 13.7 million barrels per day in May 2026, compared with the post-1970 decline and the trough before the shale expansion. That reduces net import dependence and gives the U.S. enormous strategic depth.[4]
It does not create autarky. U.S. refineries were built around different crude slates. Gulf Coast plants can process heavy and sour grades that domestic light-tight-oil production does not perfectly replace. The U.S. simultaneously imports and exports because location, quality, refinery configuration, pipeline capacity and commercial economics determine the useful barrel.
As of May, EIA reported approximately 425 million barrels of commercial crude, 355 million barrels in the SPR and 1.227 billion barrels of total commercial crude and petroleum products excluding the SPR. Those categories must not be added and described as all readily burnable supply: commercial crude is already included inside the commercial crude-and-products total, and much of the total is required working inventory.
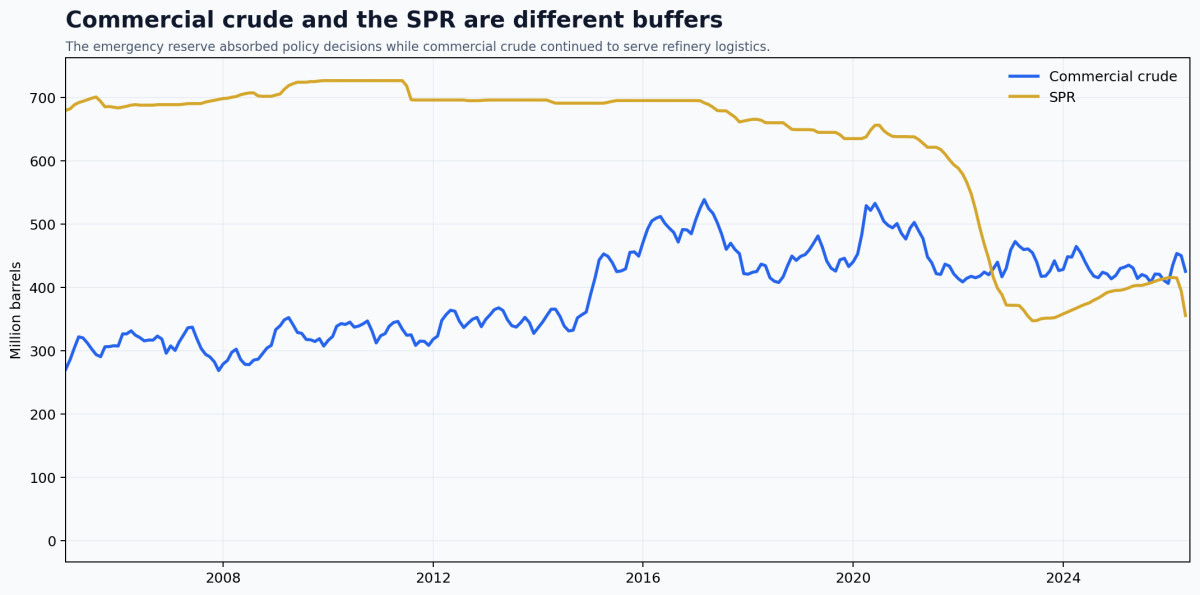
The 2022–26 period matters because government releases converted part of the strategic buffer into market supply. During the 2026 crisis, April and May monthly EIA data show the SPR falling from roughly 415 million barrels in March to 355 million in May. A release can lower the immediate price and support refinery inputs. It also transfers resilience from the future into the present.
The global number is largest where the data is weakest
OECD inventory data are relatively mature. IEA monthly stock series reach back to 1988, with quarterly observations available from 1984–87. U.S. commercial petroleum history goes much farther. The full global balance is less direct because many non-OECD governments and companies do not publish complete, timely tank data.[9]
Analysts therefore reconstruct unobserved stock change as a balancing item: production plus imports minus refinery runs, exports and consumption. Tanker tracking and satellite observations improve the estimate but do not eliminate uncertainty. This matters most during war, when sanctions, transshipment, floating storage, shut-in production and damaged reporting systems grow simultaneously.
The IEA assessed January 2026 observed stocks at 8.21 billion barrels, the highest since February 2021. The composition was roughly:
| January 2026 component | Share | Approximate barrels | Primary limitation |
|---|---|---|---|
| OECD stocks | 50% | 4.105 billion | Includes industry and government stocks across many locations and products |
| Chinese crude | 15% | 1.232 billion | National control, limited transparency and not freely available globally |
| Oil on water | 25% | 2.053 billion | Transit time, destination, sanctions, grade and insurance risk |
| Other visible non-OECD | 10% | 0.821 billion | Uneven transparency, infrastructure and state control |
Within the OECD total, the IEA identified about 1.25 billion barrels held by governments for emergency purposes and another 600 million barrels of industry stock held under government obligation. Those barrels improve resilience, but they are not ordinary discretionary inventory.[12]
This is why the world can appear well stocked and still experience product shortages. A crude cargo held offshore cannot instantly repair a diesel deficit. A sanctioned cargo may clear at a discount while compliant refiners pay a premium. A tank filling inside the Gulf during a chokepoint closure can increase local measured inventory because producers cannot export, while importing countries draw their own tanks down.
The chokepoint shock turned inventory from a background variable into the clock
When the conflict began on February 28, the shock was not limited to damaged production. Tanker traffic through the Strait of Hormuz nearly stopped. The IEA estimated that close to 20 million barrels per day of crude and product exports were disrupted, at least 8 million barrels per day of crude production was curtailed, another 2 million barrels per day of condensate and NGL output was shut in, and more than 3 million barrels per day of refining capacity had already stopped.[12]
That combination creates a two-sided storage crisis. Exporters fill tanks because cargoes cannot leave, forcing production shut-ins. Importers empty tanks because replacement cargoes cannot arrive. The same event produces surplus barrels in the wrong place and scarcity in the right place.
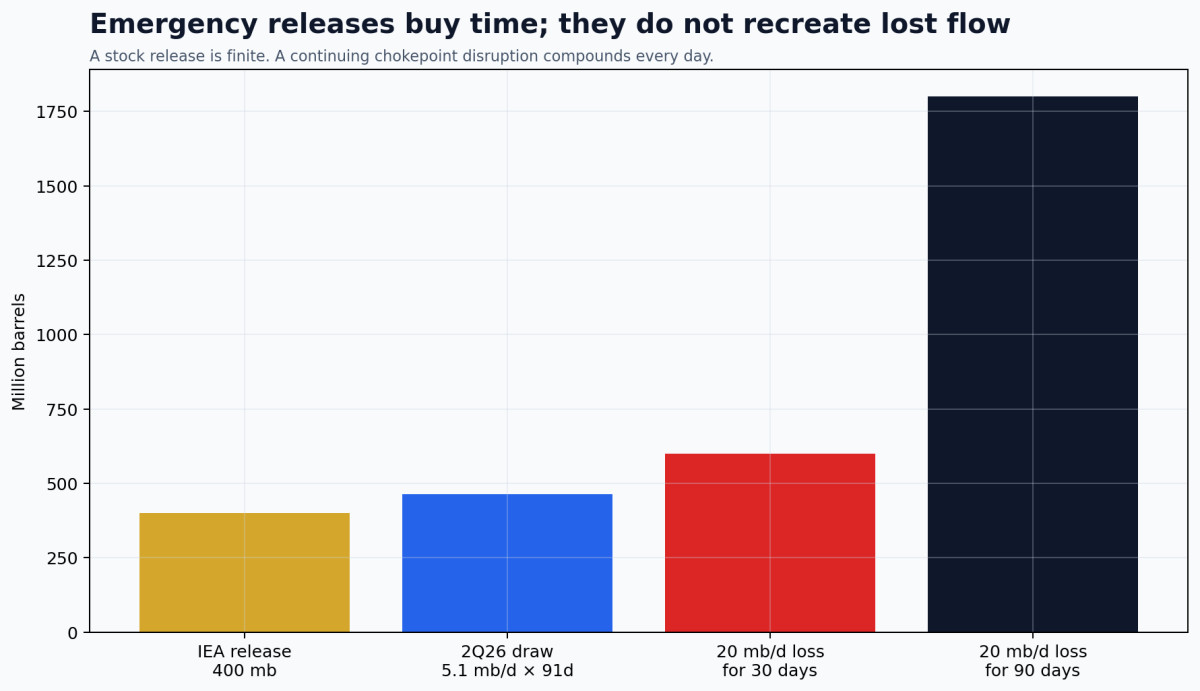
The IEA members authorized a 400-million-barrel emergency release in March. That sounds enormous—and it is—but at a 20-million-barrel-per-day disrupted-export rate it equals only 20 days of gross flow. Releases do not need to replace every disrupted barrel because demand falls, routes adjust and alternative producers respond. The comparison still shows the central constraint: a stock is finite; a blocked flow compounds.
By March, global stocks outside the Middle East Gulf fell sharply while floating and onshore stocks inside the Gulf rose. April data showed further onshore draws. May recorded another large decline. In June, observed inventory finally rose 21 million barrels—but oil on water increased 117 million while onshore tanks lost about 96 million. That is a logistics recovery, not yet a full inventory recovery.[13][14][15]
EIA estimates the global balance drew 5.1 million barrels per day in the second quarter and will draw another 2.2 million barrels per day in the third. It then forecasts builds of 2.7 million barrels per day in the fourth quarter and 5 million in 2027, with Brent averaging $70 in the fourth quarter and $65 in 2027. That forecast requires production and trade normalization.[16]
What the U.S. monthly history actually supports
The primary model uses monthly EIA commercial crude-and-product inventories excluding the SPR and monthly WTI from January 1987 through June 2026. Both are transformed into year-over-year percentage changes to reduce trend and seasonality. The specification is intentionally simple:
WTI inflation = constant + β × commercial inventory growth + error
The estimated β is −3.86. A one-percentage-point increase in inventory growth is associated with a 3.86-percentage-point decline in year-over-year WTI price change. R² is 0.417. The coefficient remains significant after correcting standard errors for heteroskedasticity and autocorrelation across 12 monthly lags.
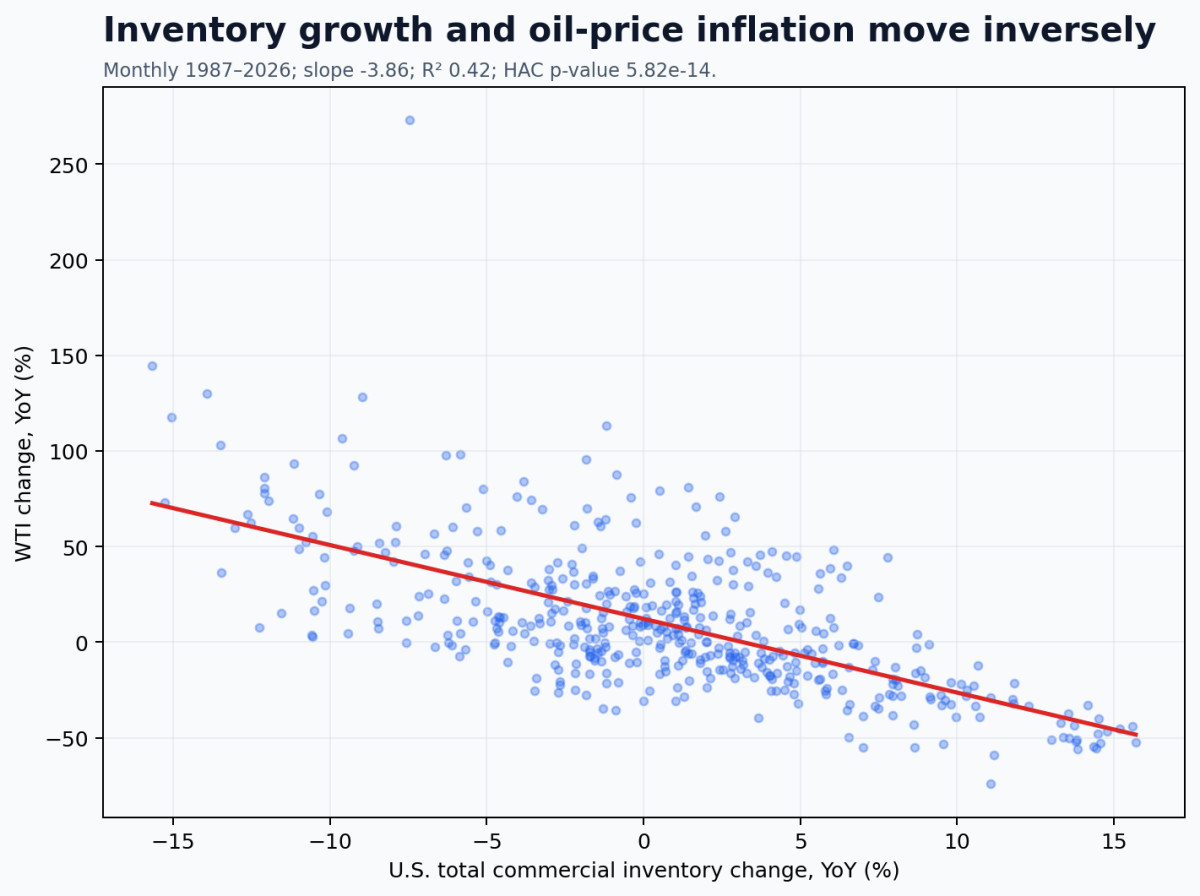
The regression proves a meaningful historical inverse relationship. It does not prove inventories independently cause 42% of oil prices. The system is simultaneous: a supply disruption raises price and draws inventory; a recession lowers demand, builds inventory and lowers price; producers respond to price; refiners change throughput; policy releases move both inventory and price.
That simultaneity is not a reason to discard the result. It is the mechanism. Inventory is where supply, demand, policy and logistics reconcile.
Oil to inflation
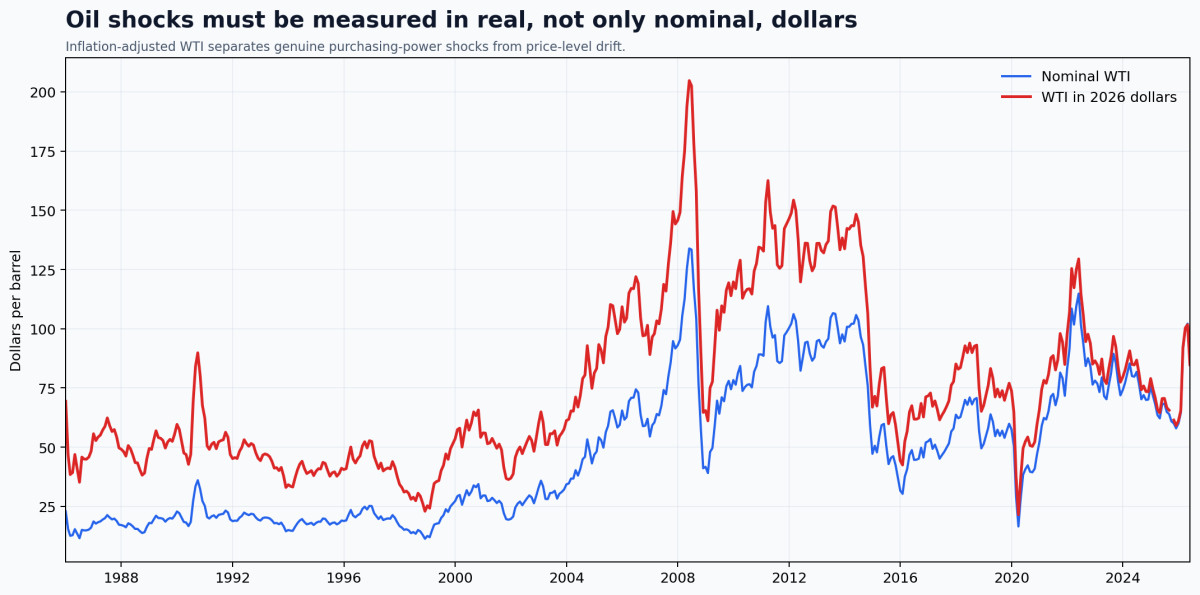
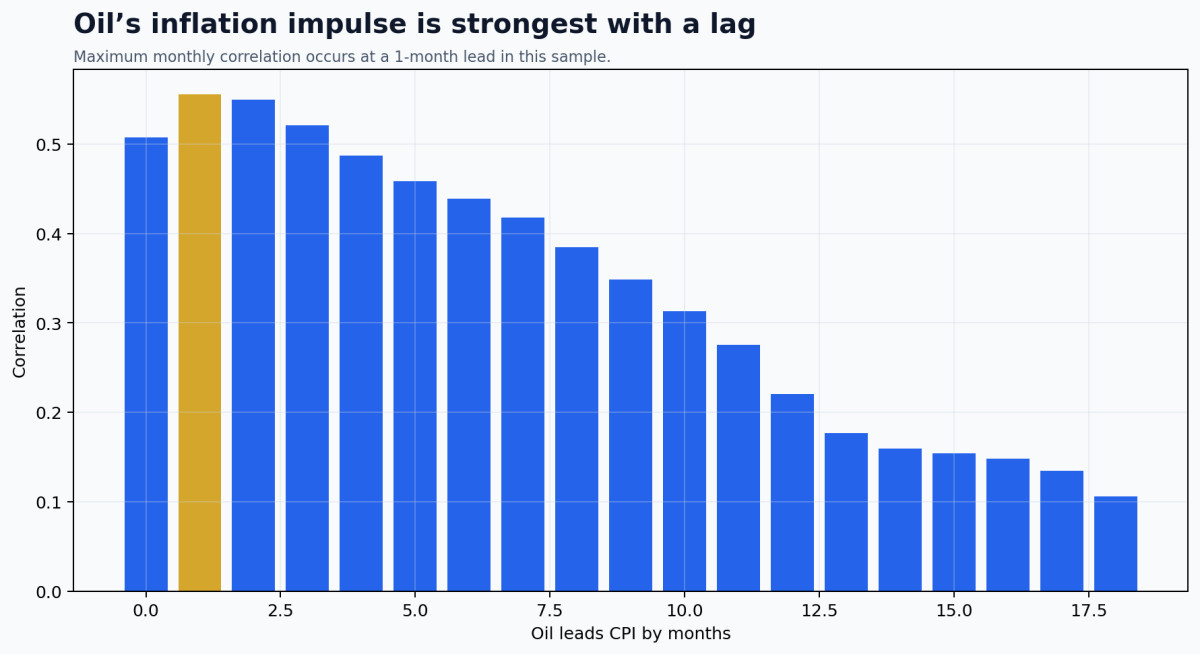
Monthly lead-lag testing from 1987 forward finds the correlation between year-over-year WTI change and CPI inflation peaks at about a one-month oil lead, near 0.56. Direct gasoline and energy components respond quickly; broader goods and services transmit through freight, petrochemicals, utilities, food production and expectations with different delays.
Oil to real activity
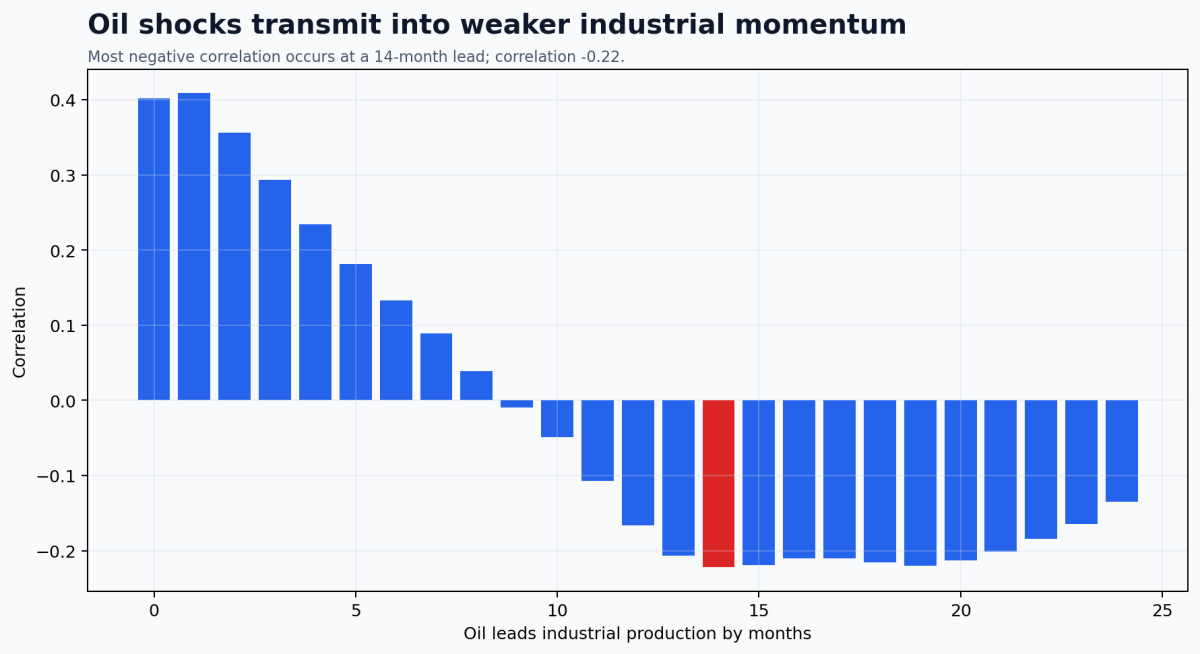
The most negative simple correlation between oil-price inflation and industrial-production growth appears with oil leading by approximately 14 months, at −0.22. The magnitude is smaller than the CPI relationship because production also responds to monetary policy, credit, fiscal policy, technology, inventories and foreign demand. The timing nevertheless fits the Pattern Nexus chain: businesses first absorb and pass through costs; consumers shift spending; financing stays tighter; capital plans weaken; output responds later.
Oil is not merely inside CPI; it changes the policy set
Households
Fuel is a high-frequency tax on mobility. A household may delay furniture, travel, repairs or discretionary purchases when gasoline and utilities rise, but it often cannot immediately change the commute, vehicle or heating system. The spending response therefore lands on other sectors.
Industry and agriculture
Diesel powers freight, mining, construction and farm equipment. Oil also supplies petrochemical feedstocks used in plastics, fertilizers, solvents, synthetic fibers, coatings, medical products and packaging. The barrel moves through the economy both as fuel and material.
Inflation and the Fed
A central bank can suppress demand; it cannot reopen a strait or repair a refinery. Tightening into a supply shock may slow second-round inflation, but it also deepens the real-economy cost. Easing may support credit and employment while risking a weaker currency and higher commodity pass-through. Oil narrows the Fed's option set.
The 10-year and fiscal channel
This connects directly to the earlier Pattern Nexus long-end framework. Persistent oil risk raises headline inflation uncertainty, term premium and the probability that the Fed must hold policy restrictive. At the same time, war spending, reserve replenishment, consumer relief and recession deficits increase Treasury supply. The long end can therefore stay elevated even when growth deteriorates.
Liquidity
Liquidity can bid up claims on scarce barrels, finance emergency imports, support producers and prevent a credit seizure. It cannot create refinery capacity, tanker insurance, port access or physical crude. When monetary liquidity rises against constrained energy flow, the system may stabilize financially while repricing physically scarce assets upward. That is the same hard-asset framework already developed across Pattern Nexus: financial abundance does not remove physical scarcity; it can capitalize it.
How long do we have if the flow breaks again?
The naïve global calculation divides 8.21 billion observed barrels by roughly 100 million barrels per day of consumption and returns about 82 days. That number is mathematically correct and operationally wrong. The system never attempts to replace all production from inventory. Nor can all observed stock be consumed: pipelines require line fill, tanks retain bottoms, refineries require minimum feedstock, governments control reserves, and many barrels are already moving toward an expected buyer.
The correct question is: how quickly does the disrupted flow consume the accessible buffer in the affected region and product?
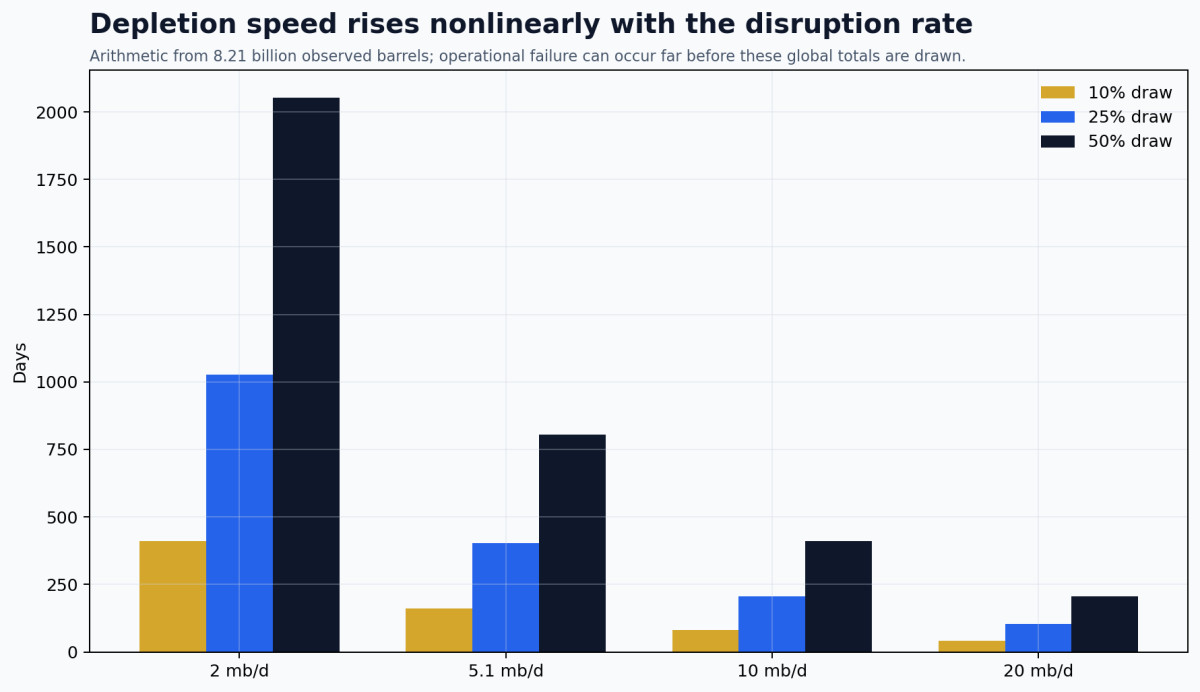
| Sustained net draw | 10% of 8.21bn | 25% | 50% | Interpretation |
|---|---|---|---|---|
| 2.0 mb/d | 411 days | 1,026 days | 2,053 days | Manageable globally, but still capable of regional product stress |
| 5.1 mb/d | 161 days | 403 days | 805 days | Approximately the EIA-estimated 2Q26 draw rate |
| 10 mb/d | 82 days | 205 days | 411 days | Major war shock; rapid government intervention and demand destruction |
| 20 mb/d | 41 days | 103 days | 205 days | Gross Hormuz-scale disruption; emergency system, not normal market |
These rows are not forecasts. They demonstrate scale. At 5.1 million barrels per day, a 10% draw of the January observed total takes roughly five months. At 20 million barrels per day, it takes only six weeks. But a critical importer with 30 days of usable diesel does not care that crude is accumulating behind the blocked chokepoint.
“Running out” therefore arrives as a ladder:
- Prompt spreads and regional differentials signal scarcity.
- Freight, insurance and tanker rates rise.
- Governments release reserves and relax fuel specifications.
- Refiners change crude slates and maximize scarce-product yields.
- Exports are restricted; strategic users receive priority.
- Air travel, petrochemicals and discretionary transport are curtailed.
- Demand destruction lowers price even while physical living standards decline.
Three paths from August 2026
Base case: unstable normalization and slow rebuilding — 55%
Transit improves enough for Middle Eastern output and exports to recover, but repeated security incidents, refinery damage, insurance costs and government restocking prevent an immediate return to the old equilibrium. Onshore stocks rebuild more slowly than headline oil-on-water data imply. Brent remains volatile around a lower post-shock range rather than returning immediately to prewar complacency. Inflation decelerates unevenly, and the 10-year retains part of the war and fiscal premium.
Bullish physical-risk case: renewed chokepoint impairment — 30%
Renewed hostilities reduce transit, attacks constrain refineries or pipelines, or insurers again withdraw capacity. Global stocks resume drawing above 4–5 million barrels per day. Governments release additional reserves. Crude and especially diesel, jet and LPG differentials widen. Headline inflation rises while real activity weakens. The Fed remains trapped between supply inflation and growth damage; long yields initially resist easing, then may fall only after recession becomes dominant.
Bearish oil-price case: durable peace plus oversupply — 15%
Flows normalize quickly, damaged capacity returns, non-OPEC supply expands and the EIA's projected 2.7-million-barrel-per-day fourth-quarter build becomes visible. Restocking absorbs part of the surplus but cannot prevent price weakness. Brent moves toward or below the EIA's $65 2027 average. The oil impulse becomes disinflationary, though reserve rebuilding and fiscal supply still matter for the long end.
The probabilities are Pattern Nexus judgments as of August 2, not market-implied probabilities. The base case gives more weight to physical repair time and renewed hostility than the smooth-normalization path embedded in official forecasts.
The signals that will confirm or break the thesis
| Signal | Bullish oil / worsening buffer | Bearish oil / healing buffer |
|---|---|---|
| Global observed stocks | Renewed monthly draws above 100 mb | Sustained builds with onshore participation |
| Oil on water vs onshore | Floating barrels rise while land tanks draw | Waterborne surge converts into destination-country stocks |
| OECD industry stocks | Below five-year range after government releases | Commercial rebuilding without further releases |
| China crude stocks | Continued draws or reduced imports | Rebuilding alongside normal refinery runs |
| Hormuz exports | Below prewar 24 mb/d range or renewed collapse | Stable return toward prewar volumes |
| Refined products | Diesel/gasoline cracks stay high despite weaker crude | Cracks normalize as export refineries restart |
| SPR and government stocks | Additional emergency draw | Scheduled replenishment |
| Curve structure | Backwardation and strong prompt spreads | Contango consistent with storage rebuild |
| Macro | CPI stalls, industrial production rolls over | Energy disinflation without material demand destruction |
From embargo vulnerability to the shale-and-sanctions system
The 1970s: scarcity becomes national-security policy
The first regime was defined by import vulnerability and concentrated spare capacity. The embargo demonstrated that a relatively small interruption could produce a much larger social reaction when drivers expected stations to run dry. The Iranian Revolution then showed that political loss inside one producer could reprice the entire marginal barrel. The policy response—strategic reserves, IEA coordination, fuel efficiency and alternative supply—was an attempt to convert surprise into managed time.
Inventory rose partly because the operating system grew and partly because governments deliberately added emergency stock. That distinction matters when comparing the 1970s with today. A gross U.S. total that includes a newly growing SPR does not describe the same commercial buffer as the ex-SPR series.
The 1980s and 1990s: spare capacity and globalization
Demand conservation, North Sea and Alaskan production, Saudi spare capacity and expanding trade routes reduced the monopoly power of any single disruption. The 1986 price collapse revealed the other side of the inventory equation: surplus flow forces barrels into storage until price falls enough to destroy supply or revive consumption.
The Gulf War still produced a rapid price spike, but coordinated inventories and spare capacity prevented a 1970s-scale physical breakdown. This period created the modern assumption that every geopolitical oil shock is temporary because Saudi supply, strategic reserves or recession will close the balance.
The 2000s: China and the loss of comfortable spare capacity
China's industrialization accelerated the demand call on global supply. Inventory became more valuable because demand growth absorbed spare capacity. The 2008 peak was simultaneously an energy and credit event: high oil prices transferred income away from consumers, while the financial system was already overleveraged. When credit collapsed, demand and price collapsed too. The barrel did not become physically worthless; the marginal buyer lost financing and economic activity.
The 2010s: shale creates a faster supply response
Shale shortened part of the investment cycle. U.S. production could respond faster than a conventional offshore megaproject, and the United States became a major exporter. The 2014–16 collapse tested the economics of that new supply. Storage filled, price fell and capital discipline replaced pure volume growth.
But shale did not eliminate inventories. It changed who could provide the marginal barrel and how quickly. Wells still decline, capital still has a cost, pipelines still have direction and capacity, and refineries still demand particular grades.
The 2020s: inventories become an active policy instrument
The pandemic briefly produced the opposite of scarcity: demand disappeared faster than production could shut, storage filled and prompt WTI futures traded below zero at Cushing because the obligation to take delivery became a liability. That event proved that oil price is not simply the long-run value of energy. It is the price of a specific grade at a specific location and time, subject to available storage.
The recovery, Russia sanctions, OPEC+ decisions and large strategic releases then turned stock policy into a recurring market tool. By 2026, strategic inventories were no longer merely untouched insurance. They were already part of the active balancing mechanism when the Hormuz war forced another emergency response.
The refinery is the conversion bottleneck the headline inventory number hides
Oil demand is really demand for usable products. Refineries transform crude into gasoline, diesel, jet fuel, LPG, naphtha, asphalt, lubricants and petrochemical feedstocks. The yield depends on the crude and the hardware. Complex refineries can crack heavier molecules and remove sulfur; simpler refineries require lighter feedstock or produce a less valuable mix.
This creates three different shortage possibilities:
- Crude shortage: refiners cannot acquire enough compatible feedstock.
- Capacity shortage: crude exists, but refineries are damaged, offline, constrained or located in the wrong region.
- Yield shortage: refineries run, but the available crude slate does not produce enough of the product the economy needs.
The 2026 war struck all three. Gulf crude exports fell, export-oriented refineries shut or reduced runs, and LPG and refined-product flows were disrupted. Russian refinery attacks added a second product-market pressure. This explains how benchmark crude could retreat while gasoline and diesel cracks stayed elevated: crude transit recovered faster than the conversion-and-product system.
Diesel is the industrial warning light
Gasoline dominates household attention, but diesel sits deeper in the production network. It powers heavy trucks, farm machinery, construction equipment, backup generators, rail locomotives and parts of maritime transport. A diesel shortage does not merely raise commuting costs; it raises the cost of producing and moving nearly everything else.
Jet fuel exposes geographic concentration
Aviation depends on specialized fuel delivered into airport systems. A nation may show adequate total petroleum stocks while a hub airport faces a localized constraint. Flight cancellations then destroy their own demand, making the eventual inventory statistics appear less severe because the economy was forced to stop consuming.
LPG and naphtha connect oil to food and manufacturing
LPG is used for cooking and heating in many emerging economies. Naphtha feeds petrochemical production. Interruptions therefore move beyond transportation into household energy, plastics, packaging, textiles and industrial inputs. The humanitarian and manufacturing impacts can begin before Western gasoline stations display obvious scarcity.
National stock totals do not measure access to the marginal barrel
Japan's oil-security system reflects high import dependence: government-held reserves were reported near 263 million barrels at the end of 2025, while industry also carries legally required stocks. China holds a very large crude buffer but controls disclosure and allocation. The United States combines high domestic output, commercial storage, an SPR and deep refining capacity. Europe has compulsory-stock systems spread across countries and companies.
These systems are not additive in a crisis without conditions. A barrel owned in one country may be counted through a bilateral agreement, but moving it still requires port, vessel, insurance, financing and pipeline capacity. IEA rules recognize stocks held abroad and stockholding “tickets,” yet a contractual claim is not the same as immediate physical delivery.
The geography produces a hierarchy of resilience:
- Domestic production connected directly to domestic refineries.
- Domestic stocks of compatible crude and products near demand.
- Foreign cargoes already loaded and insured.
- Strategic stocks that can be authorized and delivered.
- Contractual or politically contingent access to foreign stocks.
- Unproduced spare capacity requiring secure export routes.
The lower the barrel sits on that list, the more assumptions must remain true before it can support real consumption.
Military power consumes the same logistics buffer it is trying to secure
Modern war is energy-dense. Aircraft sorties, naval patrols, armored movement, missile defense, construction, field power and global resupply consume fuel directly. The military can receive priority access, but that transfers scarcity to the civilian system. The stronger the protection effort becomes, the more energy the protection effort itself requires.
This is the feedback loop at the center of the Pattern Nexus war framework:
- A chokepoint or producer is attacked.
- Military forces deploy to protect routes and infrastructure.
- Insurance and freight costs rise even if physical transit partially continues.
- Governments release strategic stocks and subsidize critical users.
- Fiscal spending and Treasury issuance rise.
- Oil-driven inflation reduces the central bank's freedom to ease.
- Higher long rates tighten the private economy while war spending remains supported.
- Recession reduces civilian demand, effectively rationing oil through income.
This is why the oil shock cannot be analyzed separately from the 10-year or liquidity. The barrel changes inflation and issuance at the same time. The bond market is asked to finance the military and fiscal response while also absorbing higher uncertainty about the future price level.
A country with domestic energy, refineries, storage, pipelines, ports and reserve currency access can carry this burden longer. A country dependent on imported product, dollar funding and one maritime route experiences the shock much earlier. The same global oil price therefore produces different national economic clocks.
The market can send a false all-clear before the system is repaired
Demand destruction masquerades as balance
Official 2026 forecasts already incorporate large demand losses. EIA expects global consumption to decline by about 1.2 million barrels per day in 2026, while the IEA describes a May demand low near 97.9 million barrels per day. Some of that reduction is efficiency and substitution. Some is involuntary: fewer flights, lower factory runs, curtailed petrochemicals and consumers traveling less because price or availability forced them to.
If demand falls enough, inventory stops drawing and price declines. A superficial reading calls that successful rebalancing. A systems reading asks how much GDP, mobility and industrial activity was sacrificed to create the balance.
Restocking creates its own demand
When normal flow resumes, depleted commercial and strategic tanks must be refilled. Restocking demand can support price even if current consumption remains weak. It also means some returning supply does not reach final users; it repairs the buffer consumed during the crisis.
Low prices can destroy the future response
If recession pushes oil below the level required for new drilling and infrastructure, investment slows. The near-term surplus then plants the seed of a later shortage. This is the familiar commodity cycle, but war accelerates it by raising project, insurance and political risk.
High prices accelerate substitution but not instantly
Electric vehicles, efficiency, rail, nuclear power and renewable electricity can reduce oil exposure over time. They cannot instantly replace aviation fuel, maritime bunker fuel, heavy equipment, petrochemical feedstock or the existing global vehicle fleet. Transition changes the long-run demand curve; inventory manages the short-run discontinuity.
What governments do as the clock shortens
| Stage | Physical condition | Likely policy | Market signature |
|---|---|---|---|
| Normal buffer | Commercial stocks inside seasonal range | Routine procurement | Curve reflects ordinary storage economics |
| Early draw | Persistent below-seasonal inventory | Diplomacy, route changes, specification waivers | Prompt spreads strengthen |
| Emergency bridge | Loss exceeds commercial adjustment | Strategic releases and coordinated cargo allocation | Crude may soften; products remain tight |
| Administrative rationing | Specific regional/product cover becomes critical | Export controls, priority users, consumption limits | Regional prices decouple |
| Economic rationing | High price destroys civilian demand | Subsidies, fiscal relief, monetary conflict | Inflation up, growth down |
| Forced contraction | Supply cannot support existing activity | Industrial curtailment and mobility restrictions | Price may fall as recession dominates |
The boundary between stages is not a single global percentage. It depends on import dependence, product mix, storage location, reserve-release speed and the credibility of future supply. This is why weeks of cover can matter more than billions of barrels.
What the model proves—and what it does not
Data cutoff. U.S. monthly petroleum series are current through May 2026; monthly WTI reaches June. Global war balances use the July 2026 IEA Oil Market Report and EIA Short-Term Energy Outlook available by August 2.
Long history. EIA's total commercial crude-and-products series begins in 1956. The article focuses historically on the 1970s forward because that is when the current strategic-reserve architecture emerged. Commercial-crude series definitions changed, including the exclusion of lease stocks beginning in 2005, so charts do not splice incompatible crude definitions without disclosure.
Regression. The primary OLS uses year-over-year changes, 474 observations and Newey–West errors with 12 lags. It is an empirical relationship, not a structural supply-demand model or causal instrument. Lead-lag correlations identify timing, not independent causation.
Global uncertainty. No open, perfectly consistent global tank-level series reaches back to the 1970s. OECD history is stronger; non-OECD and oil-on-water estimates depend on reconstructed balances. The article does not manufacture false precision where observation is incomplete.
Falsification. The base thesis weakens if onshore global stocks rebuild for several consecutive months, OECD commercial stocks rise without government releases, Gulf exports and refineries return to prewar throughput, product cracks normalize, and the market remains in contango. It strengthens if headline builds are concentrated on water, government reserves continue falling, products stay tight and renewed disruptions prevent fourth-quarter stock builds.
The barrel is where war, money and industry meet
Oil is the physical bridge connecting military mobility, food, freight, aviation, chemicals, construction, industry and household life. Inventory is the amount of time that bridge can remain open after the flow is damaged.
The current system is not close to consuming the last global barrel. That is the wrong threshold. The risk is that repeated conflict drains the correctly located commercial and strategic buffer faster than peace can rebuild it. The world can hold billions of barrels and still lose the specific crude, product, route or refinery capacity required at the margin.
This is why the 2026 oil story belongs inside the larger Pattern Nexus framework. The war is a logistics war. The inflation problem is a physical-flow problem. The long-end problem is a war-premium and fiscal-supply problem. The liquidity response can fund the bridge, but it cannot keep extending the bridge forever.
Oil inventory is not proof that the system is safe. It is the countdown the system purchased before the crisis began.
Primary data and official publications
- [1] U.S. Energy Information Administration, U.S. Ending Stocks of Crude Oil and Petroleum Products.
- [2] U.S. Energy Information Administration, Weekly U.S. Ending Stocks Excluding SPR of Crude Oil.
- [3] U.S. Energy Information Administration, U.S. Ending Stocks of Crude Oil in the SPR.
- [4] U.S. Energy Information Administration, Petroleum and Other Liquids Data.
- [5] U.S. Energy Information Administration, Weekly Petroleum Status Report.
- [6] U.S. Energy Information Administration, U.S. Crude Oil First Purchase Price.
- [7] Federal Reserve Bank of St. Louis, FRED, Crude Oil Prices: West Texas Intermediate.
- [8] U.S. Bureau of Labor Statistics via FRED, Consumer Price Index for All Urban Consumers.
- [9] International Energy Agency, Monthly Oil Data Service: stocks methodology and history.
- [10] International Energy Agency, IEA history.
- [11] International Energy Agency, Oil Stocks of IEA Countries: 90-day obligation and methodology.
- [12] International Energy Agency, Oil Market Report, March 2026.
- [13] International Energy Agency, Oil Market Report, April 2026.
- [14] International Energy Agency, Oil Market Report, June 2026.
- [15] International Energy Agency, Oil Market Report, July 2026.
- [16] U.S. Energy Information Administration, Short-Term Energy Outlook: Global Oil Markets, July 2026.
- [17] U.S. Energy Information Administration, Monthly OECD Petroleum and Other Liquids Stocks.
- [18] Energy Institute, Statistical Review of World Energy.
- [19] Federal Reserve Board via FRED, Industrial Production: Total Index.
- [20] Pattern Nexus, The Fed's Long-End Trap: Why a 4.65% 10-Year Is Already Doing the Tightening.
- [21] Pattern Nexus, War Is Back On: The U.S.–Iran Ceasefire Has Collapsed Into a Wider Logistics and Chokepoint War.
What's Your Reaction?
 Like
0
Like
0
 Dislike
0
Dislike
0
 Love
0
Love
0
 Funny
0
Funny
0
 Wow
0
Wow
0
 Sad
0
Sad
0
 Angry
0
Angry
0

Nexus (Christopher)
Founder of Pattern Nexus. I research markets, macro, geopolitics, AI, history, ancient systems, and the patterns most people overlook. I’m also building Market Radar, a trading scanner designed to read pressure, risk, confirmation, and setup quality before ch…
Related research

Polar Vortex Watch 2026–27: The Sun Quieted, the Vortex Hit a Record — Now the Real Test Begins
The early-season Arctic vortex has now crossed from unusual into a verified date-matched record at 10 hPa. At the same time, NOAA reports v…
42 shared topics.
CERN Just Put ESFD in a Testable Place: Higgs Decay, Off-Shell Z Bosons, and the Field Beneath the Particle
CERN’s ATLAS and CMS experiments have found strong evidence for entanglement in the spin structure of Higgs → ZZ* → 4ℓ decays. The result i…
41 shared topics.
Fed Just Hiked Into a 5% 10-Year: Why the Next Liquidity Cycle May Arrive Faster
The Federal Reserve just raised the federal-funds target to 3.75%–4.00% while the 10-year Treasury closed at 5.01%, the 30-year at 5.35%, a…
85 shared topics, same research avenue.
Space Was Becoming Infrastructure. Now It Has a Weapons Layer: The U.S. Confirms On-Orbit Space-Control Weapons
For the first time, the United States has publicly acknowledged that it operates "on-orbit space control weapons." The hardware remains cla…
41 shared topics.
August CPI Just Activated the Fed’s One-Hike Option—and Deepened the Long-End Trap
August CPI rose 0.4% on the month and 3.4% from a year earlier, while core CPI rose a hotter-than-expected 0.3% even as its annual rate eas…
166 shared topics, same research avenue.
Two Economies, One Balance Sheet: The Unstable Barbell of 2026
Reserve support has returned, but real long rates, fiscal supply, and an AI-energy capital wave are splitting the U.S. economy between capi…
49 shared topics, same research avenue.
Polar Vortex Watch 2026–27: Early Arctic Organization Is Now Pressing Historical Extremes
What started as an unusual late-August structural signal is becoming something much harder to dismiss. The 10-hPa Arctic winds have moved a…
41 shared topics.
Polar Vortex Watch 2026–27: The Early Organization Signal, Measured
The wind-speed test and the geometry test give different answers. Pattern Nexus compares 48 autumn wind series and 744 historical height fi…
41 shared topics.
Comments (0)
Security Check
Please complete the captcha to verify you are human.