
Gold Didn’t Moon — It Locked Into a New Liquidity Rail
QT ends tomorrow and the Fed pivots to managing reserves with T-bills and MBS roll-off. Gold already snapped into a new liquidity rail, pricing faster debasement and rising bank stress.
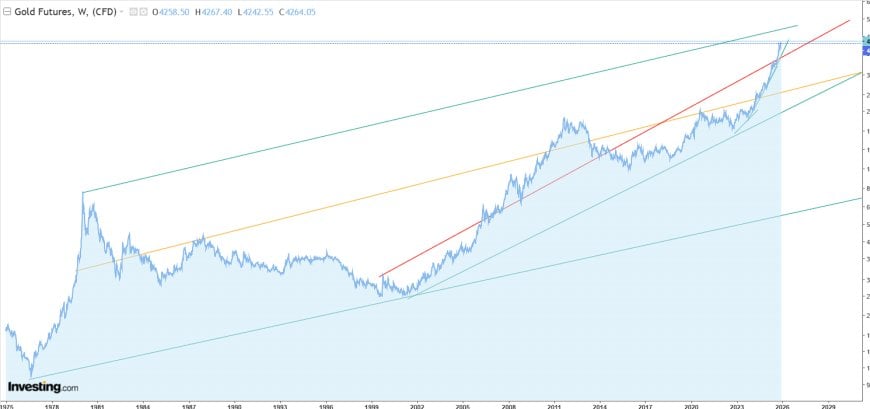
The Setup: QT Ends Tomorrow
We are not “approaching” the end of QT. We are standing on the line. The Fed has already announced that balance sheet runoff stops on December 1, 2025. This isn’t speculation. The reason is simple: the system finally hit the point where continuing to shrink the balance sheet would do more damage than good. Excess liquidity is gone. We are now cutting into the bone of bank reserves and collateral functioning, and the Fed knows exactly how that story ends because they already lived it in 2019.
QT was designed as a slow, predictable way to roll back the COVID-era shock-and-awe balance sheet. Caps were set on how much in maturing Treasuries and MBS the Fed would allow to roll off each month. Reverse repo balances collapsed. Bank reserves came down. Everything looked “fine” — until short-term markets started wobbling, repo rates flirted with the standing repo facility, and primary dealers quietly told Treasury and the Fed that the room to keep shrinking the balance sheet was vanishing.
So QT stops tomorrow. Not because inflation is “solved.” Not because the balance sheet suddenly looks pretty. It stops because another quarter of runoff would risk detonating something in funding markets, regional banks, or the Treasury market itself. The choice is between controlled debasement and uncontrolled fracture. Unsurprisingly, they picked controlled debasement.
Gold knew all of this months ago. That’s why you see it riding a new rail instead of spiking in a panic. The rail is the market’s implied path of debasement in a post-QT world.
From the Old Channel to the New Rail
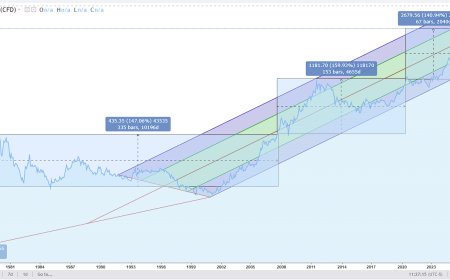
Before we talk about the new rail, we need to briefly revisit the old channel — the long-term structure that defined gold’s behavior for nearly half a century. In the last gold piece, I used a multi-decade chart that showed gold oscillating inside a rising megachannel from the mid-1970s onward. Every “explosion” in price — late 1970s, 2000s, post-GFC — looked a lot less mystical when you zoomed out and saw it as just another test of that upper boundary.
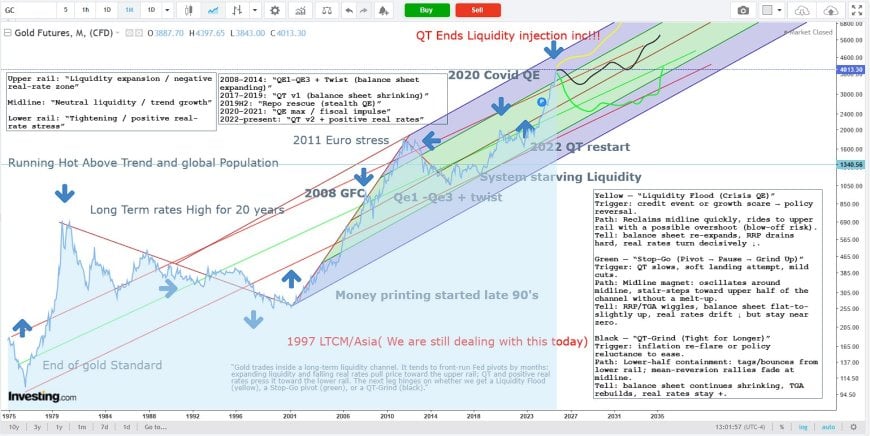
That long-term channel did two things for us:
- It proved that gold doesn’t wander randomly; it respects structural liquidity geometry.
- It showed that major regime changes — Bretton Woods ending, QE-era birth, global balance-sheet expansions — all coincided with gold testing or breaking the upper bounds of that channel.
The new chart at the top of this article is not a replacement for that channel; it’s a zoomed-in continuation. The old chart explains the terrain. The new chart explains the road we just turned onto.
In the prior piece, the story was: gold moved from the middle of the megachannel back toward the upper third as liquidity expectations shifted. Today the story is: QT ends tomorrow, the megachannel is still intact, but gold has attached itself to a steeper, shorter-term rail that reflects a different mix of drivers — less about “what is gold worth over 50 years” and more about “how fast is debasement accelerating over the next two to three.”
How QT Actually Worked: Caps, MBS, and Reverse Repos
It’s impossible to understand what gold is saying without understanding how QT actually worked. Most people think “they sold assets.” They didn’t. QT was a passive runoff regime bounded by caps. Think of it as the Fed letting the garden grow wild in the QE years, then deciding to stop replanting anything new once older plants died.
The basic structure looked like this:
- The Fed held a massive portfolio of Treasuries and agency MBS in the System Open Market Account (SOMA). At the start of this tightening cycle that was roughly $9 trillion, later declining into the mid-$6 trillions.
- Each month, some fraction of those securities matured or paid down.
- During QE, the Fed reinvested all of that principal — rolling it into new Treasuries or MBS, keeping the balance sheet size constant or growing.
- Under QT, the Fed stopped reinvesting up to specified caps. If $90 billion of securities matured and the cap was, say, $60 billion for Treasuries and $35 billion for MBS, the Fed would allow up to those caps to roll off without replacement and reinvest anything above that back into new securities.
Importantly, MBS and Treasuries are not interchangeable here. MBS pay down based on mortgage prepayments, which collapsed when mortgage rates spiked. That meant the MBS cap was often not fully binding — principal simply wasn’t coming in fast enough to hit the limit. Treasuries, by contrast, have hard maturity schedules that kept the Treasury caps relevant.
On the liability side of the balance sheet, QT showed up as a reduction in two main places:
- Overnight Reverse Repo (RRP) balances. Money market funds and others had parked trillions of dollars in RRP during the QE era. As QT and higher short-term rates took hold, those balances steadily fell toward zero.
- Bank reserves. Once RRP was mostly drained, further runoff began to eat into the reserve balances that banks hold at the Fed — the core of the “ample reserves” regime.
While RRP was high, the Fed could shrink the asset side of the balance sheet almost painlessly: that liquidity was just coming out of a giant holding tank of excess. Once RRP collapsed, each additional dollar of QT increasingly threatened the “ample reserves” floor — the minimum level of reserves needed to keep money markets functioning smoothly without constant firefighting.
That’s exactly where we are now. RRP is essentially gone. Reserves as a percentage of GDP have drifted down toward levels that, in past cycles, signaled the edge of safety. And strain is starting to show up in the usual places: short-term funding markets, dealer balance sheets, and pockets of the banking system that live closer to the margin.
What Changes After December 1: MBS Roll-Off, T-Bills, and Reserves
Ending QT does not mean the balance sheet instantly explodes higher. The mechanics of the post-QT world matter. The plan that has emerged from Fed speeches, TBAC minutes, and market commentary looks roughly like this:
- Stop net runoff of Treasuries. The Fed halts the shrinking of its Treasury portfolio by reinvesting all maturing Treasuries back into new ones. That freezes the size of the Treasury holdings in nominal terms.
- Allow agency MBS to continue rolling off. The Fed keeps letting MBS pay down passively. It has no interest in being a permanent, gigantic mortgage investor. Over time, the MBS share of the portfolio shrinks.
- Offset MBS runoff with Treasury bill purchases. As MBS roll off, the Fed replaces that duration with short-dated T-bills instead of longer Treasuries or new MBS, shortening the overall maturity profile of its holdings, giving itself more flexibility to add or subtract reserves with high-frequency operations.
- Use T-bill purchases as the fine-tuning tool for reserves. If reserves drift too low and money markets get tight, the Fed can quickly add reserves by buying more bills. If reserves drift too high, it can slow or pause those purchases and let organic growth in other liabilities eat into the cushion.
This balance sheet configuration does a few important things at once:
- It locks in the end of QT. The system is no longer in a net shrinkage regime. At worst it’s in a flat regime; more likely a slow-growth one.
- It quietly shifts the Fed away from mortgages and back toward Treasuries as its primary asset, especially short-dated bills.
- It gives the Fed maximum control over the reserve path without needing emergency QE announcements. They can simply adjust T-bill purchase pace and repo operations.
From gold’s perspective, this is all one thing: the end of hard liquidity drainage and the beginning of a flexible, reserves-first posture. Once you stop drilling holes in the bucket and give yourself a hose you can turn on at will, you’ve implicitly chosen the debasement path over the deflationary accident path.
That doesn’t mean hyperinflation. It means the baseline scenario for the next several years is one where the nominal size of the balance sheet either holds steady or grows, while nominal GDP and nominal debt also grow. Real constraints don’t go away — they just get papered over. Gold exists to track that papering process, and the new rail is its way of saying “we’ve entered a different phase of it.”
Banks, Collateral, and Quiet Strain Under the Surface
If everything is supposedly fine, why are we even talking about bank stress? Because “fine” in modern banking is defined as “hasn’t broken yet at this level of reserves.” That’s not a comforting definition once you realize how close the system has drifted back toward the edge.
Regional banks are still sitting on large books of loans and securities that don’t mark well to market. Commercial real estate is rolling over in slow motion. Consumers at the lower end of the income distribution are stretched. None of these are fatal in isolation. They become fatal when combined with thinner and thinner liquidity buffers and an inflexible Fed posture.
QT was steadily eroding those buffers. Ending QT is the Fed acknowledging that it can’t keep draining the pool while pretending the level isn’t dropping. The pivot to T-bill purchases to manage reserves is effectively a quiet guarantee to the banking system: “We will not let you go dry again the way we did in 2019.”
But that doesn’t erase risk. It changes its shape.
- Instead of a sudden mechanical shortage of reserves, the risk becomes a confidence and credit problem — a question of which institutions can survive another cycle of higher-for-longer real costs and rolling credit stress.
- Instead of a one-day repo blowout, the more likely scenario is a cluster of events: regional failures, funding stress at specific dealers, or a messy Treasury auction that forces the Fed to open the hose wider than planned.
- Instead of pretending QT is a permanent tool, everyone understands now that QT is a temporary dial that gets turned off once it conflicts with the need to keep the dollar system stable.
Gold lives at the intersection of those realities. It is not an equity claim on any single bank or borrower. It is the asset you buy when you realize that the system will choose liquidity support over strict discipline every time it’s pushed into a corner.
The New Gold Rail and the $4,400–$4,600 Band
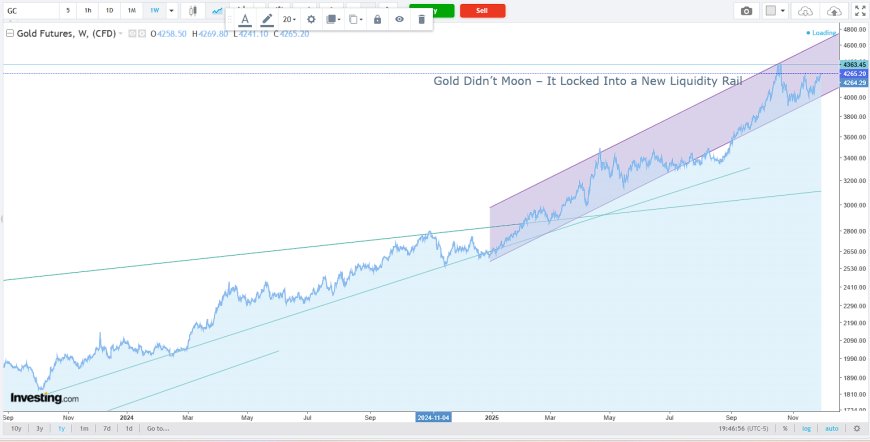
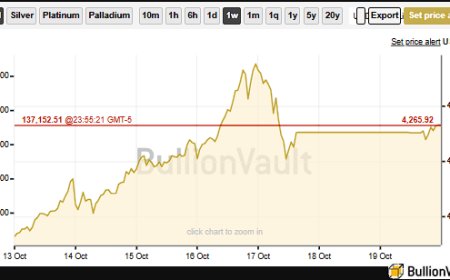
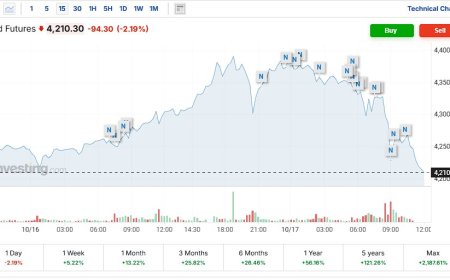
Look again at the intrayear chart. This is not what a mania looks like. A mania ignites vertical candles that snap and reverse. This is a grind higher inside a channel that keeps catching price and launching it back toward the upper band.
That channel is the visualization of everything we’ve just talked about: QT ending, reserves being managed via T-bill purchases, MBS rolling off, banking risk being contained not by austerity but by liquidity flexibility. The slope of the rail is the market’s estimate of how fast that future debasement path runs.
In that geometry, the levels matter:
- Up to the low $4,000s: the move is just gold re-rating to the new post-QT reality. Nothing “broke.” The regime shifted.
- Around $4,200–$4,350: gold is riding the rail, fully acknowledging the end of QT and the start of a gentler liquidity expansion.
- At $4,400: we hit the threshold where “normal” post-QT repricing ends and stress signaling begins.
- $4,500–$4,600 and above: you are no longer inside the rail. You are in territory that only makes sense if a bank, funding, or collateral shock is either underway or guaranteed in the near future.
That’s why I am still extremely cautious about gold sustaining levels much above $4,400. Inside the rail, gold is a thermometer. Outside it, gold is a fire alarm.
Scenario Map: Green Base Case, Yellow Tail
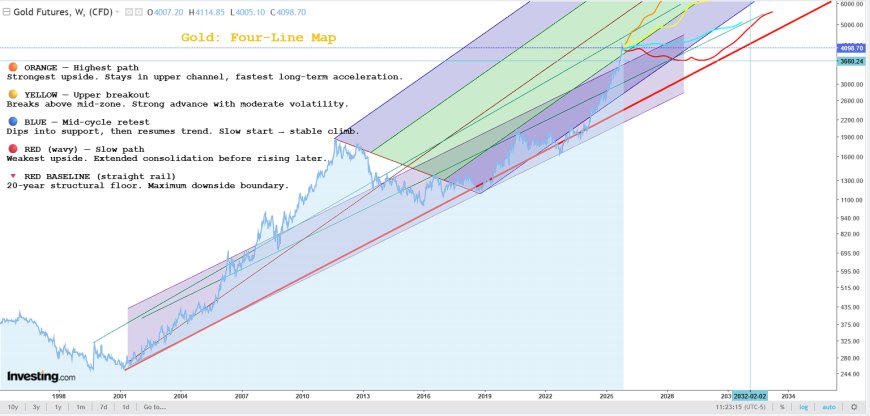
With QT officially ending, the original three-path framework collapses down to two main branches. Black — the extended QT grind — is dead. What’s left is Green and Yellow.
Green – Orderly Post-QT Liquidity Return
In the Green path, the Fed stops QT, stabilizes reserves, and slowly rebuilds them through a combination of T-bill purchases and organic growth in the balance sheet as the economy grows. There’s no dramatic “QE-2020-style” announcement; just a staircase of small, persistent choices that all point in the same direction: keep the system liquid, keep funding functioning, and let nominal variables outrun real ones.
In that world, gold continues to grind higher along the rail. It may probe the upper band, correct back to the lower band, and oscillate — but the structure remains intact. The move is large in price terms but calm in shape. You can point to this and say, “This is what debasement-without-outright-crisis looks like.”
Yellow – Crisis Liquidity / Bank or Collateral Event
In the Yellow path, the end of QT isn’t enough. The damage done during the runoff period plus whatever new shocks arrive in 2026 combine to crack some part of the system: maybe a cluster of regional banks, maybe a major non-bank financial institution, maybe a Treasury auction that goes sideways and forces an immediate intervention.
In that world, the “slow, measured T-bill purchases” plan dies on impact. The Fed is forced into larger, more aggressive balance sheet expansions. Standing facilities like the SRF and discount window get heavy use. Acronyms we haven’t heard in a decade start showing up again.
Gold won’t wait for the headlines. It will signal Yellow by breaking the rail and camping out above $4,400 with momentum. If we see price drive hard into $4,600 and hold there while funding spreads blow out and bank equity sells off, you’re looking at the Yellow path in real time.
Pattern Nexus View: Where Gold Fits in the Bigger System
Gold doesn’t live in isolation in my framework. It’s one node in a larger network that includes:
- the global liquidity composite (Fed + Treasury + RRP + foreign flows),
- the AI-industrial build-out and the capital it demands,
- the shift from bank-based eurodollars to tokenized dollar collateral and stablecoins,
- and the long, slow deterioration of sovereign balance sheets as demographics and energy costs grind them down.
Ending QT and moving into a T-bill-managed reserve regime is a perfect fit for that larger picture. It means:
- The dollar system is not voluntarily tightening its own noose.
- The Treasury market will remain the core collateral engine, supported by the Fed whenever stress hits.
- The rise of tokenized Treasuries and stablecoins gets an even stronger foundation in the form of predictable Fed support for Treasury liquidity.
- The AI build-out — data centers, power infrastructure, semis — can continue to soak up capital without crashing the funding system, because the central bank is signaling it will not allow reserves to become the choke point.
Gold’s role in that ecosystem is not to replace the dollar or become a new base layer. It is to serve as the collateral of last resort and the scoreboard of debasement. When the digital dollar superstructure (Treasuries + stablecoins + tokenized cash) grows faster than real underlying productivity, gold quietly adjusts the scoreboard upward. It doesn’t stop the game. It tells you what inning you’re in.
QT ending tomorrow marks the moment the scoreboard confirmed what the playbook already implied: the next era is not one of structural tightening, but of managed, rolling debasement — with the constant risk that one of those rolls catches something fragile and forces a bigger move.
FAQ: What This Does and Doesn’t Mean
Does QT ending tomorrow mean we’re going back to 2020-style QE?
Not immediately. This is more like shifting from reverse to neutral, not slamming back into full forward gear on day one. The Fed is freezing net runoff and using T-bill purchases as a steering wheel for reserves. Over time, if growth slows and stress episodes pile up, that will look more and more like QE in practice even if they never use the word again.
Is this “hyperinflation”? Is that what gold is pricing?
No. Hyperinflation is a political and social breakdown, not just a central bank buying securities. Gold is not saying “the system dies tomorrow.” Gold is saying “the default setting is now structural debasement with periodic liquidity shocks.” You can have rising gold and still have periods of disinflation or outright deflation in some prices — that’s the reality of a complex system where liquidity, credit, and real-world constraints interact.
Why focus so much on liquidity and reserves instead of CPI or unemployment?
Because liquidity is the medium through which every other variable has to move. CPI is a downstream readout. Employment is a downstream readout. When reserves get tight, when dealers lose balance sheet, when the Treasury market strains, those are upstream conditions that eventually spill into everything else. Watching those while ignoring liquidity is like watching the scoreboard and ignoring the fact that the field is flooding.
Should I short banks if you’re talking about banking strain?
This is not trading advice. Conceptually, though, the post-QT regime is one where the Fed will lean hard against systemic banking stress precisely to avoid contagion. That means bank equity can remain weak and volatile even as the system avoids outright collapse. The point of this article is not “short X.” It’s “understand that the policy reaction function has shifted from draining liquidity to stabilizing it, and gold is mapping that shift.”
Why not just hold dollars if the Fed is defending the system?
Because “defending the system” increasingly means defending it via controlled debasement: maintaining nominal stability by quietly raising the water level. Cash is a claim inside the system. Gold is a claim outside it, tracking how far the defense operation has gone. In a world where liquidity support is the default response to stress, it makes sense that an asset outside the liability structure of banks and governments would grind higher.
Could gold be “wrong” here?
Markets are never infallible. But it would take a very specific path to prove this rail wrong: sustained fiscal discipline, low and stable issuance pressure, a Fed willing to tolerate funding accidents to keep the balance sheet flat, and a global environment where demand for dollar assets falls in perfect proportion to supply. That combination is theoretically possible and politically implausible. The rail is the market’s judgment on which future is more likely.
What I’m Watching From Here
With QT shutting off, the forward-looking dashboard changes. These are the levers that matter in the post-QT world:
- The pace and composition of the Fed’s reinvestments and T-bill purchases.
- Reserve balances relative to GDP and to known “stress thresholds” from prior cycles.
- Usage of standing facilities like the SRF and discount window — the silent barometers of strain.
- Primary dealer balance sheet constraints and Treasury auction performance.
- Regional-bank health, unrealized securities losses, and CRE credit migration.
- Real yields versus the slope of the gold rail.
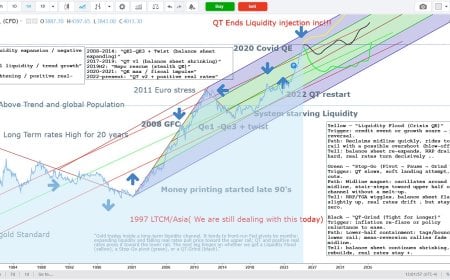
Gold, sitting inside that purple channel, is the composite indicator of all of those forces. It doesn’t give you a date, but it gives you a slope. QT ending tomorrow is the official admission that the old slope is gone. The new rail is already here. The only question now is whether we stay on it, or jump to something steeper under stress.
Either way, gold will be the first to tell you.
Sources & Further Reading
The framework in this article is built on primary-source plumbing data and official reports. A non-exhaustive set of references is below for readers who want to go straight to the tap.
- Federal Reserve – Plans for Reducing the Size of the Balance Sheet (QT caps for Treasuries and MBS)
- New York Fed – Balance Sheet Reduction: Progress to Date and a Look Ahead
- Federal Reserve – Policy Normalization and the Ample Reserves Regime
- Reuters – Fed to End Balance Sheet Reduction on December 1, 2025
- Federal Reserve – 2019 Statement on Treasury Bill Purchases to Maintain Ample Reserves
- Fed Finance & Economics Notes – What Happened in Money Markets in September 2019?
- New York Fed Staff Report – Reserves Were Not So Ample After All
- Kansas City Fed – Assessing Market Conditions Ahead of Quantitative Tightening
- FDIC – Quarterly Banking Profile, Second Quarter 2025 (Unrealized Losses and Banking Metrics)
- FDIC – Quarterly Banking Profile, Third Quarter 2025
- FDIC – Quarterly Banking Profile PDF (Charts on Unrealized Securities Losses)
- European Central Bank – Financial Stability Review Portal (November 2025 Edition)
- ECB – Financial Stability Review, May 2025 (Systemic Vulnerabilities and Non-Bank Risks)
- Reuters – Stablecoins Could Siphon Off Euro Zone Bank Deposits, ECB Warns
- Fed Finance & Economics Notes – Market-Based Indicators on the Road to Ample Reserves
- BIS Quarterly Review – September Stress in Dollar Repo Markets: Passing or Structural?
Qual é a sua reação?
 Curtir
0
Curtir
0
 Não Gostar
0
Não Gostar
0
 Amor
0
Amor
0
 Engraçado
0
Engraçado
0
 Uau
0
Uau
0
 Triste
0
Triste
0
 Bravo
0
Bravo
0

Founder of Pattern Nexus. I research markets, macro, geopolitics, AI, history, ancient systems, and the patterns most people overlook. I’m also building Market Radar, a trading scanner designed to read pressure, risk, confirmation, and setup quality before chasing a move. Pattern Nexus is where I connect the dots between data, history, technology, and the bigger system playing out around us.













Comentários (0)