
The Iran–Middle East War, Day by Day (Feb 28–Mar 5, 2026)
A Pattern Nexus day-by-day control-systems breakdown of the Iran–Middle East war: strikes, maritime hits, Hormuz disruption, energy shutdowns, cloud infrastructure attacks, evacuations, and NATO/EU posture shifts.
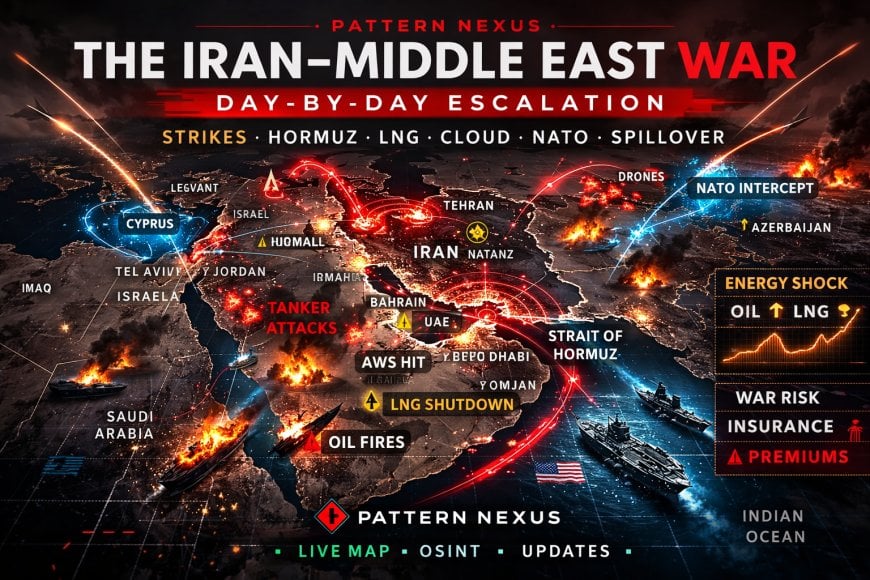
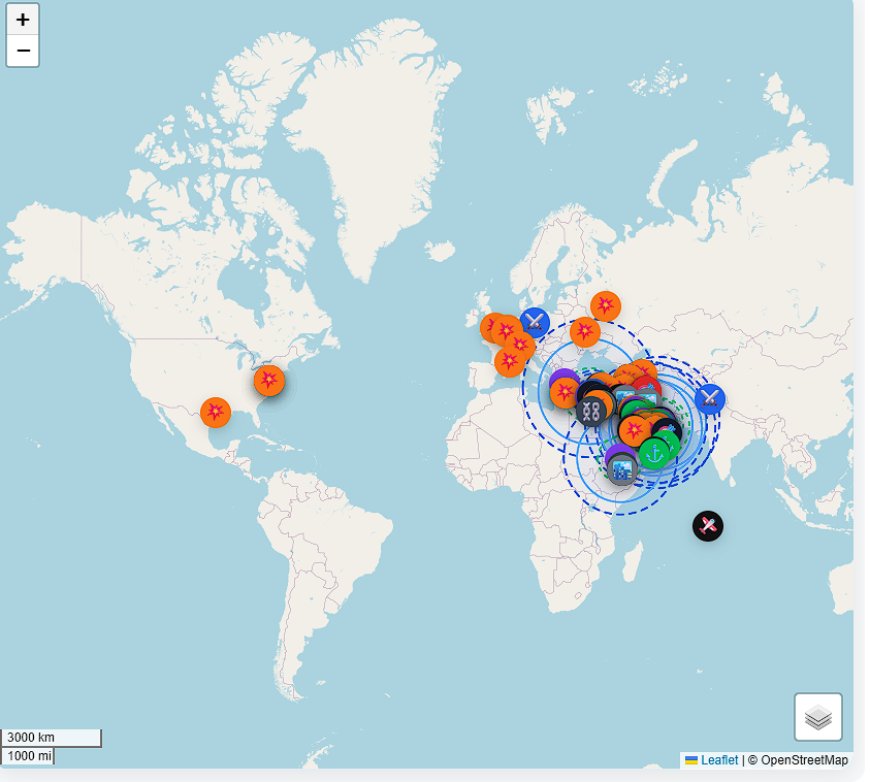

The opening strikes on Iran (Feb 28) immediately triggered a predictable second-order cascade: regional retaliation (Israel + Gulf), maritime targeting that effectively stalled Hormuz traffic, and a forced reconfiguration of airspace and energy flows. By day six (Mar 5), this conflict had stopped behaving like a contained exchange and started behaving like a systems event: tankers hit across multiple approaches, refineries and LNG shut-ins, evacuation corridors opening and closing in real time, and EU/NATO posture shifting from “watching” to “moving.”
Hormuz isn’t “a place.” It’s a switch. When it flips, everything downstream reroutes through cost, delays, and risk premia.
The fastest way to “expand” a war isn’t invading. It’s forcing third parties to defend airspace, ports, and evacuation corridors under ambiguity.
Watch what insurers, ports, and navies do—not what politicians say. The real posture is always in the logistics layer.
The War’s Real Shape: It’s a Control-Layer Event
If you only watch the headline strikes, you’ll miss what actually matters. The kinetic layer is the spark. The systems layer is the fire. This war rapidly moved from “targets inside Iran” to “regional infrastructure and permission layers” because Iran’s most credible leverage isn’t matching jet-for-jet. It’s pressure on transit, ports, energy export nodes, and the air-defense ledger of neighbors.
The feed behind this article (the Pattern Nexus OSINT-style map dataset) shows that progression clearly: early strike effects inside Iran (including satellite-imagery markers), then immediate retaliation patterns against Israel and Gulf targets, then maritime incidents multiplying from Hormuz approaches out toward ports like Fujairah and Khor al Zubair, then energy and airspace disruptions compounding into evacuations, insurance backstops, and European deployments.
A conflict becomes a systems event when the decisive action shifts from “who hit what” to “who can keep moving”: ships, fuel, exports, flights, troops, evacuations, payment/insurance rails, and political permission. Once those rails are disrupted, the war expands even if the map doesn’t.
Day-by-Day Timeline (Feb 28–Mar 5)
Below is the conflict as it unfolded day by day based on the current feed window (Feb 28 through Mar 5). I’m not trying to make this “pretty.” I’m trying to make the escalation logic visible.
Day 0 — Feb 28: Opening strikes, immediate retaliation, and the first shockwave
The war begins with reported U.S./Israeli strikes across Iran and near-immediate retaliatory action. The early signal isn’t only “what got hit,” it’s that airspace and shipping begin reacting instantly: flight cancellations and route avoidance start spreading across the region, and firms begin suspending shipments and moving staff.
- Strikes on Iran: Opening strike wave reported; multiple senior figures reportedly killed in early coverage; satellite-imagery markers appear for damage at key sites including Tehran leadership-linked locations and naval/port targets.
- Civilian impact: Reporting includes a strike on a girls’ school in Minab with very high casualties and calls for investigation.
- Iran → Region: Retaliation reported including impacts in Israel (Tel Aviv referenced in early live coverage).
- Airspace: Mass cancellations, suspensions, and avoidance patterns begin immediately across multiple carriers and corridors.
- Commercial pullback: Early reports describe shipment suspensions and foreign staff departures in the Gulf as the risk posture snaps from “elevated” to “active.”
Day 1 — Mar 1: Gulf disruption goes physical (bases, ports, and tankers)
Day 1 is where the war stops being “over there.” Damage reporting expands into Bahrain/UAE, maritime incidents multiply, and the region starts behaving like it’s under persistent threat. The important piece: even without a formally declared closure, the Strait begins operating like it’s partially shut because operators delay transits and cluster at anchor.
- Damage reporting: Satellite imagery markers indicate damage at/near the U.S. Fifth Fleet base in Bahrain; smoke/fire-related markers appear around Dubai industrial and port areas with attribution still contested in some cases (intercept debris vs direct hit vs secondary fire).
- Maritime: A vessel struck near Mina Saqr; an oil products tanker reported targeted by drone off the UAE with no damage; a separate tanker incident off Oman includes a reported crew fatality.
- Hormuz status: Advisories emphasize no formally communicated “closure,” but also highlight VHF transit-restriction claims and rising operational friction.
- Iran strike effects: Satellite-imagery markers expand (e.g., Zahedan radar damage), consistent with an air-defense suppression layer.
- EU posture: EU naval mission ASPIDES signals reinforcement as protection requests rise.
Day 2 — Mar 2: Maritime targeting accelerates, energy nodes and tech infrastructure get hit
Day 2 is the unmistakable pivot: tankers are not just “at risk,” they’re being struck. And once vessels are burning or taking hits in and around the Strait, your de facto closure starts forming whether anyone announces it or not. On top of that, the targeting picture expands into infrastructure and services (including reported impacts to cloud/data facilities).
- Maritime: Multiple vessel incidents reported including the tanker Athe Nova hit by drones and on fire in the Strait; a U.S.-flagged products tanker struck in Bahrain port; wider shipping disruption reporting grows.
- Energy: Reported drone strike drives disruption at Ras Tanura; broader refinery and export risk rises.
- Infrastructure: AWS reports drone impacts and service disruption at Bahrain/UAE facilities (structural damage and power disruption cited).
- Strikes on Iran: Satellite imagery package expands to ports/naval facilities (Bandar Abbas harbour vessel damage), UAV/drone base sites, and other nodes.
- Europe constraint signal: Spain is cited in reporting about restricting use of bases for Iran operations, highlighting how coalition geometry has limits even under pressure.
Day 3 — Mar 3: The East Med lights up; embassies, ports, and “legal posture” enter the frame
Day 3 broadens the battlespace again. Strikes and attempted strikes show up as “security events” near diplomatic facilities, and a drone hit at/near RAF Akrotiri forces the Eastern Mediterranean to become a front-end defensive zone. The UK’s response is telling: counter-drone helicopters to Cyprus and naval movement. That’s not symbolic. That’s posture.
- Cyprus / East Med: Drone strike reported at RAF Akrotiri; UK deploys helicopters with counter-drone tech and a naval vessel toward Cyprus for force protection.
- Oman: Drone hits a fuel tank at Duqm port (damage contained but this is a huge signal: ports are now in the threat envelope).
- Diplomatic security: Reports reference drones targeting U.S. diplomatic facilities in Riyadh and Kuwait City (attribution contested; treated as reported events).
- Strikes on Iran: Reports include Natanz entrances bombed and a major religious/political institution building in Qom flattened (per reporting).
- Legal/permission layer: UK legal analysis reporting starts to show up (how long can posture remain under contested authorization and alliance constraints).
Day 4 — Mar 4: Hormuz shutdown worsens, the air-defense ledger goes multinational
Day 4 is where you can feel the system starting to buckle. Maritime incidents expand, tanker risk becomes widespread, and energy disruptions become measurable (not just “risk”). NATO and regional defenses start intercepting and adjusting posture. The war becomes a math problem: intercept capacity vs volume, and risk tolerance vs necessity.
- Maritime: Multiple vessels reportedly hit off Fujairah; war-risk area behavior spreads; Maersk issues advisories about Strait disruption and safety posture.
- Energy: Qatar’s Ras Laffan LNG shutdown/force majeure reporting appears; broader refinery disruptions intensify.
- Air defense: NATO-linked interception reporting emerges on a missile heading toward Turkey (serious incident even without Article 5).
- Regional strikes: Additional reporting includes events around Israel (drone strikes) and Gulf (airport damage claims), while Iran strike targets expand across multiple sites.
Day 5 — Mar 5: De facto standstill, cross-border spillover, and Europe starts moving metal
Day 5 is what “expanding war” looks like in the real world: tankers attacked beyond one narrow lane, drones crossing into Azerbaijan’s Nakhchivan exclave, refineries and exports disrupted, evacuations ramping, and NATO/EU posture shifting from statements to deployable assets. The market layer reacts (oil surges), and the insurance layer starts talking about backstops because private pricing can’t carry this risk alone for long.
- Hormuz traffic: Reuters graphics reporting describes tanker traffic near-standstill, with large anchorage build-ups and multiple vessels hit since the conflict began.
- Maritime expansion: Explosive-boat attack reported near Iraq’s Khor al Zubair; tanker blast/leak off Kuwait; additional strike claims on U.S.-linked tankers with limited independent confirmation.
- Energy disruptions: Iraq shut-in reported near 1.5 mbpd due to storage/logistics as tankers stop moving; Kuwait refining disruption reported; BP evacuations at Rumaila after drones land near the field; Iraqi Kurdistan oilfield (Sarsang) hit and production halted.
- Spillover: Azerbaijan reports Iranian drones hitting Nakhchivan airport terminal and landing near a school; Azerbaijan protests and signals potential response.
- Airspace + evacuations: Repatriation flights ramp up; some limited “safe corridor” routes reopen and close as missile activity persists; embassies shelter/suspend operations in places like Kuwait; evacuations and alerts spread.
- Europe/NATO posture: UK deploys additional Typhoons to Qatar; Italy signals air-defense support to Gulf partners and naval assets for Cyprus protection; Spain and Netherlands referenced for frigate deployments toward Cyprus; NATO increases ballistic missile defense posture after Turkey incident and emphasizes vigilance without invoking Article 5.
- Diplomacy + narrative: Russia offers mediation while accusing U.S./Israel of trying to drag Arab states in; EU foreign policy leadership warns Iran may be seeking escalation; U.S. domestic political constraint appears (House blocks a war powers measure).
- Insurance layer: Lloyd’s market officials engage with the U.S. government/DFC on war-risk/political-risk support concepts to keep Gulf trade moving.
Strike campaign → retaliation → maritime risk → de facto closure behavior → energy/export disruption → airspace fragmentation → evacuations → alliance posture shifts → insurance backstop. That’s the sequence. You can debate intent all day. The system response is the truth.
Chokepoints & Failure Modes: Hormuz, Energy, Airspace, Insurance
There are four rails that matter here. The kinetic rail gets the attention, but the other three are what expand the war.
1) Maritime rail: “No official closure” can still equal “no movement”
Advisories can say “no formal closure,” but operators don’t trade on words, they trade on survivability. Once multiple vessels are being struck (or plausibly threatened), the Strait becomes functionally constrained. Anchoring patterns build up. War-risk pricing spikes. Escort concepts get discussed. And the map starts showing incidents not as isolated points, but as a distributed attack surface.
2) Energy rail: shutdowns, shut-ins, and cascading constraints
The feed shows energy disruption evolving from “risk” to “operations.” Ras Tanura disruption reporting, Qatar’s Ras Laffan LNG shutdown (weeks to restore), Iraq shut-ins tied to storage and tanker paralysis, and refinery processing reductions are exactly how the commodity layer becomes an accelerant.
3) Airspace rail: fragmentation turns every evacuation into a tactical problem
“Flights resume” headlines are meaningless without the fine print: which corridors, at what times, under what threat conditions, with what reroute costs. When airspace fractures, every repatriation flight becomes a real-time negotiation with the threat environment. That’s why you saw flights forced back, corridors opened, embassy postures change, and shelter-in-place orders.
4) Insurance rail: when private pricing breaks, governments step in
This is the part most people ignore until it’s too late. When war-risk zones expand fast enough, insurance becomes the choke. If the market can’t price it, movement stops. That’s why backstop discussions matter: they’re a signal that the private rail is nearing capacity and state risk is being pulled forward to keep trade moving.
Pattern Nexus Lens
Pattern Nexus is a control-systems framework. So here’s the clean framing: the strike campaign is the actuator. The region’s choke points are the feedback loop. And the war expands when feedback forces new actors into the loop.
Iran’s retaliation posture (as reflected in the dataset) isn’t only about “hitting back.” It’s about forcing distributed defense: bases, ports, airports, embassies, and tankers become nodes that allies must defend under ambiguity. That’s how you widen the coalition without declaring anything. Then the maritime rail begins generating costs and delays so large that governments have to choose between economic self-harm and escalation.
The decisive battleground isn’t Tehran or Tel Aviv. It’s permission: who can keep operating ports, refineries, shipping lanes, and air corridors under threat. That’s why this war “feels bigger” so fast.
FAQ
Is the Strait of Hormuz “closed”?
The dataset includes advisories stating there was no formally communicated closure via recognized maritime safety channels, but also shows the practical reality: repeated vessel incidents, anchorage build-ups, and reporting that traffic approached a near standstill. In real markets, “de facto” matters more than “de jure.”
What’s the biggest energy risk right now?
Export paralysis + shut-ins + downstream refinery disruption. The feed tracks reported LNG shutdown at Ras Laffan, refinery disruptions, and Iraq production cuts tied to storage and tanker movement. The failure mode is not just “prices up,” it’s “logistics stops.”
Why are European assets showing up in a Middle East war?
Because air defense and evacuation protection become immediate alliance obligations when drones and missiles touch Cyprus/Turkey corridors and shipping routes that Europe relies on. That’s why you see EU ASPIDES reinforcement, NATO ballistic missile defense posture adjustments, and naval/air deployments trending toward Cyprus and the East Med.
Sources
These sources support the event timeline, posture updates, and the shipping/energy disruption markers summarized above.
- Pattern Nexus dataset: mideast-feed.json (live-updated)
- Reuters Live (Feb 28, 2026) — opening strikes and early retaliation reporting
- UKMTO Advisory 003-26 Update 002 (Mar 1, 2026)
- Reuters satellite imagery gallery (Mar 2–3, 2026) — strike effects at Iranian sites
- Reuters Graphics (Mar 5, 2026) — Hormuz tanker traffic near standstill
- EU Council (Feb 23, 2026) — Operation ASPIDES mandate context
- Reuters (Mar 5, 2026) — NATO increases ballistic missile defense posture
- Reuters (Mar 5, 2026) — Lloyd’s / U.S. DFC war-risk backstop discussions
Hvad er din reaktion?
 Synes godt om
0
Synes godt om
0
 Dislike
0
Dislike
0
 Kærlighed
0
Kærlighed
0
 Sjov
0
Sjov
0
 Wow
0
Wow
0
 Trist
0
Trist
0
 Vred
0
Vred
0

Founder of Pattern Nexus. I research markets, macro, geopolitics, AI, history, ancient systems, and the patterns most people overlook. I’m also building Market Radar, a trading scanner designed to read pressure, risk, confirmation, and setup quality before chasing a move. Pattern Nexus is where I connect the dots between data, history, technology, and the bigger system playing out around us.














Kommentarer (0)