
The Regime Reset Stack: Yield Curve Strategy, Dollar Rails, Metals Convexity, and the AI-Fiscal Endgame
A Pattern Nexus control-systems read tying the yield curve, dollar regime, metals, crypto, and equities into one machine: why inversions lead recessions, why recessions can be strategically useful for policy, how 2020 proved direct household injection at scale, and why AI/robotics forces the system toward permanent transfer rails to stabilize demand.
![[HERO_IMAGE_ALT]](https://patternnexus.com/uploads/images/202602/image_870x_69926d105ff68.jpg)

Tighten (inversion) → credit throttles → recession prints → permission appears → easing + fiscal expands → convexity runs (metals/BTC) → leverage gets punished → automation accelerates → stabilizers widen → repeat.
The “regime reset” is not one event. It’s the system cycling between constraint (rates), fracture (recession), permission (crisis), and relief (fiscal + easing), while automation steadily rewrites the labor contract underneath.
Don’t confuse “strong dollar” with “healthy system.” A strong dollar can be dominance (preferred rails/collateral) or it can be tightness (shortage stress that breaks funding and forces liquidation). The second one is where accidents happen.
Metals and bitcoin aren’t “separate trades.” They’re convexity gauges. When liquidity flips, they front-run the narrative, then leverage gets punished. If you don’t model leverage, you’ll misread every move.
The Dow is not “old economy” in an AI-industrial cycle. It’s throughput: industrial margins, logistics efficiency, energy sensitivity, and automation dividends compounding inside a secular channel.
Recessions create permission. Permission creates programs. Programs create rails. Rails become the new baseline. That’s how the system preserves stability when private credit can’t carry the load.
There’s a hidden layer most people skip: market function. You can have “rates” and still have broken auctions, thin depth, and funding stress. Function is the difference between an orderly reset and an accident.
The thread: what you guys saw and why it matters
I dropped a stack of charts and asked a simple question: what do you see across all of it, silver/gold, treasury yields, the dollar, the Dow, as one picture? The replies were the right kind of replies. People went straight to system-level forces: regime transitions, demographics, geopolitics, AI. That’s exactly where this conversation belongs, because none of these charts are isolated.
Pattern Nexus is not “chart astrology.” This is control-systems thinking. Price is downstream. If you want the read, you start upstream: incentives, constraints, plumbing. Then you look at the outputs: the curve, the dollar, and convexity assets behaving like sensors inside a stressed machine.
Bret: late-stage USD-centric system, transition is about how (orderly vs disorderly) and when (could be long).
John: cycles may distort because background conditions changed (population, productivity, AI).
Steve: USD dominance fades like past regimes, but geopolitics matters and the U.S. is fighting.
Jeffrey: demographics is the “this time is different” variable that can destabilize cultures fast.
Alex: China’s currency behavior looks like it “defies theory,” raising questions about fiat dynamics vs reserve status.
Here’s the synthesis: you’re watching a control system trying to preserve stability while the underlying constraints change. The constraint stack is shifting from “cheap time + global labor arbitrage” toward “energy + rails + fiscal + automation.” That shift forces the same pattern: tighten → break → justify → inject → repeat.
I’m mapping incentives and plumbing first, then showing how those constraints leak into price across the curve, the dollar, and convexity assets. If you model the upstream levers, the downstream charts stop looking random.
Layer 1: the system wants stability, so it will intervene when stress becomes politically survivable only with relief.
Layer 2: markets still liquidate when leverage meets tightness. Intervention does not prevent flushes, it changes the medium-term path afterward.
The economy is a credit machine. Credit is priced off rates and collateral. Collateral is priced off the long end and market function. Market function is constrained by dealer balance sheets, regulation, and plumbing. That’s why this stack is one machine, not six separate debates.
Rates as strategy: the curve, conversions, term premium, and market function
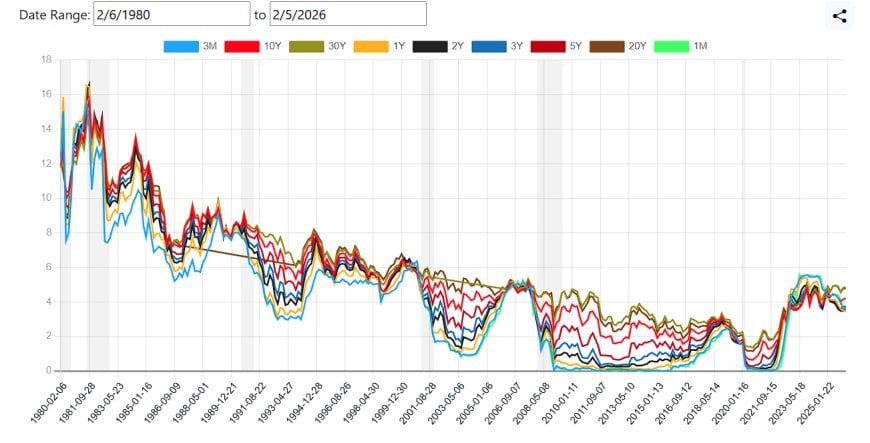
People talk about rates like it’s a weather report. It’s not. Rates are enforcement, a pricing gun pointed at leverage. The yield curve is the system’s internal pricing of constraint, credibility, duration supply, and the cost of leverage, all at once.
The front end (1M–2Y) is where policy can hit immediately. The long end (10Y–30Y) is where credibility gets judged, where duration has to clear, and where fiscal gravity leaks into price. When the front end is forced above the long end, you’re watching the system choose demand destruction over credibility loss. That’s constraint management.
Most commentary is “rates high = bad.” That’s lazy. The real question is: where does the rate convert into payment stress, and how fast does that stress hit credit creation? That conversion is why the curve leads the economy.
3M vs 10Y: the “policy bite” spread, often the cleanest recession tell because it’s policy directly against long growth.
2Y vs 10Y: the headline spread, useful, but the mechanism matters more than the meme.
Front-end shape: where liquidity preference lives; it’s the map of “cash is king” versus “risk is rewarded.”
Long-end behavior: where term premium, issuance pressure, and credibility all fight for the steering wheel.
Now the key piece: conversions. Rates convert into payment burdens, credit availability, and behavior. Mortgage conversions freeze housing turnover. Auto/credit conversions compress discretionary demand. Business financing conversions kill expansion. This is why yield curve signals lead the real economy: the mechanism is literally payment math.
- Policy rate up → cash yields become a competitor to lending and risk
- Funding cost up → banks/dealers tighten, marginal borrowers get cut off
- Mortgage/consumer rates up → turnover drops, delinquencies rise, demand slows
- Discount rate up → equity multiples compress, long-duration names crack first
- Dollar up → global conditions tighten because USD is the settlement baseline
That’s why inversions tend to lead recessions: an inversion is the system punishing maturity transformation and credit creation. It rewards sitting in cash and punishes lending. And the modern economy runs on credit expansion. Throttle that engine and recession is the downstream output.
Front end rises → bank incentive breaks → credit standards tighten → asset prices wobble → employment cracks → recession prints. The lag is the trap. The curve is early. The real economy is late. That lag is why people get fooled.
State A: Constraint (front-end stays high, curve flat/inverted, cash competes with lending).
State B: Fracture (credit tightens, delinquencies rise, layoffs/hiring freezes).
State C: Permission (political and institutional justification forms for cuts + programs).
State D: Relief (easing + fiscal + liquidity backstops).
State E: Convexity (metals/BTC run, then leverage gets punished).
The system cycles because the objective is stability, not “moral discipline.”
The long end: term premium, supply, and the “10Y tells”
Here’s the part most people miss: the long end is not only “growth expectations.” It’s also duration supply, dealer/balance-sheet capacity, and the premium investors demand to hold risk over time. In a deficit-heavy era, the long end becomes a battlefield between fiscal gravity and recession pricing.
When the market starts pricing recession and cuts, long yields can drop fast even while deficits are still ugly. That drop is not “everything is fixed.” It’s the machine flipping from inflation fear to growth fear. And that flip is exactly when convexity gauges (metals/BTC) wake up, because the forward path starts looking like relief again.
Bull steepener: long yields fall because growth cracks, cuts get priced, front end drops later. Risk assets can rally if the market believes relief is coming.
Bear steepener: long yields rise because term premium expands and duration supply overwhelms demand. That’s when valuations get compressed and “safe” stops being safe.
![[IMG_UST10Y_WEDGE_CROP_ALT]](https://patternnexus.com/uploads/images/202602/image_870x_69926a1a2c004.jpg)
![[IMG_UST10Y_WEDGE_ZOOM_ALT]](https://patternnexus.com/uploads/images/202602/image_870x_69926a1b1147d.jpg)
![[IMG_UST10Y_WEDGE_FULL_ALT]](https://patternnexus.com/uploads/images/202602/image_870x_69926a1c181c2.jpg)
![[IMG_UST10Y_6Y_WINDOW_ALT]](https://patternnexus.com/uploads/images/202602/image_870x_69926a1cdd841.jpg)
![[IMG_UST10Y_6Y_OVERLAY_ALT]](https://patternnexus.com/uploads/images/202602/image_870x_69926a1db681b.jpg)
Long yields fall → discount rate pressure eases → duration assets breathe → equities can melt up even as the real economy weakens → policy permission increases → convexity gauges front-run the relief narrative. The trap is thinking “rally = healthy.” Sometimes rally is just the machine anticipating the next backstop.
Market function: the layer that decides “orderly” vs “accident”
There’s a second layer behind the yield curve that determines how violent the next move is: market function. Function is depth, liquidity, and clearing. It’s whether the system can absorb duration supply and volatility without a cascade.
This is where “the curve” meets “the plumbing.” If auctions tail, bid-to-cover weakens, repo stress shows up, and volatility spikes in the most “boring” instruments, you’re not watching a narrative. You’re watching a constraint get real.
Is the system clearing duration cleanly, or is it clearing through stress? If it’s clearing through stress, everything becomes convex because forced sellers appear faster, and policy permission arrives sooner.
When you compare cycles, use the same math every time:
% change = (New − Old) ÷ Old.
Drawdown = (Peak − Trough) ÷ Peak.
Retrace = (Bounce − Trough) ÷ (Peak − Trough).
Put the same three numbers on each chart (Peak, Trough, Bounce) and you’ll stop arguing with vibes.
The fiscal endgame: debt gravity + AI displacement = permanent household injections
Here’s where I’m not going to play polite. A recession is painful, but it also creates permission. The state gets to do things in crisis windows that it can’t do in calm windows. That’s not a conspiracy. It’s governance incentives.
A recession resets inflation pressure, breaks wage momentum, and provides cover for easing. It also unlocks the fastest political pathway: “emergency measures.” Emergency measures become programs. Programs become rails. Rails become the new baseline.
![[IMG_DEBT_CLOCK_ALT]](https://patternnexus.com/uploads/images/202602/image_870x_69926b6497236.jpg)
The debt clock snapshot is the vibe check people avoid because it’s uncomfortable. You don’t need to worship the numbers, you need to understand the constraint it represents: the larger the stock, the more sensitive the system becomes to rates, and the more incentive there is to keep market function alive.
In a high-debt system, the policy menu collapses into a few ugly options: raise taxes, cut spending, inflate, repress yields, or let disorder happen. Most systems choose a blended version: some taxes, some cuts, some inflation tolerance, and steady expansion of stabilizers to keep demand from collapsing.
Debt gravity is the quiet dictator: the system becomes rate-intolerant
Most people treat “debt” like a moral argument. That’s a waste of time. Debt gravity is not morality, it’s mechanical sensitivity. The larger the stock of debt, the more fragile the system becomes to rates because every refinancing cycle re-prices reality. That means policy eventually shifts from “what’s ideal” to “what avoids a funding accident.”
This is the part that matters inside the stack: when debt is big enough, the system becomes rate-intolerant even if the public pretends it isn’t. That doesn’t mean rates can’t spike. It means rate spikes turn into political emergencies faster, which accelerates permission windows. That’s why this whole machine speeds up over time.
Higher debt stock increases sensitivity to rates → political tolerance for prolonged tightness drops → the system searches for off-ramps: targeted relief, liquidity backstops, regulatory tweaks, and eventually more overt stabilization.
Translation: the longer this goes, the more “policy” becomes plumbing management rather than “discipline.”
Now layer in the part everyone avoids: the constraint is not only the federal balance sheet. It’s the total system balance sheet. Households. Commercial real estate. Corporate refinancings. Banks. Shadow credit. You don’t need a “crisis” headline to get a crisis dynamic. You just need enough rolling maturities colliding with enough tightness.
That’s why I keep pushing “rates as enforcement.” Enforcement hits unevenly. It breaks the weakest links first. Then it walks inward. And by the time the headline index finally reacts, the plumbing has been under stress for months.
You’ll see versions of this across macro schools, even if they use different language:
Long-term debt cycle framing: debt accumulation forces a choice set (austerity, inflation tolerance, repression, default/implicit default).
Money & plumbing framing (“money view” / eurodollar focus): what matters is collateral, dealer balance sheets, and market function under stress.
“Regime change” market framing: a multi-decade disinflation tailwind ended; duration is no longer “free.”
Pattern Nexus just pins them to one machine: constraint → fracture → permission → injection → repeat.
The point is not “doom.” The point is trajectory. When debt gravity rises, the system’s stability mandate becomes more dominant than its discipline mandate. That’s why transfers, backstops, and rails modernization aren’t a weird conspiracy. They’re the predictable path of a system trying to stay functional under higher constraint.
2020 proved the proof-of-concept: direct household injection stabilizes demand at scale without waiting on “job creation.” Once a system proves it can do something, it doesn’t unlearn it. It builds institutions around it.
2020 wasn’t a one-off, it was a field test that passed
People still talk about 2020 like it was a temporary detour. It wasn’t. It was a systems test: “Can direct household injection stabilize demand fast enough to prevent a cascading collapse?” The answer came back: yes. Once a control system learns a tool works, it doesn’t erase it. It refines it, routinizes it, and builds delivery infrastructure around it.
That’s why I keep saying: recessions create permission, permission creates programs, programs create rails. The program is the policy headline. The rail is the permanent upgrade.
Even mainstream institutions are increasingly explicit about two things:
1) Task disruption is real: AI shifts which work is valuable and which work gets automated, with heavy pressure on reskilling and displacement in parts of white-collar work that used to feel insulated.
2) Productivity gains won’t distribute evenly: even if aggregate output rises, the labor share and wage distribution can still fracture.
Pattern Nexus translation: productivity does not automatically solve stability. It often creates a distribution problem that becomes a policy problem.
Now plug that into the consumer-economy constraint. If you hollow out the wage engine across the middle class, you don’t get a clean “new jobs appear” story fast enough to prevent political instability. So the system does what systems do: it uses stabilizers to buy time, reduce volatility, and keep demand from face-planting.
Here’s the under-discussed detail: the future is rarely “one giant UBI bill.” The future is stacking. Tax credits. Subsidies. Targeted transfers. Eligibility expansions. Recurring disbursements. Automatic triggers. If you want to see where this goes, don’t ask “Will we get UBI?” Ask: Which benefits will become more frequent, more automatic, and delivered with less friction?
One giant program triggers ideological war. Ten smaller mechanisms look like “pragmatism.” That’s why stacking wins. It also makes rollback nearly impossible because each piece develops a constituency and a dependency chain.
And that’s the bridge into the next section: if injections become more common, speed matters. Friction becomes a liability. Delays become instability. That’s why the rail is not a fintech novelty. It’s a stabilization weapon.
Yes, new jobs will appear. The question is timing and distribution. If displacement hits faster than retraining absorbs, you still get a permission window. If new jobs concentrate in fewer regions/skill bands, you still get a political stability problem. Pattern Nexus isn’t claiming “no new jobs.” It’s claiming: the transition volatility forces stabilizers.
Now attach AI/robotics to that. As automation replaces labor across the middle class, not just the fringe, the system faces a hard constraint: you cannot run a consumer economy if the wage engine gets structurally hollowed out.
So the end goal becomes obvious: more direct injection into households to keep demand stable. We already have fragments of this everywhere: food assistance, housing vouchers, healthcare mechanisms, credits, subsidies. In a high-displacement future, those do not shrink. They expand, widen eligibility, become more automatic, and move onto faster rails.
If middle-class suburbia gets displaced by machines at scale, the system will route money into households to keep people calm and consuming. Yes, “still going to Target.” That’s the stability mandate in a managed economy.
Not one giant UBI headline. More often it’s stacked mechanisms: recurring credits, subsidized essentials, expanded eligibility, faster disbursement, and automatic triggers. The public experiences it as “help.” The system experiences it as demand stabilization.
The political economy nobody wants to say out loud
There are two ways a high-debt, high-automation society stays stable. One is wages keep pace. The other is the system routes purchasing power through stabilizers. If AI compresses labor share and concentrates output into capital, the second path expands by default.
This is why you should expect a slow, relentless drift toward transfer normalization, not because politicians are “nice,” but because instability is expensive, and the modern state will pay to avoid uncontrolled disorder.
If you believe transfers widen, then the next question is unavoidable: what rails carry them? That’s why the dollar discussion is no longer just “DXY up/down.” It’s settlement, compliance gates, collateral preference, and the rails war.
Dollar regime reset: dominance vs tightness, and the rails war
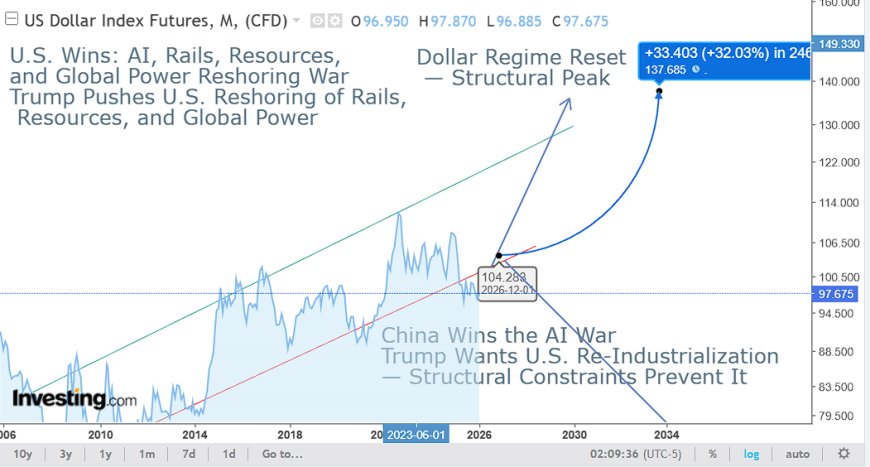
Bret’s “late-stage USD-centric system” point is directionally correct, but we need to be precise. Bretton Woods as a peg system is dead history. What exists now is a USD-centric settlement and collateral architecture. That architecture can mutate without “dying,” and it can remain dominant while still inflicting tightness shocks on the world.
This is also the clean answer to Alex’s question about China “defying theory.” China can manage currency outcomes through controls and policy tools. That can create stability without creating reserve dominance. Reserve status is not “my currency held up.” Reserve status is deep open markets, trusted collateral, legal predictability, and global preference for settlement at scale.
Reserve currency vs operating system: don’t confuse the label with the pipes
Most “de-dollarization” debate is sloppy because people argue past each other. One side talks about reserve composition. The other side is actually talking about the operating system: collateral, clearing, settlement, compliance gates, and who controls the kill switches.
Here’s the clean split: you can diversify reserves at the margin and still remain locked into USD-centric rails for real-world function. The USD can be less loved and still be the default because the pipes are deep, liquid, and enforceable.
“Plumbing first” people focus on collateral and balance sheets: who can fund, who can make markets, and what collateral the world accepts at scale.
“Commodity/real-asset collateral” people argue the next regime leans more heavily on energy/inputs and strategic supply chains as the backing logic (even if the invoice is still USD).
“Network power” people focus on rails and enforcement: the currency that clears easiest under the most globally accepted rule-set keeps dominance longer than expected.
Pattern Nexus holds all three: collateral + network + enforcement equals dominance. Tightness is what happens when those pipes become scarce.
This is also why “China defies theory” is the wrong frame. Controls can manage a currency path. They cannot instantly manufacture global settlement preference because settlement preference is built out of liquidity, legal predictability, market depth, and trust in collateral conversion. That takes decades.
So when you look at the dollar chart, don’t just ask “up or down.” Ask: Is it dominance strength (functioning pipes) or tightness strength (shortage stress)? That one distinction explains half the chaos people blame on “manipulation.”
Dominance: preferred rails + preferred collateral + system function.
Tightness: dollar shortage + collateral shortage + stress + liquidation.
Tightness strength is when “nothing makes sense” because everyone is selling what they can to raise dollars.
The “rails war” isn’t a slogan, it’s the real battlefield: settlement rails, collateral rules, compliance gates, and payment primitives. This is why the dollar can stay dominant even while the world talks about diversification. Diversifying reserves is not the same as replacing the operating system.
Rails war, explained like a mechanic: speed, friction, and control points
Rails are the path money takes. Whoever owns the path owns the rules. And in a high-debt, high-volatility world, the system’s goal is simple: keep function alive. Faster rails are not just “convenience.” Faster rails are stability tooling.
When people talk about stablecoins, tokenized treasuries, instant settlement, or atomic settlement like it’s a crypto hobby, they’re missing the macro point. If your stabilizer strategy is “inject money quickly in stress,” then rails that reduce settlement time and friction become strategic assets.
Serious plumbing institutions have been discussing faster settlement, tokenization primitives, and the mechanics of reducing counterparty/settlement risk for years. You don’t have to “like” the direction to see it: the finance system is trying to modernize the pipes because the old ones are slow, layered, and fragile under stress.
Now connect it to our fiscal endgame claim. If stabilizers widen, the system wants delivery that is: more direct, more automated, cheaper to administer, and less dependent on broken intermediaries. That’s why the “rails war” is a macro war: it determines who can deliver relief, who can enforce compliance, and who can monitor flows.
Dominance strength: your rails clear easiest, your collateral is preferred, and the world accepts your rule-set because it functions reliably.
Tightness strength: dollars become scarce, collateral becomes scarce, and everyone scrambles for settlement-grade instruments. That’s when the pipes feel like a weapon because scarcity turns the rule-set into pressure.
And this is where our framework gets sharper than standard commentary: the same system can be dominant and still generate tightness shocks, because dominance means everyone depends on the pipes. Dependence plus scarcity equals stress events.
What to watch inside the rails war (practical indicators)
- Adoption: where is real settlement moving (treasury collateralization, wholesale payments, cross-border corridors)?
- Gatekeeping: where do compliance rules tighten (KYC/AML, sanctions enforcement, on/off ramps)?
- Collateral preference: what instruments get treated as settlement-grade under stress?
- Speed under crisis: which rail can deliver relief faster with fewer intermediaries?
Fragmentation can happen at the edges: bilateral trade, regional payment systems, commodity deals. The question is whether that replaces the core operating system for global collateral and deep liquidity. Even in fragmentation, big players still route through the deepest pools when stress hits. PN claim: share can fall without dominance collapsing, because dominance is a function of liquidity + enforcement + collateral preference, not headlines.
Rails dominance is: the easiest, most liquid, most accepted path for large-scale settlement and collateralization. If your trade finance, commodities, and cross-border payments still clear through USD-native pipes, the system is still USD-centric even if headlines say “de-dollarization.”
What the institutional world is actually building
Here’s the tell: serious institutions are not building “anti-dollar” fantasies. They’re building faster settlement, programmable compliance, and atomic delivery-versus-payment so the machine can move value with less friction. That is rails dominance, not ideology.
Tokenisation and programmable platforms matter because they compress a bunch of steps into one: messaging, reconciliation, asset transfer, and cash settlement. When this becomes atomic and 24/7, you’re looking at a capability shift, not a fintech toy.
If stabilizers widen, distribution speed becomes policy. Faster, cheaper rails reduce friction and expand the system’s ability to stabilize demand quickly in stress windows. That’s why rails are macro plumbing, not a side quest.
Now layer FX reality on top of it: global FX turnover is gigantic because the world is still moving through this operating system. The more the system grows, the more demand there is for the pipes, the collateral, and the compliance gates.
Metals and crypto: convexity gauges (silver, gold, bitcoin)
Silver: leveraged expression and forced-selling physics
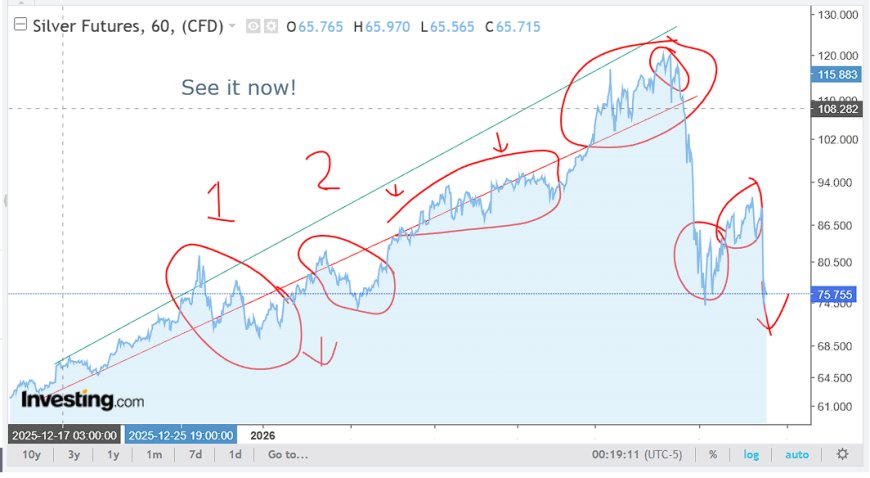
Silver is where people lose their minds because it’s emotional and narrative-heavy. But the tape is mechanical. Vertical moves invite leverage. Leverage invites margin. Margin plus volatility invites forced selling. Forced selling is why “the obvious trade” nukes people.
Phase 1: Build (quiet accumulation, higher lows).
Phase 2: Narrative ignition (breakout, attention, inflows).
Phase 3: Leverage swell (violent ramps, funding/positioning stretches).
Phase 4: Flush (margin calls, air pockets, “this is manipulated” tantrums).
Phase 5: Rebuild (structure matters: do higher lows form after the flush?).
Gold: credibility hedge and the anchor inside the stack
![[IMG_GOLD_ALT]](https://patternnexus.com/uploads/images/202602/image_870x_6992669ecd4d2.jpg)
Gold is not “get rich quick.” It’s a credibility barometer. In a regime where debt gravity grows, and the policy mix keeps drifting toward backstops and yield management, gold behaves like the quiet witness. It doesn’t need a meme. It just needs the machine to keep choosing stability over austerity.
Think of it like this: gold is what the system can’t default on with a policy press conference. It’s not a perfect hedge. It’s an honest gauge of long-run credibility drift.
Bitcoin: liquidity sensor and rails bet
![[IMG_BTC_MONTHLY_ALT]](https://patternnexus.com/uploads/images/202602/image_870x_698d662ec47d1.jpg)
![[IMG_BTC_WEEKLY_ALT]](https://patternnexus.com/uploads/images/202602/image_870x_698d3637dbc58.jpg)
Bitcoin belongs in this stack because it behaves like a forward-looking liquidity sensor and a rails-adjacent asset. When liquidity is on, BTC levitates. When liquidity is off, it reverts hard because marginal buyers and leverage disappear. That’s the same mechanical story as silver, just on a different instrument with a different holder base.
BTC also expresses something deeper: a bet that future money movement becomes more digital, more automated, and more rail-driven. Even if you hate BTC, you can’t ignore the direction of the world: faster settlement, tokenisation, compliance-native rails. That trend is real whether BTC wins or not.
The signal isn’t “up today.” The signal is how BTC and metals behave after forced flushes. Do they rebuild higher lows while the system moves toward relief, rails expansion, and stabilizers widening? That’s the convexity tell inside a regime reset.
Dow structure: throughput channel, automation dividend, and top-structure signatures
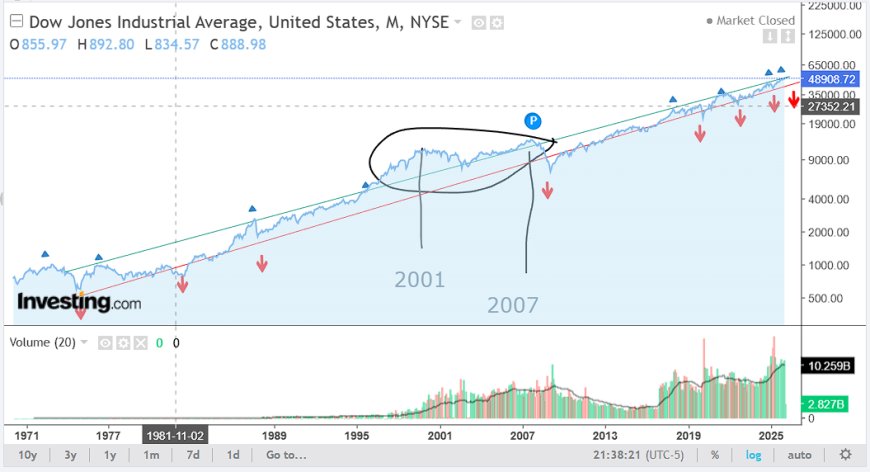
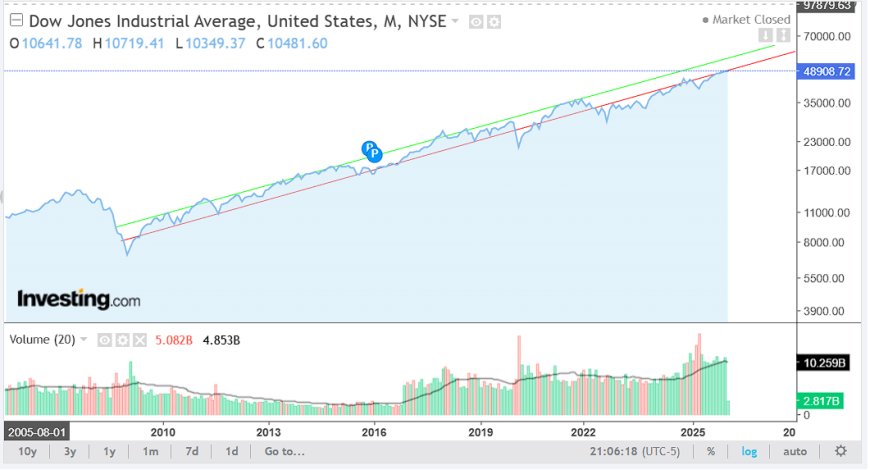
People call the Dow “old economy” like that means it’s irrelevant. In an AI-industrial regime, that’s backwards. AI is not just software. AI plus robotics is a cost structure revolution in physical production. If you can run sites 24/7 with fewer humans and tighter error rates, margins expand. That’s throughput. That’s industrial value creation.
Here’s the connection back to the curve: if the 10Y resolves lower (bull-steepener path), the discount-rate pressure that capped index multiples eases. That can fuel a “melt up” even while the real economy is cracking underneath. That’s why tops often look like calm indexes plus deteriorating internals, not “scary headlines.”
Liquidity props the index → internals degrade → the curve stays restrictive → rallies look like breakouts → structural constraints reassert → reversion back into the channel (or to the lower boundary) before the next permission window arrives.
Tops are usually process, not a single candle. You get repeated breakout attempts with weaker breadth, rotation into defensives/quality, rising funding stress, and tails cracking first. The headline index can look calm while the internal structure deteriorates.
The automation dividend is not a vibe, it’s margins
If you’re trying to understand why “equities won’t die,” model the baseline incentives: companies will automate because it’s a survival advantage. That turns labor cost into capex, then turns capex into sustained margin improvements if demand holds.
Which loops back to Section 3: if demand is threatened by displacement, stabilizers widen. Stabilizers widen, demand holds. Demand holds, throughput assets compound. This is why the Dow matters inside this specific regime. It’s one of the cleanest “real economy automation” baskets left on Earth.
Tail risk: microcaps, buyer exhaustion, and why junk cracks first
Microcaps aren’t “the macro,” but they’re a liquidity thermometer because they live on marginal demand. When buyers are exhausted, the tape gets ugly. That ugliness shows up in the tail first and then walks inward. If you want early warning signals, you watch where marginal demand lives.
- Tail cracks often precede broader risk tightening
- Chop + failed rallies = buyer exhaustion, not “healthy consolidation”
- If spreads widen while the dollar is strong, tail stress is telling you it’s tightness, not dominance
The tail is funded by confidence and cheap money. When funding tightens, the tail loses bids, liquidity vanishes, and selling becomes self-reinforcing. You can watch this in microcaps, in low-quality credit, and in anything that depends on constant marginal inflows.
In a regime reset, this “tail first” behavior is a feature, not an anomaly. The system is trying to reprice constraint. The weakest collateral and weakest balance sheets get repriced first. That’s what “tightness” means when you zoom out.
Orderly vs disorderly: what transitions look like in real systems
The better question isn’t “does the USD die.” It’s whether the system transitions in an orderly way (rules change while function holds) or a disorderly way (function breaks and backstops become routine). Real systems rarely collapse on schedule. They mutate, patch, reroute, and tighten enforcement. That’s what “orderly” looks like.
Curve chops but market function holds, dollar strength is mostly dominance, convexity assets trend with flushes but no constant liquidation spirals, and stabilizers expand gradually under “resilience” language.
Funding stress returns in waves, dollar spikes coincide with widening spreads, tails crack repeatedly, backstops normalize, and transfers expand faster because stability becomes the only priority.
John’s “background conditions changed” point fits here. AI and demographics don’t remove cycles, they change timing and distribution of pain. Same machine, new parameters. That’s why the regime looks weird.
The real “reset” is rules + rails, not a flag-plant event
Orderly transitions look like administrative upgrades: new settlement standards, more programmable compliance, tighter collateral rules, more direct stabilization triggers, and more normalized intervention language. The machine keeps working, but the social contract quietly changes underneath.
Disorderly transitions look like repeated breaks in the same places: funding, collateral, and trust. When those go, the only remaining tool is bigger backstops. That’s when “temporary” becomes “the baseline.”
Indicator stack: what to watch next (pipes, not vibes)
If you want this to be actionable, build a repeatable indicator stack that tells you which branch you’re in. Not vibes. Not politics. Pipes.
Curve slope: re-steepening from growth crack versus re-steepening from term premium expansion.
10Y structure: wedge resolution tells you whether recession pricing is winning (down) or term premium is expanding (up).
Credit spreads: widening with USD strength = tightness stress, not “strength.”
Market function: depth, auction behavior, volatility of “safe” assets, repo smoothness.
Labor cracks: layoffs/hiring freezes confirm the inversion is transmitting.
Program language: watch for benefit-expansion rhetoric as the system prepares wider stabilizers.
Convexity structure: higher lows after flushes (metals/BTC) is the tell, not the day-to-day noise.
Tail stress: microcaps/junk breaking first is the early warning light.
Strong dollar + widening spreads + deteriorating function + tails cracking = tightness. Tightness is the regime where liquidation beats narratives.
You’ll see it before policy acts: rising unemployment narratives, “protect households” framing, “resilience” rhetoric, and a shift from inflation obsession to growth concern. That’s permission crystallizing in public language before it crystallizes in programs.
Pattern Nexus Lens
Pattern Nexus treats macro as a control architecture. The yield curve is policy colliding with credit creation. Inversions are the system punishing lending until demand breaks. Recessions are the reset window that creates permission for easing and fiscal expansion. Debt gravity narrows choices, so the system leans toward backstops and stabilization rather than austerity. 2020 proved direct household injection can stabilize demand at scale. AI and robotics make that injection trend structural because labor displacement at scale is not politically survivable without compensation. The dollar sits above all of it as rails and collateral preference, sometimes dominance, sometimes tightness. Metals and bitcoin are convexity gauges in liquidity shifts. The Dow is throughput under automation inside a secular channel.
The machine cycles: tightness (rates) → fracture (recession) → permission (crisis) → injection (fiscal), while automation steadily rewrites the labor contract. Model the loop and the chart stack becomes readable.
FAQ
Are you saying the government wants a recession?
I’m saying recessions can be strategically useful in a managed credit system because they reset inflation pressure and create policy permission for easing and program expansion. Incentives explain behavior better than outrage.
Are cycles invalid because AI and demographics?
Cycles persist because constraints persist. AI changes speed and distribution. Demographics changes the slope and political tolerance for stress. Same machine, new parameters.
Why does a strong dollar sometimes coincide with chaos?
Because you’re watching tightness, not dominance. Dollar shortage plus collateral shortage forces global selling and liquidation to raise dollars. Strength plus fracture is tightness.
Is “more direct transfers” guaranteed?
Nothing is guaranteed. The claim is directional: as displacement spreads into the middle class, the system will expand stabilizers because the alternative is instability. That’s the incentive structure.
Why are silver moves so violent compared to gold?
Silver behaves like leveraged gold with extra narratives attached. Leverage + margin + volatility creates forced selling that gold often absorbs better. Gold is the anchor. Silver is the amplifier.
Sources
Primary references for rate/curve series, dollar series, reserve/settlement context, and the rails/plumbing layer.
- FRED: Treasury yields, curve series, macro indicators
- FRED: Nominal Broad U.S. Dollar Index (DTWEXBGS)
- Federal Reserve H.10: Dollar index methodology overview
- IMF: COFER reserve composition dataset
- BIS: FX survey overview (global settlement context)
- US Debt Clock: snapshot context
- World Economic Forum: Future of Jobs Report 2023 (AI/automation displacement framing)
- Goldman Sachs: AI potential effects on growth (jobs exposure + productivity thesis)
- BIS: Triennial Survey update (FX turnover scale and composition)
- BIS: Tokenisation, atomic settlement, and programmable platforms (rails/plumbing direction)
Hvad er din reaktion?
 Synes godt om
0
Synes godt om
0
 Dislike
0
Dislike
0
 Kærlighed
0
Kærlighed
0
 Sjov
0
Sjov
0
 Wow
0
Wow
0
 Trist
0
Trist
0
 Vred
0
Vred
0

Founder of Pattern Nexus. I research markets, macro, geopolitics, AI, history, ancient systems, and the patterns most people overlook. I’m also building Market Radar, a trading scanner designed to read pressure, risk, confirmation, and setup quality before chasing a move. Pattern Nexus is where I connect the dots between data, history, technology, and the bigger system playing out around us.


















Kommentarer (0)