
America’s New Map of Power: Data Centers, Grid Shortfall, and the AI Industrial Build-Out
A single map of U.S. data centers reveals the real AI-industrial build-out: clustered power demand, a 40–50 GW grid shortfall, forced nuclear restarts, and a new liquidity regime that makes QE-style support inevitable.
America’s New Map of Power: Data Centers, Grid Shortfall, and the AI Industrial Build-Out
A single map of U.S. data centers tells you more about the next decade than any FOMC press conference: clustered AI demand, a 40–50 GW power shortfall, forced nuclear restarts, and a liquidity regime that can’t tighten without killing the new industrial engine.
The Map That Gives the Game Away
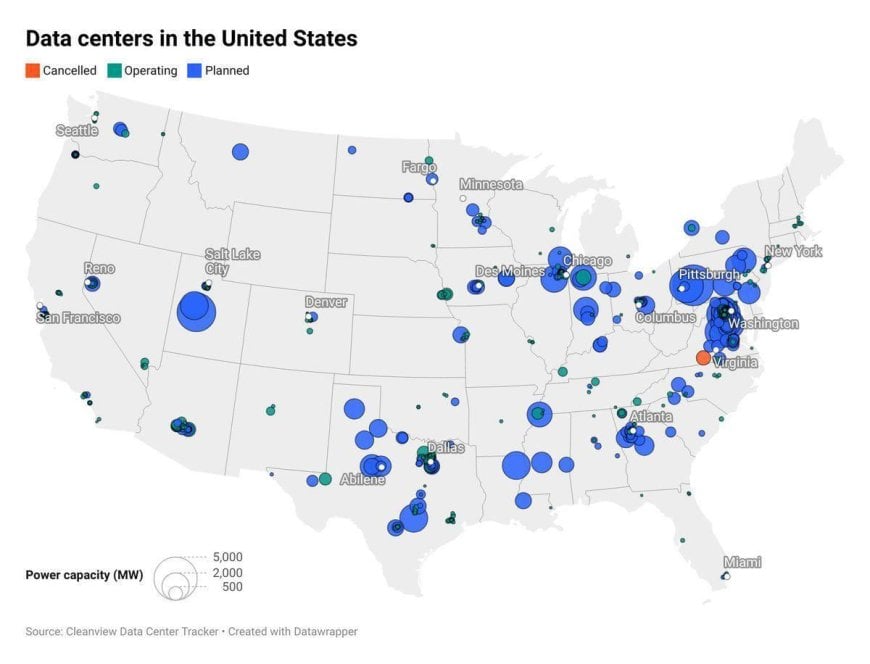
This isn’t just a tech map; it’s a forward-dated X-ray of the American economy. Every blue or green circle is a megawatt sponge: racks of GPUs and CPUs that don’t care about your political narrative, only about watts, wires, water, and capital.
In AI Compute and Power Infrastructure in 2025 — The New Industrial Backbone, we drew the line from chips to transformers to transmission. This map is that thesis rendered visually. It shows:
- Where AI lives — clusters of training and inference capacity.
- Where the grid will buckle first — overloaded substations and constrained corridors.
- Where capital will be forced — utilities, nuclear, wires, transformers, and land.
You can treat this map as a kind of 2030 forecast of U.S. infrastructure, just expressed as bubble sizes instead of bond yields. It’s also a preview of where the next generation of liquidity, jobs, and political leverage is going to concentrate.
Clusters: Where the AI-Industrial Backbone Is Forming
Zoom in, and patterns start to jump out. The U.S. isn’t building “a few more server farms.” It’s constructing compute basins — geographic zones where fiber, power, land, and capital converge into long-lived AI infrastructure.
Northern Virginia: The Saudi Arabia of Compute
The densest constellation on the map is still Northern Virginia. Loudoun, Prince William, and surrounding counties already host the largest concentration of data centers on Earth, and they’re now layering AI clusters on top of legacy cloud campuses.
Power demand here is moving into the multi-gigawatt range. One metro area begins to resemble a mid-tier nation’s entire grid. The political result is obvious: Virginia now has leverage in national energy, zoning, and even federal digital-security discussions, whether lawmakers understand why or not.
Texas: Deregulated Grid, Maximum Build-Out
Next big hotspot: Texas — Dallas, Abilene, Austin–San Antonio. ERCOT offers what hyperscalers crave:
- deregulated power markets,
- fast permitting,
- huge wind and solar baseload, and
- cheap land with transmission corridors already in motion.
Texas is slowly turning into an AI–energy industrial stack: data centers + renewables + gas peakers + (soon) nuclear. In the Big Tech Fusion Bet piece, we showed how AI demand is quietly underwriting the economics of advanced nuclear. Texas is where that theory starts hardening into steel and concrete.
Midwest & Great Lakes: The Next Compute Belt
Look at the arc from Chicago through Columbus and up toward Michigan and western Pennsylvania. This is the Next Compute Belt — cooler climate, lower land costs, and direct access to existing industrial load centers and transmission.
These sites often sit near:
- retired or retiring coal plants,
- legacy manufacturing corridors, and
- multi-decade high-capacity transmission lines.
Data centers are effectively plugging into the skeleton of the old industrial economy. The jobs won’t look like 1950s factories, but the power draw will.
The “Cold Belt” West: Cooling, Renewables, and Risk Management
From Reno to Salt Lake City to Denver and the Pacific Northwest, you see scattered but sizable bubbles. These are bets on:
- cooler ambient temperatures (cheaper cooling),
- high renewable penetration,
- lower wildfire and hurricane risk than coastal hubs, and
- access to hydro, nuclear, or large interconnects.
The West is becoming a redundancy layer for AI. When one coast gets hit by weather, politics, or grid constraints, compute routes through the other.
The Dog That Didn’t Bark: California Proper
The relative absence of big new bubbles in California isn’t an accident. High land prices, slow permitting, grid instability, and regulatory hostility to heavy load are driving the future of California’s tech infrastructure out of California.
Silicon Valley will still design chips and models. But more and more, the metal, megawatts, and money land in Nevada, Texas, the Midwest, and Virginia.
The 40–50 GW Shortfall: Why the Grid Breaks First
Now combine this map with the projections from utilities, regulators, and the banks that actually finance this transition. Across multiple studies, you see the same number converge: a 40–50 gigawatt shortfall in U.S. firm power capacity by the late 2020s, driven heavily by AI-driven data centers plus onshoring of industrial load.
That shortfall isn’t “we might get a little tight.” It’s:
- regional brownouts unless load is curtailed,
- chronic congestion at key substations,
- soaring capacity prices, and
- political pain when hospitals are competing with GPUs for reliable power.
In the AI infrastructure piece we walked through the hardware stack: transformers, switchgear, high-voltage lines, and substation upgrades. All of those are long-lead items. You don’t close a 40+ GW firm-capacity gap with two press releases and a few solar farms.
Why Renewables Alone Can’t Patch the Hole
You can absolutely add huge amounts of wind and solar. But to replace firm thermal or nuclear capacity with variable generation, you need a massive overbuild — and then storage — and then transmission — all in a permitting environment that can barely get a single line approved.
The result: renewables will grow fast and still be insufficient. They will help flatten the problem, not eliminate it. The baseload hole remains, and AI is making that hole deeper every quarter.
Why Data Centers Can’t Just “Use Less”
Classic demand response says: “when the grid is tight, you throttle industrial load.” That works if your customer is an aluminum smelter. It doesn’t work if your customer is:
- a hospital inference cluster,
- a national-security model, or
- a trading firm whose revenue depends on nanosecond-level latency.
AI load is sticky, high-value, and politically protected. Once deployed, it will not be voluntarily switched off. That means the rest of the grid gets squeezed first.
Nuclear’s Forced Comeback and SMR-Native Data Centers
When you map “where AI wants to be” onto “where the grid can actually give it power,” you run out of easy answers fast. That’s why nuclear keeps reappearing in utility plans, DOE loan programs, and Big Tech energy announcements — no matter how unpopular the word still is in some political circles.
The logic chain is brutal but simple:
- AI demands continuous, high-density, low-carbon power.
- The U.S. grid is heading into a multi-decade supply–demand imbalance.
- Permitting for large-scale transmission is slow and contested.
- Gas is flexible but politically insecure and pipeline-constrained.
- Coal is being retired, not added.
That leaves advanced nuclear and Small Modular Reactors as the only scalable way to add firm, zero-carbon power close to where loads actually sit.
Data Centers as Anchor Tenants for SMRs
The next step is obvious: you start pairing SMR campuses directly with data-center campuses. Instead of a generic grid asset hunting for buyers, you have:
- a known, creditworthy AI or cloud operator,
- a long-term power purchase agreement (20–30 years), and
- co-designed cooling and heat-reuse systems.
From a financing standpoint, that transforms nuclear from “speculative megaproject” into something closer to an infrastructure REIT with a built-in hyperscaler tenant.
Policy: When AI Becomes a National-Security Grid Asset
Layer on top the national-security angle: whoever controls AI compute density controls everything from code to capital markets to military logistics. At that point, keeping AI clusters powered is no longer “a corporate need” — it becomes a national-security requirement.
That’s the moment when federal policy flips from tolerating nuclear to actively sponsoring it: DOE loan guarantees, accelerated licensing pathways, bundled AI-nuclear industrial zones. The map you’re looking at today is the pre-policy baseline. Once the policy catches up, the clusters intensify.
Liquidity, Treasuries, and Why Tightening Becomes Fiction
All of this steel, copper, silicon, and uranium has to be financed. Data centers, substations, transmission lines, SMRs — these are 10–30 year assets funded with leverage. The map you’re staring at is also a map of future debt issuance:
- utility bonds and rate-base expansions,
- corporate credit from hyperscalers,
- municipal infrastructure debt, and
- federal incentives and guarantees that ultimately link back to Treasuries.
In The Hidden Liquidity Crunch: Repo Stress, QT’s End, and the Dollar’s Trap we walked through how the Fed’s attempt at sustained QT collides with structural funding needs. This map is one of those structural needs rendered spatially.
QE-Style Support by Another Name
You can call it QE, YCC, or “balance-sheet flexibility.” It doesn’t matter. When you must:
- refinance a giant stock of existing government debt,
- fund a multi-trillion AI-industrial build-out, and
- avoid a disorderly bond market while doing both,
you are not operating in a world of clean, voluntary tightening. You’re in a world where liquidity support becomes a structural feature.
AI data centers don’t show up on the Fed’s balance sheet. But the utilities and Treasuries that feed them do. The more blue circles on this map, the harder it is to run a genuine, sustained QT without breaking something important.
Tokenized Rails and the Next Reserve Layer
As the dollar’s architecture evolves , this build-out gives it a new backbone: AI-industrial capacity paired with tokenized rails (tokenized Treasuries, stablecoins, and CBDC-adjacent infrastructure).
In the Tokenized Reserve Era, the reserve asset isn’t just a Treasury; it’s a Treasury embedded in a compute-and-energy system that the rest of the world depends on. This map is where that dependency is physically located.
Population, Housing, and the New Geography of Wealth
Where compute goes, people follow — even if with a lag. You don’t need millions of workers to run a data-center cluster, but you do need:
- construction crews,
- engineers and technicians,
- spin-off AI companies, and
- the service economy that accretes around those incomes.
That means this map is also a preview of:
- which metros will quietly compound housing demand,
- which second-tier cities will become AI-adjacent hubs, and
- which regions will be forced to modernize infrastructure just to keep up.
In the Systemic Realignment series , we talked about housing as a slow-moving collateral base for the entire financial system. The AI-industrial map overlays directly on that: regions that capture compute demand also capture collateral inflation.
If you’re thinking in decades, not quarters, you want exposure to land, housing, and local businesses in the corridors where the blue circles are thickest.
Patternist Watchlist: Signals to Track From Here
A Patternist doesn’t just stare at the map; they wire it into a watchlist. Here are the key signals I’d track over the next 3–5 years:
- Utility IRPs (Integrated Resource Plans)
Every time a major utility updates its 10–20 year plan, look for how much new capacity is “AI-driven” and how much is being shifted from coal/gas to nuclear plus renewables. - SMR and Advanced Nuclear Deals Anchored by Tech
Watch for data-center operators signing on as anchor tenants for SMR projects. Those contracts will be the true birth certificate of the AI–nuclear era. - Transmission Bottleneck Hotspots
Wherever large AI clusters intersect constrained transmission, you’ll see politics heat up: local moratoria, lawsuits, “pause” campaigns. That’s where risk and opportunity both spike. - Capacity Prices and Grid Emergency Events
Spiking capacity prices or repeated grid-emergency alerts in regions with large data-center clusters tell you the shortfall is materializing faster than official forecasts admit. - Fed and Treasury Language Around “Orderly Markets”
The more often policymakers talk about maintaining “orderly functioning” in Treasuries and credit markets while this build-out accelerates, the closer you are to another round of implicit QE, even if it’s not branded that way. When officials insist the system is “resilient” but quietly expand backstops, read that as a translation of this map into policy: the AI-industrial engine cannot be allowed to stall.
Taken together, these signals turn the data-center map into a living dashboard. You’re not guessing about the future; you’re watching it harden into steel, copper, concrete, and policy in real time.
The Pattern Nexus View
Strip away the jargon and this map is simple: AI is becoming the organizing principle of the next U.S. industrial cycle. To exist, it needs dense compute. Dense compute needs dense power. Dense power needs new grid infrastructure, nuclear restarts, and trillions in funding.
That loop won’t be broken by a few rate hikes. It won’t be reversed by a recession narrative on cable news. Once enough capital has been sunk into this AI–power stack, the system’s priority quietly shifts from “fighting inflation” to protecting the industrial base that underwrites the currency.
In the Systemic Realignment series, we framed this as a transition to a new global operating system: digital sovereignty, multipolar liquidity, and infrastructure as collateral. Here, you’re seeing one slice of that system rendered geographically.
Pair this with:
- Big Tech’s Fusion Bet (how AI demand re-prices energy and nuclear),
- AI Compute and Power Infrastructure 2025 (the hardware stack),
- The Hidden Liquidity Crunch (the funding rails), and
- The Dollar Isn’t Collapsing, It’s Evolving (the monetary architecture),
and you get the full Pattern Nexus view: AI-industrial build-out, grid shortfall, nuclear restart, and liquidity regime are all parts of the same pattern.
A Patternist doesn’t treat this as trivia. You use it to position:
- your investments (energy, infrastructure, real assets, and liquidity winners),
- your career (skills that plug into this stack instead of being displaced by it), and
- your geography (where you live, build, and own collateral).
The map will keep changing as new circles appear and old ones get cancelled. The pattern underneath it — AI demanding power, power demanding capital, capital demanding policy — is the part that persists.
Sources & Further Reading
This article builds on public grid and data-center projections plus the broader Pattern Nexus framework. A non-exhaustive sample of references and context:
- Cleanview Data Center Tracker – U.S. data-center locations and estimated MW capacity (basis for the map shown above).
- Integrated Resource Plans and long-term capacity filings from major U.S. utilities (documenting expected demand growth, data-center contributions, and planned nuclear/renewable additions).
- U.S. DOE and regional grid operators on projected capacity shortfalls and interconnection backlogs (evidence of the emerging 40–50 GW firm-power gap).
- Pattern Nexus:
- Big Tech’s Fusion Bet: AI, Energy Demand, and Rewriting the Physics of the Grid
- AI Compute and Power Infrastructure in 2025 — The New Industrial Backbone
- The Hidden Liquidity Crunch: Repo Stress, QT’s End, and the Dollar’s Trap
- The Dollar Isn’t Collapsing, It’s Evolving — Monetary Liquidity and the Future
- Systemic Realignment: Digital Sovereignty and Multipolar Liquidity
Treat this article as one layer in a larger living library. As the AI-industrial map updates, the Pattern Nexus framework will update with it.
واکنش شما چیست؟
 پسندیدن
0
پسندیدن
0
 نپسندیدن
0
نپسندیدن
0
 عشق
0
عشق
0
 خنده دار
0
خنده دار
0
 وای
0
وای
0
 ناراحت
0
ناراحت
0
 عصبانی
0
عصبانی
0

Founder of Pattern Nexus. I research markets, macro, geopolitics, AI, history, ancient systems, and the patterns most people overlook. I’m also building Market Radar, a trading scanner designed to read pressure, risk, confirmation, and setup quality before chasing a move. Pattern Nexus is where I connect the dots between data, history, technology, and the bigger system playing out around us.












نظرات (0)