
Gold vs. the 10-Year Yield: Why Rate Cuts and Real Yields Point to the Next Inflation Wave
Gold is breaking new highs while the U.S. 10-year yield stalls near 4%. History shows gold moves first — and yields follow. Explore how falling real rates, policy shifts, and inflation expectations are aligning to signal the next major cycle in global markets.
Gold, the 10-Year, and the Inflation Cycle: When the Signal Leads the Policy
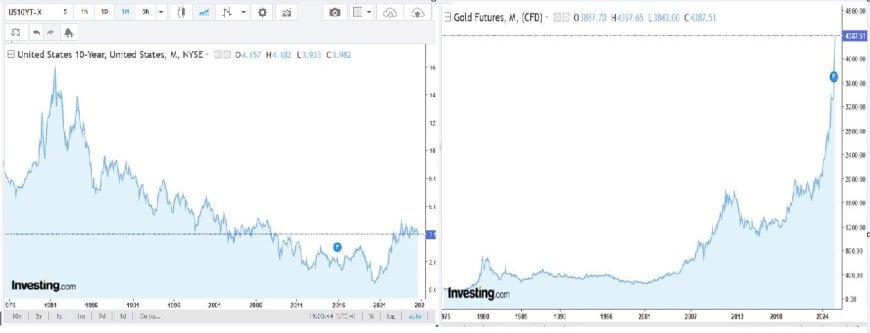
Look at these two charts side by side. On the left, the U.S. 10-Year Treasury yield hovering just under 4%. On the right, gold blasting vertically toward new highs. To most people, these seem like unrelated moves. But in reality, they’re part of the same story — one that has played out before and is likely about to repeat.
Here’s the premise: The 10-year yield is about to fall — potentially by 100 basis points — dropping it into the high-2% range. Meanwhile, gold is taking off. Historically, when gold leads like this, it’s signaling a change in monetary conditions well before the bond market adjusts. Gold moves first; yields chase after. And once again, we’re seeing that pattern unfold.
The Mechanics: Why Yields Matter for Gold
Gold’s relationship with yields — particularly real yields — is one of the strongest and most persistent correlations in macroeconomics. When real interest rates fall (nominal yields minus inflation), gold rises. When real yields rise, gold weakens.
Research supports this: A review published on ResearchGate found that the real interest rate “emerges as the primary driver” of gold’s long-term value. The Chicago Federal Reserve concluded that gold prices are “sensitive to expected long-term real interest rates,” and that a rise in inflation expectations increases gold’s appeal. Even GoldPriceForecast highlights how every major gold boom occurred in environments of negative or declining real yields.
It’s simple math: gold pays no yield. When inflation exceeds what bonds return, cash and Treasuries lose purchasing power. Gold, by contrast, maintains value. So as real yields compress — whether from rate cuts or rising inflation — gold becomes the superior store of value.
Historical Echoes: The 1970s and Post-2007
We’ve seen this dynamic before. Twice, in fact — during the 1970s inflation spiral and again after the 2008 financial crisis.
The 1970s: Nominal interest rates were high, but inflation was even higher. Real yields collapsed, and gold exploded from $35 to over $800. Investors fled fiat assets for tangible stores of value. It was less about interest rates being high and more about them being less than inflation.
Post-2007: The global financial crisis pushed rates near zero. Real yields turned negative as central banks flooded the system with liquidity. Gold once again surged — from under $700 to nearly $1,900 — confirming the same pattern: when real returns vanish, gold becomes the escape valve.
The key takeaway: gold performs in both extremes — when rates are high but inflation is higher (1970s), and when rates are low and liquidity is endless (2008+). The common denominator is the collapse of real yield confidence.
Today’s Setup: The Coming Drop in the 10-Year
Now, we’re in the third act of that cycle. The U.S. 10-Year sits near 4%, but structural pressures — disinflationary forces, fiscal stress, slowing growth — suggest a downward repricing is coming. If the Fed cuts as expected, the 10-year could easily drop by 100 basis points, settling somewhere in the high 2s.
At the same time, gold is already screaming higher. That’s not coincidence — it’s causality in reverse. Gold moves first, anticipating both policy shifts and inflation rebounds before they appear in CPI data. When investors lose faith in policy discipline or currency strength, gold surges. Yields follow once the economic data catches up.
We saw this same lag in the 1970s: gold began climbing years before Volcker’s hikes. After 2007, gold rallied while the Fed was still cutting. The pattern is consistent — markets price in future inflation and policy shifts before central banks act.
The Sequence: Gold → Real Yields → Nominal Yields → Inflation
Here’s how the dominoes typically fall:
1️⃣ Gold breaks out as the market sniffs out monetary easing or inflation risk.
2️⃣ Real yields compress as inflation expectations rise faster than nominal yields.
3️⃣ The 10-year yield begins to drop as investors shift to safety and duration.
4️⃣ Inflation re-emerges, forcing yields back up later — but only after gold’s major run is complete.
That’s the lagging feedback loop between policy and gold. Gold moves preemptively; policymakers react afterward. It’s a sequence that tends to repeat across decades — each time after massive monetary expansion or structural debt inflection.
Supporting Evidence
Several sources reinforce this relationship:
• PIMCO found that a 100-bps rise in 10-year real yields typically corresponds to a 20-25% decline in gold prices.
• LongTermTrends shows a long-term correlation between gold and real yields of roughly -0.8.
• S&P Global noted that gold and yields can rise together during risk-off phases — but that correlation usually reverts once policy shifts materialize.
The nuance here is important: it’s not that “rates down always means gold up.” It’s that gold leads the change in real yields. It’s the leading signal of where monetary stress and inflation expectations are going — not just a reaction to them.
What I’m Watching
Several variables will confirm or refute this setup in the months ahead:
• 10-Year yield movement: a decisive break below 3.5% opens the path to the 2s.
• Inflation expectations: 10-year breakevens rising even as nominal yields fall.
• Fed communication: any sign of pre-emptive cuts or yield-curve control would fuel the thesis.
• Central bank gold buying: continued accumulation supports gold’s long-term bid.
• Growth and employment data: any deterioration accelerates the rate-cut path.
Each of these factors would confirm that the 10-year yield is on its way down — and that gold’s current surge isn’t speculation, but signal.
The Broader Message
We’re witnessing a turning point where markets are quietly acknowledging that inflation isn’t gone — it’s dormant. The Fed can’t hike forever without breaking the system, and it can’t cut without reigniting inflation. That trap leaves one outlet: real yields must fall, and gold benefits directly from that pressure release.
In my view, the 10-year yield dropping into the high-2s is not just possible — it’s probable. And when it happens, the mainstream narrative will flip from “gold is overbought” to “the Fed is losing control.” But by then, gold will already have made its move.
Gold is not reacting to yields. Yields are reacting to gold.
Conclusion
This is the setup I’m tracking heading into 2026: gold breaking new highs while the 10-year yield drifts lower. The last time we saw this pattern, inflation came roaring back within two years. The Fed responded late, and rates had to rebound sharply to contain it. The same dynamic could easily repeat.
Gold moves first, real yields collapse second, inflation follows, and policy reacts last. That’s the loop — and it’s happening again right now.
Gold is the signal. The 10-year yield is the reaction. Inflation is the destination.
#Gold #10YearYield #InflationCycle #MacroAnalysis #PatternNexus #InterestRates #Commodities #MonetaryPolicy #Economy #GoldForecast
واکنش شما چیست؟
 پسندیدن
0
پسندیدن
0
 نپسندیدن
0
نپسندیدن
0
 عشق
0
عشق
0
 خنده دار
0
خنده دار
0
 وای
0
وای
0
 ناراحت
0
ناراحت
0
 عصبانی
0
عصبانی
0

Founder of Pattern Nexus. I research markets, macro, geopolitics, AI, history, ancient systems, and the patterns most people overlook. I’m also building Market Radar, a trading scanner designed to read pressure, risk, confirmation, and setup quality before chasing a move. Pattern Nexus is where I connect the dots between data, history, technology, and the bigger system playing out around us.










نظرات (0)