What If the 6–7% Treasury Yield Trade Is the Trap?
A lot of smart money is starting to position for a 1970s-style inflation repeat where the 10-year Treasury yield spikes toward 6% or 7%. The chart overlay looks convincing. Inflation today can be lined up against the 1970s if the data is shifted and framed the right way. But Pattern Nexus looks at the system constraint, not just the chart. The question is not whether yields can spike. They can. The question is whether the modern economy, the federal refinancing structure, the consumer balance sheet, and the dollar-based global liquidity system can actually survive a sustained 6–7% long-rate environment. This article argues that the more dangerous trade may be the obvious one: expecting the 1970s to repeat cleanly when the system may instead force a spike, break, recession, emergency response, and renewed liquidity cycle.
A Pattern Nexus styled macro-financial title image showing the U.S. 10-year Treasury yield approaching a crowded 6–7% expectation zone before looping back into a recession/liquidity-injection cycle.
Support Independent Pattern Nexus Research
Deep macro plumbing, liquidity mechanics, and system analysis. No sponsors. No paywalls.
Support Pattern Nexus
Independent macro research and system-level analysis. No sponsors. No paywalls.
Pattern Nexus Premium Research
What If the 6–7% Treasury Yield Trade Is the Trap?
The 1970s inflation overlay is becoming one of the most crowded macro narratives in the market. But the modern system does not have a 1970s balance sheet. It has a federal refinancing wall, a consumer exhaustion layer, a dollar-liquidity dependency, and an economy that cannot tolerate long periods of real-rate stress without forcing a policy response.
Published: May 27, 2026 • By Pattern Nexus • Premium Systems Research
Premium Quick Read
A lot of smart money is starting to talk like the 10-year Treasury yield has to spike toward 6% or 7%. The logic is not random. Inflation today can be compared to the 1970s if the charts are shifted, overlaid, and framed around the first wave, the cooling phase, and the risk of a second wave. That chart resemblance is strong enough to pull capital into the same trade.
But the chart is not the whole system. The 1970s inflation path happened inside a very different balance sheet. Today, higher long rates transmit into federal interest expense, mortgage affordability, commercial real estate, bank balance sheets, consumer credit, Treasury issuance, and global dollar funding. That means the question is not only whether yields can spike. They can. The question is whether the modern system can survive those yields long enough for the trade to become a durable regime.
Pattern Nexus thesis: the 6–7% Treasury yield call may be right as a spike and wrong as the destination. The more likely path is spike, break, response. Inflation gives the cover for rates to rise. The rate shock weakens the consumer and tightens the dollar system. Recession risk rises. Then policymakers find a new cover for liquidity support, and the next asset-inflation cycle begins from a higher debt base.
Why This Is Premium
The public version of this debate is simple: inflation looks like the 1970s, so long rates may have to move higher. That is not wrong, but it is incomplete. The premium layer is not the CPI overlay. The premium layer is the system-capacity test.
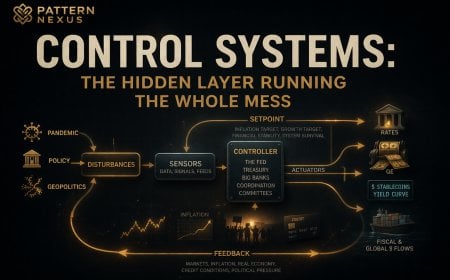
A Treasury yield is not just a line on a chart. It is a control rail. It prices mortgages, corporate credit, bank securities, private equity models, federal debt service, discount rates, global collateral, and dollar funding. When the 10-year yield moves, the whole machine reprices around it.
This article separates the rate spike from the rate regime. A spike can happen because the market panics. A regime has to be survived by the economy underneath it. That is the difference most of the 6–7% yield calls are missing.
Executive Thesis
The 6–7% Treasury yield trade is becoming dangerous because it is becoming expected. The more market participants position for a clean 1970s-style inflation repeat, the more vulnerable the trade becomes to the actual modern system constraint: the U.S. and global dollar economy may not be able to sustain that long-rate structure without breaking growth, consumers, credit, fiscal math, or liquidity plumbing.
The 1970s inflation overlay is useful as a warning, but it is not a complete model. Today’s economy has a higher debt load, larger federal interest burden, more financialized asset values, a more rate-sensitive housing market, and a global dollar system that turns U.S. rate stress into international liquidity stress.
The base case is not “rates go to 7% and stay there.” The base case is “rates spike, something breaks, policy finds a cover, liquidity returns, and the asset-inflation cycle restarts.”
Choose Your Reading Level
This article is built in three versions. Start with the version that fits how deep you want to go, then move down if you want the full system-level breakdown.
Version 1
Reader-Friendly Version
A lot of people are starting to say the 10-year Treasury yield could spike to 6% or 7%. That matters because the 10-year Treasury is one of the most important rates in the entire economy. It helps set mortgage rates, corporate borrowing rates, valuation models, and the general cost of money.
The reason people are making this call is because today’s inflation cycle can be compared to the 1970s. If you shift the charts and line them up, the pattern can look very similar: inflation spikes, inflation cools, then inflation threatens to come back again. That is why the trade is becoming popular.
But my concern is that the trade may be too obvious. The chart may be real, but the economy underneath the chart is different. The 1970s did not have today’s federal debt load, today’s consumer debt load, today’s frozen housing market, today’s global dollar system, or today’s economy built around low-rate asset values.
The Main Point
The main point is simple: the 10-year Treasury yield may spike, but that does not mean it can stay there.
A temporary move toward 6% or 7% is possible. If inflation comes back, energy prices jump, Treasury supply overwhelms buyers, or the market starts demanding more compensation for holding U.S. debt, long rates can move higher fast.
But a spike is not the same thing as a stable environment. A spike can happen because the market panics. A stable environment has to be absorbed by households, banks, businesses, the government, and the global financial system.
That is where I think the market may be wrong. The market is looking at the 1970s inflation chart. I am looking at the machine underneath the chart.
The 6–7% yield call may be right for the first move and wrong for the full cycle.
Why the 1970s Chart Can Mislead
The 1970s comparison is not useless. Inflation cycles can rhyme. Prices rise, cool, and then rise again when energy, wages, supply chains, or policy mistakes bring pressure back into the system.
That is why the overlay looks convincing. It gives people a clean story: inflation did this before, so rates may have to follow the same path again.
The problem is that the chart hides the balance sheet. It does not show federal interest costs. It does not show how much debt the government has to refinance. It does not show household debt. It does not show the mortgage payment shock. It does not show commercial real estate. It does not show bank balance sheets. It does not show the global dollar funding system.
So the chart can be directionally useful and still lead people into the wrong trade.
Why the Economy May Not Survive 6–7% Rates
A 6–7% 10-year Treasury yield would not just be a higher number on a screen. It would raise pressure across the entire economy.
Mortgage rates would likely stay elevated or move higher. Homebuyers would face worse affordability. Sellers would stay locked into old low-rate mortgages. Commercial real estate would face higher refinancing costs. Businesses would borrow at higher rates. Banks would carry more pressure on securities and credit quality.
The government would also feel it. The federal government has to constantly roll debt. When old debt matures, it gets refinanced at the current rate environment. That means higher rates do not hit all at once, but they do bleed into the system over time.
That is why high rates can become self-defeating. They are supposed to fight inflation, but they can also increase federal interest costs, weaken GDP, reduce tax receipts, and create the next excuse for stimulus.
The Consumer Is the Fuse
The consumer is the fuse because consumer spending drives most of the U.S. economy. If the consumer keeps spending, the economy can absorb more stress. If the consumer slows down, the whole structure starts feeling it.
The problem is that the consumer is already under pressure. Food, energy, rent, insurance, car payments, credit-card rates, and housing costs are all fighting for the same household cash flow.
If long rates rise toward 6% or 7%, that pressure gets worse. Housing weakens. Credit gets tighter. Discretionary spending slows. Businesses feel the demand slowdown. Then the economy starts moving from an inflation story into a recession story.
That is where the cycle flips. The same yield spike that confirms the bond bears can create the recession risk that eventually reverses the yield spike.
The Trade Nobody Is Talking About
The crowded trade is becoming “rates go higher because inflation is back.”
The less obvious trade is “rates spike, the spike breaks demand, recession risk rises, policy support comes back, and assets inflate again.”
That second version is what I think matters more. The system cannot afford a deep contraction because too much of the economy is tied to continued nominal growth. GDP supports tax receipts. Tax receipts support government spending. Government spending supports corporate revenue. Corporate revenue supports jobs, credit, and asset prices. Asset prices support collateral and confidence.
If that loop starts breaking, policymakers will not just sit there and let it clear naturally. They will look for a cover. Recession. Banking stress. Consumer relief. Energy shock. Housing stress. Treasury-market dysfunction. Some public justification will be used to reopen the liquidity channel.
The cover changes. The function does not. The system protects liquidity when contraction becomes more dangerous than inflation.
What to Watch Next
The key signals are the 10-year Treasury yield, the 30-year Treasury yield, mortgage rates, mortgage applications, consumer spending, credit-card delinquencies, auto-loan stress, credit spreads, Treasury auctions, bank stress, oil prices, inflation expectations, and policy language.
The language matters. When officials stop talking only about inflation and start talking about stability, market functioning, relief, or emergency support, the next liquidity cover is forming.
That is why the bigger trade may not be the yield spike. The bigger trade may be what comes after the yield spike.
Version 2
Non-Technical Advanced Version
The 6–7% Treasury yield argument is not crazy. It has real inputs behind it. Inflation has reaccelerated, energy has moved higher, federal deficits remain large, Treasury issuance remains heavy, and investors may demand more compensation to own long-duration U.S. debt.
But the missing variable is system capacity. The market is talking about where the 10-year yield can go. Pattern Nexus is asking how long the system can live there. Those are not the same question.
A rate spike is a market event. A rate regime is an economic environment. The modern economy may be able to produce the spike, but the spike itself may force the break.
The Crowded 6–7% Trade
The market loves a clean historical analogy. Right now, the clean analogy is the 1970s. Inflation surged after COVID, cooled, and now the fear is that another wave is building. If you overlay the 1970s inflation cycle against the 2020s and shift the timeline, the pattern can look almost too good.
That is what makes the trade attractive. It gives investors a simple framework: inflation is not dead, the Fed may not be able to cut, deficits are too large, Treasury supply is too heavy, and the long end may have to reprice toward 6% or 7%.
That framework has truth in it. But it is not complete. The biggest danger in macro is not being wrong about the first move. It is being right about the first move and wrong about the second.
The first move may be higher yields. The second move may be the break those higher yields create.
System Capacity Is the Missing Variable
The modern economy does not experience rates as theory. It experiences rates as monthly payments, refinancing costs, credit spreads, bank balance-sheet pressure, discount rates, and federal interest expense.
That is why the 1970s analogy has to be tested against the modern balance sheet. The 1970s did not have the same level of federal debt relative to GDP. It did not have the same housing market built around ultra-low mortgage rates. It did not have the same degree of financialized asset dependency. It did not have today’s global dollar funding system.
This is not a small difference. It changes the policy reaction function. A system with less debt can tolerate a more aggressive rate shock. A system with massive debt and financialized collateral cannot absorb the same rate shock without transmitting stress everywhere.
The 1970s comparison shows the inflation path. It does not prove the modern system can survive the 1970s rate outcome.
The cleanest way to think about it is this: the CPI chart tells us why yields can spike. The balance sheet tells us why that spike may not last.
The Fiscal Feedback Loop
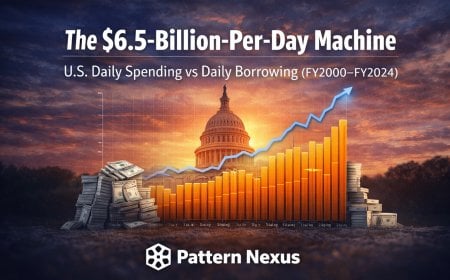
The federal government is already running large deficits before a deep recession. CBO projects a $1.9 trillion deficit in fiscal year 2026 and $3.1 trillion by 2036, with debt held by the public rising from 101% of GDP to 120% over that period.[3]
That matters because higher interest rates increase the cost of rolling debt over time. The federal government does not refinance all debt at once, but the rate structure slowly bleeds through as old debt matures and new debt replaces it.
So higher rates do two things at the same time. They tighten the private economy, and they increase the government’s own financing burden. That is the feedback loop.
If rates rise and the economy slows, tax receipts weaken. If tax receipts weaken while interest costs rise, the deficit worsens. If the deficit worsens, Treasury issuance pressure stays heavy. If Treasury issuance pressure stays heavy, investors may demand more compensation. Then the rate problem feeds back into the deficit problem.
At that point, rates are no longer just an inflation tool. They become a fiscal stress machine.
The Consumer Trigger
The consumer is the trigger layer because consumer spending is the core demand rail of the U.S. economy. When the consumer keeps spending, the economy can look strong even with pressure underneath. When the consumer slows, the entire structure starts repricing.
Household debt reached $18.8 trillion in Q1 2026, according to the New York Fed.[4] That does not mean every household is collapsing, but it does mean the household sector is carrying a large debt stack into a higher-rate environment.
Mortgage balances, credit-card balances, auto loans, student loans, rent, insurance, food, and energy all compete for the same monthly cash flow. When long rates rise, that household cash-flow stack gets worse.
This is why the 10-year yield matters to the consumer even if most people never watch Treasury markets. The 10-year helps transmit into mortgage rates and broader credit pricing. Freddie Mac reported the 30-year fixed mortgage rate at 6.51% as of May 21, 2026.[5] That level already keeps housing affordability under pressure. If long yields spike further, the housing payment shock becomes even more severe.
Once the consumer slows, the market stops talking only about inflation and starts talking about recession. That is where the trade changes.
The Dollar Liquidity Layer
The U.S. Treasury market is not just a domestic bond market. It is the anchor of the global dollar system. Treasuries function as collateral, reserve assets, pricing benchmarks, liquidity instruments, and balance-sheet plumbing across the world.
That means a violent move in U.S. long rates does not stay inside U.S. mortgages or U.S. stocks. It travels through global dollar funding, bank collateral, sovereign reserve portfolios, trade finance, emerging-market borrowing, and offshore dollar markets.
The BIS has framed U.S. dollar funding as a core global financial system structure, especially because non-U.S. entities borrow, lend, and intermediate in dollars.[7] The Federal Reserve also describes dollar swap lines as tools designed to improve liquidity conditions in dollar funding markets in the United States and abroad during stress.[8]
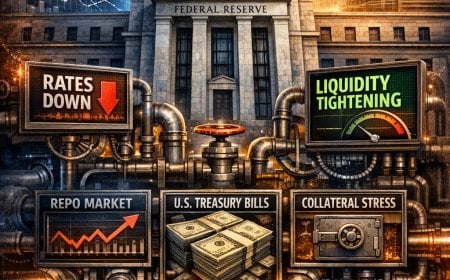
That is important because it shows the policy backstop layer. If higher U.S. yields create dollar funding stress, the conversation eventually shifts from inflation discipline to market functioning and liquidity protection.
The Spike-Break-Response Cycle
The underpriced trade is not simply inflation. Inflation is already being discussed. The underpriced trade is the policy cycle that follows a rate shock.
The sequence looks like this:
Inflation reaccelerates through energy, services, shelter, tariffs, supply chains, or expectations.
Bond yields rise because investors demand more compensation.
Mortgage rates and borrowing costs rise with them.
Consumers reduce spending because cash flow gets squeezed.
GDP momentum weakens.
Deficits worsen because revenue gets pressured and support needs rise.
Markets begin pricing recession instead of only inflation.
Policy language shifts from inflation control to stability protection.
Liquidity support returns under a new cover.
Assets inflate again because the system chooses nominal expansion over liquidation.
That is why this may not be a clean 1970s repeat. It may be the 2021–2022 loop repeated under worse conditions: inflation, response, slowdown, new support, asset inflation, and another cycle from a higher debt base.
What Confirms or Breaks the Thesis
The thesis is confirmed if yields rise while stress spreads into housing, credit, consumers, fiscal math, or dollar funding. The thesis is also confirmed if policy language begins shifting toward stability, emergency support, relief, market functioning, or liquidity tools.
The thesis is challenged if inflation accelerates while consumers keep spending, credit spreads stay calm, Treasury auctions clear cleanly, housing absorbs the payment shock, and policymakers keep conditions tight without causing a visible break.
Signal
What to Watch
If It Rises
PN Read
10-year / 30-year yields
Move toward 5%, 6%, or higher
The spike phase is active
Watch for the break, not just the spike
Mortgage rates
Applications, affordability, sales
Housing weakens
The payment stack is tightening
Consumer stress
Delinquencies, retail spending, credit cards
GDP risk rises
The consumer fuse is burning
Policy language
Stability, relief, market functioning
Liquidity cover forms
The response phase is approaching
Version 3
Technical Advanced Version
The technical question is not whether a 6–7% 10-year Treasury yield is mechanically possible. It is. The technical question is whether that rate level can become a durable equilibrium given the current fiscal, household, credit, housing, and dollar-liquidity structure.
The answer depends on whether inflation pressure dominates break risk, or whether break risk eventually dominates inflation pressure. Early in the cycle, CPI, energy, term premium, Treasury supply, and deficit anxiety can push yields higher. Later in the cycle, the same higher yields can weaken demand, raise recession probability, increase fiscal strain, widen credit spreads, and force policy response.
That means the rate model needs a sign-flip layer. The same variable that confirms the inflation trade in phase one can create the conditions that reverse the trade in phase two.
Model Question: Spike or Regime?
The correct framing is not “will the 10-year Treasury hit 6% or 7%?” That question is too narrow. A market panic, energy shock, inflation repricing, fiscal-risk repricing, or Treasury auction stress can push long yields higher. The better question is whether 6–7% can become a stable clearing range for the modern system.
A spike is a price event. A regime is a solvency and cash-flow environment.
For 6–7% to become a durable regime, the system would need to absorb higher mortgage rates, higher corporate refinancing costs, higher federal interest expense, higher dollar funding costs, weaker asset valuations, and tighter credit without creating a recessionary feedback loop. That is a much higher bar than simply drawing a 1970s inflation overlay.
This is why Pattern Nexus treats the 10-year yield as a pressure rail, not a standalone indicator. It prices the cost of money across the entire structure. Once that rail moves too far, it starts pulling on everything attached to it.
Current Data Snapshot
The current data supports both sides of the argument. It gives the bond bears enough inflation and supply pressure to argue for higher yields, but it also shows why sustained higher yields would become dangerous.
The consumer enters the rate shock with limited cash-flow flexibility.
The 1970s Overlay Problem
The 1970s inflation overlay is useful because inflation cycles have rhythm. An initial shock hits, the system tightens, inflation cools, policy or markets relax, and then a second wave forms. That pattern can be seen historically, and it is reasonable for market participants to worry about it.
The error is using CPI shape similarity as a standalone predictor of the 10-year Treasury yield path. CPI is one input. It is not the full system.
A proper yield framework has to include inflation, Fed policy expectations, term premium, Treasury supply, debt/GDP, recession probability, Fed balance-sheet impulse, foreign demand, dollar funding stress, and fiscal sustainability. The 1970s overlay is mostly an inflation-path comparison. It does not automatically carry over the full balance-sheet environment.
The 1970s chart is mostly β1. The modern system is dominated by the interaction between β3, β4, β5, β6, β7, and β8. That is why the chart can be right and the trade can still be wrong.
Fiscal Stress Mechanics
The federal government does not experience higher rates all at once. The transmission happens through rollover. Old debt matures, new debt replaces it, and the new rate environment gradually resets the average cost of funding.
That makes sustained high rates much more dangerous than a temporary spike. A short spike may cause market volatility. A sustained regime raises interest expense over time and makes the fiscal path harder to stabilize.
CBO already projects large deficits and rising debt. The baseline is not a low-debt, high-flexibility environment. It is already a high-deficit, high-debt environment before a deep recession.
Fiscal Variable
Baseline
Stress Channel
PN Interpretation
FY2026 deficit
$1.9T / 5.8% of GDP
Large issuance need before recession
The system is already expansion-dependent.
2036 deficit
$3.1T / 6.7% of GDP
Structural deficit persistence
Higher rates worsen an already large baseline.
Debt held by public
101% of GDP to 120% by 2036
Interest expense compounds against a larger base
The rate shock becomes a fiscal shock.
Net interest
Rising net interest drives much of projected deficit increase
Higher funding costs absorb fiscal room
Fiscal dominance pressure rises.
Simple stress logic: every 100 basis points of sustained additional funding cost on a large debt stock eventually becomes hundreds of billions of annualized pressure once enough debt rolls. The timing is staggered, but the direction is unavoidable.
This is why the 6–7% yield trade cannot be viewed as a normal bond-market forecast. At today’s debt levels, it is also a fiscal-stability question.
Consumer and Housing Transmission
The consumer is the main demand rail. Higher long rates transmit into the household through mortgage rates, credit costs, home equity access, auto loans, credit-card pressure, and general confidence.
Household debt reached $18.8 trillion in Q1 2026. Within that stack, mortgage balances totaled $13.19 trillion, credit-card balances were $1.25 trillion, auto loan balances were $1.69 trillion, and student loan balances were $1.66 trillion.[4]
That matters because the household sector does not absorb macro policy through theory. It absorbs policy through monthly cash flow. When rates rise, the monthly payment stack tightens.
Housing is the cleanest transmission channel. Freddie Mac reported the 30-year fixed mortgage rate at 6.51% as of May 21, 2026, up from 6.36% the previous week.[5] If the 10-year yield moves toward 6–7%, mortgage affordability would face another shock unless spreads compress dramatically.
Consumer transmission map: higher 10-year yield → higher mortgage and credit costs → weaker housing and discretionary spending → lower GDP momentum → higher recession probability → policy-response pressure.
This is the sign flip. At first, higher yields confirm inflation pressure. Later, higher yields create the conditions that make recession and policy response more likely.
Dollar Liquidity and Policy Backstop
The U.S. long-rate structure is global because the Treasury market is embedded inside the dollar system. Treasuries are not just domestic securities. They are collateral, reserve assets, benchmark instruments, and liquidity rails for the world.
That means a violent U.S. yield repricing travels through global funding markets. It affects banks, sovereigns, emerging markets, collateral values, trade finance, reserve portfolios, and offshore dollar markets.
The BIS dollar-funding framework matters here because it focuses on U.S. dollar borrowing, lending, and intermediation by non-U.S. entities.[7] In other words, dollar stress is not contained inside U.S. borders.
The Federal Reserve’s liquidity swap framework also matters because it shows the policy backstop. The Fed says swap lines are designed to improve liquidity conditions in dollar funding markets in the United States and abroad during market stress.[8]
That is why a sustained 6–7% long-rate environment would not just be a domestic rates story. It would become a dollar-liquidity test.
Regression / Pressure Model
A clean regression pass would require monthly or quarterly data across inflation, Fed funds, 10-year yields, 30-year yields, debt/GDP, deficits, net interest, Fed balance-sheet size, credit spreads, mortgage rates, unemployment, recession indicators, and dollar funding stress. The article thesis does not depend on claiming a single fitted model here. The point is to define the correct model architecture.
The model should be split into pressure variables and break variables. Pressure variables push yields higher. Break variables eventually pull yields lower by raising recession probability and policy-response expectations.
Variable
First-Phase Pressure on 10Y
Second-Phase Break Risk
Interpretation
Headline CPI
Positive
Negative later if inflation crushes real consumption
Inflation reprices nominal compensation first.
Energy CPI / oil shock
Positive
Negative later if demand breaks
Energy can trigger inflation fear and consumer weakness.
Debt/GDP
Positive through term premium
Positive for policy intervention risk
High debt turns rate increases into fiscal stress.
Net issuance
Positive
Positive for Treasury-market functioning risk
Supply must be absorbed by balance sheets.
Fed balance-sheet impulse
QT positive / QE negative
QE/liquidity tools cap stress
Liquidity withdrawal raises fragility.
Recession probability
Negative once dominant
Triggers duration bid and easing expectations
The break variable reverses the inflation trade.
Dollar funding stress
Positive first through risk premium
Negative after backstop expectations
Stress can force liquidity tools.
The central model insight is the sign flip. A variable can push yields up in the inflation phase and pull yields down in the recession/liquidity phase. That is why the market can be correct about the spike while being wrong about the duration of the regime.
Scenario Framework
The scenario map separates four possible paths: clean 1970s repeat, spike-break-response, financial repression/yield management, and hard landing.
Scenario
Rate Path
PN Probability Framing
What Confirms It
Clean 1970s repeat
10Y sustains 6–7%
Possible, but system-capacity constrained
Inflation expectations unanchor while consumers, credit, and GDP remain resilient.
Spike-break-response
10Y spikes, then falls as recession/liquidity response arrives
Yields fall sharply after risk assets and credit break
Tail risk if policy waits too long
Labor weakness, bank stress, Treasury-market dysfunction, credit seizure.
The base case is spike-break-response because it best fits the modern constraint set. The system can let markets tighten until tightening threatens the continuation of nominal expansion. Then the policy reaction function changes.
Stakeholder Map
The same yield shock hits each part of the system differently. That is why the article has to be read as a systems map, not just a bond-market forecast.
Stakeholder
Primary Exposure
What a 6–7% Spike Does
Pattern Nexus Read
Consumers
Mortgages, credit cards, auto loans, rent, energy
Reduces spending capacity and raises delinquency risk
The consumer is the fuse.
Federal government
Debt rollover, deficits, net interest
Raises funding burden over time
The rate shock becomes a fiscal shock.
Banks
Deposits, securities, credit quality
Pressures funding, collateral, and credit risk
Duration stress can become credit stress.
Real estate
Mortgage payments, cap rates, refinance risk
Weakens affordability and underwriting
Payment math breaks before theory does.
Equities
Discount rates, earnings, liquidity
Compresses multiples and raises earnings risk
Assets need liquidity more than the headline admits.
Global dollar borrowers
Dollar funding and collateral
Raises global funding stress
The U.S. rate shock becomes a global liquidity event.
Final Technical Read
The 6–7% Treasury yield trade is not wrong because yields cannot spike. It is incomplete because it assumes the spike can become a stable regime.
Inflation, energy pressure, term premium, Treasury supply, and fiscal-risk repricing can all push long yields higher. But the modern balance sheet creates a built-in feedback loop. The same higher yields that validate the inflation trade also pressure the consumer, housing, credit, fiscal math, and dollar liquidity.
Once those break channels activate, the market stops pricing only inflation and starts pricing recession, policy response, liquidity backstops, and eventual rate relief.
That is why the bigger trade may not be short bonds into 7%. The bigger trade may be recognizing when the rate spike becomes the policy cover for the next liquidity wave.
The 1970s were an inflation regime. The 2020s are a liquidity-control regime with inflation shocks inside it.
This article does not treat the 1970s inflation overlay as a complete forecast model. It treats it as one input inside a broader Pattern Nexus systems framework. The model separates inflation pressure from system capacity by layering Treasury yields, CPI, energy pressure, debt/GDP, federal deficits, household debt, mortgage rates, consumption dependence, dollar funding, and policy-response tools. The central analytical distinction is between a rate spike and a rate regime. A spike can be produced by market repricing; a regime has to be absorbed by the balance sheet underneath it.
Pattern Nexus Note: The world is not divided into topics. It is divided into layers. The 6–7% Treasury yield trade is not just a bond-market forecast. It is an inflation layer, a fiscal layer, a consumer layer, a housing layer, a credit layer, a dollar-liquidity layer, and a policy-reaction layer. If you only look at the chart, the 1970s comparison looks obvious. If you look at the machine underneath it, the obvious trade may be the trap.
Frequently Asked Questions
No. The argument is not that yields cannot spike. They can. The argument is that a sustained 6–7% 10-year Treasury yield would create major stress across mortgages, consumer spending, federal debt service, Treasury issuance, credit markets, and global dollar liquidity. Pattern Nexus sees 6–7% as more plausible as a spike than as a durable regime.
Why is the 1970s inflation comparison incomplete?
The main thesis is that the market may be underpricing a spike-break-response cycle. Inflation could push yields higher, but higher yields could then weaken the consumer, pressure GDP, widen fiscal stress, and create the political and financial justification for another liquidity response.
Personal consumption is still roughly two-thirds of U.S. GDP. If higher rates weaken housing, credit access, discretionary spending, and household confidence, the inflation-fighting rate shock can become a recession trigger. Once that happens, the policy discussion shifts from inflation control toward economic support.
It means large-scale policy support usually needs a public justification. The system cannot simply say it needs liquidity because the economy depends on continuous nominal expansion. Instead, the cover can be recession, banking stress, energy shock, war, consumer relief, Treasury-market dysfunction, or some other emergency frame.
The less obvious trade is not simply “short bonds because inflation is back.” It is that yields may spike first, then fall later as recession risk rises and policy support returns. The asset-market implication is that the next liquidity wave could create another round of asset inflation, potentially larger than the last one.
Founder of Pattern Nexus. I research markets, macro, geopolitics, AI, history, ancient systems, and the patterns most people overlook. I’m also building Market Radar, a trading scanner designed to read pressure, risk, confirmation, and setup quality before chasing a move.
Pattern Nexus is where I connect the dots between data, history, technology, and the bigger system playing out around us.


 Tykkää
0
Tykkää
0
 Epätäydellinen
0
Epätäydellinen
0
 Rakkaus
0
Rakkaus
0
 Hauska
0
Hauska
0
 Vau
0
Vau
0
 Surullinen
0
Surullinen
0
 Vihaisa
0
Vihaisa
0




Kommentit (0)