
The $X-Billion-Per-Day Machine: U.S. Daily Spending vs Daily Borrowing (FY2000–FY2024)
A Pattern Nexus structural read of U.S. federal average daily outlays versus average daily deficit financing since 2000 — and why persistent daily borrowing shows up in groceries, housing, metals, and equity valuations.
![[HERO_IMAGE_ALT]](https://patternnexus.com/uploads/images/202602/image_870x_698cb38ca1585.jpg)

“Deficits are political.” Sometimes, but in modern debt states they’re also mechanical: entitlement baselines, interest compounding, and cyclic revenue sensitivity create an auto-deficit tendency that only disappears during rare, specific conditions.
Risk: the market can tolerate high borrowing for a long time, until it suddenly can’t. The failure mode is usually rates volatility, forced fiscal tightening, or “financial repression” optics rather than a clean default headline.
Fast mental model: daily outlays are the engine burn, daily borrowing is the gap fuel line. The gap fuel line is one of the most powerful liquidity narratives on Earth.
What These Charts Actually Measure
People argue about “the deficit” like it’s a single number. It’s not. It’s a flow, and flows are easier to understand when you normalize them to time. That’s what we’re doing here: converting annual fiscal totals into average daily values.
Average Daily Outlays = total federal outlays in a fiscal year divided by the number of days in that fiscal year (365 or 366). Average Daily Borrowing (Deficit Financing) = the fiscal year deficit divided by days in the fiscal year. In OMB Table 1.1, “Surplus or Deficit (-)” is shown with deficits as negative numbers, so daily borrowing is computed as the negative of that value, normalized by days.
This is not “cash management by the Treasury day-to-day.” This is a structural view that answers a cleaner question: on average, what was the government’s daily spend rate, and on average, what was the daily funding gap that had to be financed?
Because people don’t experience “$X trillion per year.” They experience a constant pressure field: bids for labor, materials, services, housing, healthcare, and financing capacity. Daily normalization turns an abstract annual headline into something closer to how the system actually feels.
Chart 1: Average Daily Outlays (Line)
This line chart shows average daily federal outlays from FY2000 to FY2024. Conceptually, it’s the baseline burn rate of the state. It includes everything: discretionary, mandatory, and net interest as it shows up in total outlays.
![[CHART_OUTLAYS_LINE_ALT]](https://patternnexus.com/uploads/images/202602/image_870x_698cb1481d1f1.jpg)
What matters isn’t a single year. It’s the slope. Once the slope steepens, “normal” changes. A steeper slope means the state is absorbing more real resources per unit time, and it has to be funded either by taxes (receipts) or financing (borrowing).
- Trend: a long grind higher, interrupted by shocks that rebase spending upward.
- Key inflection: the 2020 shock creates a new plateau that doesn’t fully reverse.
- Structural implication: if spending is sticky and interest is reflexive, outlays become harder to compress without recessionary consequences.
Programs become baselines. Baselines become entitlements. Entitlements become politics. Even when the shock passes, the system rarely returns to the old trajectory. It settles onto a higher one.
Chart 2: Average Daily Borrowing (Bar)
This bar chart shows average daily deficit financing (“daily borrowing”) by fiscal year. Deficits are plotted as positive bars. Surpluses, if present, would plot as negative bars.
![[CHART_BORROWING_BAR_ALT]](https://patternnexus.com/uploads/images/202602/image_870x_698cb148e5a75.jpg)
This is the chart people feel in their bones, even if they don’t have the words for it. Because this is the gap. And the gap is where the monetary system and the asset-pricing system connect to the fiscal system.
- Surplus era: early 2000s shows what “gap closed” looks like.
- Post-2008: crisis borrowing spikes and then settles into a higher baseline.
- 2020 onward: the bar chart stops looking cyclical and starts looking structural.
This article uses deficits as a proxy for borrowing. Treasury’s Monthly Treasury Statement also reports “means of financing” on a modified cash basis, which can differ in any given month. For regime-level comparisons across decades, deficit-normalized-by-days is the cleanest first-order signal.
The Gap Is the Story: Outlays vs Receipts
Outlays are what the machine spends. Receipts are what the machine collects. The deficit is simply the delta between those two. So if you want the most honest summary of modern fiscal life, it’s this: the machine spends at a rate the system cannot reliably fund through receipts alone.
Receipts are cyclical. They rise in booms and fall in slowdowns. Outlays are sticky. They do not fall cleanly when growth slows. That asymmetry is why deficits reappear so easily and disappear so rarely.
When the deficit is occasional, markets treat it like weather. When the deficit is structural, markets treat it like climate. The price of everything starts embedding the expectation that the gap continues.
Why “Daily Borrowing” Shows Up in Your Life
People ask why groceries are insane, why housing feels untouchable, why car lots look like a parody, why equities keep catching bids, why gold and silver feel “overvalued” but won’t die. One answer is simple: persistent deficit financing is a persistent macro bid.
The government is a gigantic, always-on buyer. When it spends, it competes for real resources. When it borrows, it competes for financing capacity. That pushes into rates, spreads, credit availability, and eventually into how everything is priced.
![[OPTIONAL_IMAGE_1_ALT]](https://patternnexus.com/uploads/images/202602/image_870x_698cb28ebd6fb.jpg)
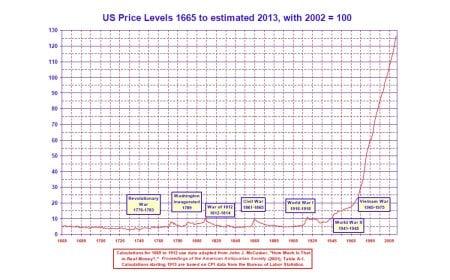
This doesn’t mean “deficits instantly cause inflation” in a one-step cartoon. It means the fiscal stance changes the constraint set. In a world where private credit cycles up and down, a consistently large public gap tends to stabilize demand on the way down and amplify valuation effects on the way up.
- Goods: demand support meets supply constraints, and prices become sticky.
- Housing: affordability depends on rates, incomes, and credit conditions, all influenced by the financing regime.
- Services: services inflation lags, then becomes persistent because labor is the input.
- Metals: gold and silver respond to confidence in purchasing power, real yields, and policy credibility signals.
- Equities: persistent liquidity expectations compress risk premia and keep multiples elevated longer than “fundamentals” people expect.
Because lived reality is local and immediate (rent, food, insurance, wages), while the financing regime is systemic and indirect. People feel outcomes first. Explanations arrive later. Usually in the form of narratives that miss the mechanism.
Where the Borrowing Actually Goes: The Financing Plumbing
“The government borrows” sounds simple until you ask the adult question: borrowed from who, through what pipes, using what collateral, at what price, with what knock-on effects? That’s where the real system lives.
Treasury finances the gap by issuing bills, notes, and bonds across the curve. Those securities have to be absorbed by someone: banks, money market funds, pension funds, foreign official institutions, households, hedge funds, and sometimes the central bank (directly or indirectly through balance sheet policy). The buyer mix changes the transmission.
Two key points most people miss:
- Collateral matters: Treasuries are not just “debt.” They’re system collateral. That changes behavior in repo, margining, and risk-free discounting.
- Price matters: absorption is not free. If issuance rises and buyers demand higher yields, that higher yield becomes a tax on future budgets through net interest.
More deficits can mean more issuance. More issuance can mean higher yields (if demand is price-sensitive). Higher yields can mean higher net interest. Higher net interest can mean higher outlays. That is the compounding wedge that turns “cyclical deficits” into “structural deficits.”
The Compounding Wedge: Net Interest and Reflexivity
Net interest is the one category that behaves like a machine inside the machine. It’s not a program you can easily “vote away” without bigger consequences. It’s a function of the debt stock and the rate structure.
In low-rate regimes, interest looks manageable. In higher-rate regimes, it becomes the silent amplifier. And because debt rolls, higher rates can leak into the budget even if “new spending” is flat.
Here’s the uncomfortable part: when interest starts behaving like a structural expense, the system becomes biased toward policies that keep real yields contained. That doesn’t guarantee inflation. It does bias the regime toward financial repression style outcomes: managing rates, managing expectations, managing optics.
If you understand the interest wedge, you understand why “tight policy forever” narratives often fail. The system eventually fights back through politics, growth, or financial stability channels.
Regimes Since 2000: The Story in Four Blocks
If you step back, the fiscal story since 2000 isn’t a random walk. It’s a sequence of regime shifts where crisis responses become baselines.
1) FY2000–FY2001: A brief surplus window
This is the last time the system looked like it could close the gap without heroic assumptions. It matters because it provides contrast: the machine can run with a small gap, but it rarely chooses to.
2) FY2002–FY2007: Deficits normalize again
Borrowing becomes the standard tool. Spending rises. Receipts become more cycle-sensitive. The market learns the state will not tolerate prolonged constraint.
3) FY2008–FY2013: Crisis spike and the new baseline
The gap blows out, then improves, but improvement means down from emergency, not back to old normal. This is a pattern in modern governance: crisis spending is easy, reversal is politically and socially expensive.
4) FY2020–FY2024: Structural gap era
The 2020 shock is a hard rebase. Outlays surge. Borrowing surges. Then both settle at levels that would have looked absurd in the early 2000s. After a rebase, absurd becomes the new reference frame.
![[OPTIONAL_IMAGE_2_ALT]](https://patternnexus.com/uploads/images/202602/image_870x_698cb2ed08ce1.jpg)
The U.S. fiscal machine has moved from occasionally constrained to structurally financed. When financing becomes structural, asset valuation regimes change, political narratives get louder, and the public feels the gap through prices long before they can explain it.
Assets, Not Feelings: How This Reprices Housing, Metals, Equities
When people say “everything is overvalued,” they’re usually comparing today to a mental snapshot of a different regime. But markets don’t price nostalgia. Markets price the discount rate, the policy path, and the expected liquidity environment.
Housing
Housing is a rate product disguised as shelter. When the financing regime pressures rates up, affordability collapses. When policy and liquidity pressures cap real yields, housing can remain elevated even while people are angry about it. The result is the same lived experience: “this makes no sense.”
Gold and silver
Metals are not a GDP bet. They’re a credibility bet. Persistent structural deficits nudge the system toward policies that protect funding and stability first. That tends to support a long-run bid for stores of value when real yields are contested.
Equities
Equities are a discount-rate instrument with a narrative wrapper. If the market believes the system cannot tolerate prolonged tightness, risk premia compress. “Overvaluation” then becomes a slow-motion condition, not an immediate catalyst.
You can be correct about fundamentals and still be wrong on timing for years if you ignore the financing regime. The regime is the water. Fundamentals are the fish.
What Would Actually Change the Regime
If this is structural, what breaks it? Not vibes. Constraints. Regimes change when constraints force the system to choose between bad options.
- Rates constraint: if yields rise faster than the budget can absorb, net interest becomes the amplifier and forces a response.
- Inflation constraint: persistent inflation can force tighter policy even if the fiscal system hates it.
- Growth constraint: recession hits receipts while outlays stay sticky, making the deficit expand mechanically.
- Political constraint: the only real “fiscal tightening” comes when politics accepts pain. That’s rare.
- Financial stability constraint: something breaks in credit plumbing, and the system chooses stability over purity.
The system can run structural deficits for a long time if confidence stays intact and funding remains available. The danger is not “tomorrow.” The danger is nonlinearity: long stability followed by fast repricing when a constraint bites.
Pattern Nexus Lens
Think of the system as a stack: real economy constraints at the bottom, credit and rates in the middle, and narrative and valuation at the top. Daily spending is the baseline load on the stack. Daily borrowing is the variable that tells you how much the stack is being propped up by financing rather than productivity.
When the gap is persistent, policy credibility shifts from “we can tighten” to “we will manage optics.” That’s where you get long periods of elevated multiples, episodic inflation bursts, and a growing preference for scarce stores of value. It also explains why people can be right about overvaluation and still get steamrolled for years: they’re measuring fundamentals while the system is pricing the financing regime.
Persistent daily borrowing is not just a budget fact. It is a liquidity condition that bleeds into everything: consumer price levels, real estate affordability, precious metals bid, and equity risk premia.
FAQ
Is “daily borrowing” the same thing as printing money?
No. Borrowing is fiscal financing via debt issuance. The monetary consequences depend on who buys the debt, under what conditions, and how that interacts with bank reserves, collateral, and rate policy. Persistent borrowing does increase the probability of monetary accommodation or financial repression dynamics, especially when the alternative is politically impossible tightening.
Why use fiscal years instead of calendar years?
The U.S. federal budget is tracked on a fiscal-year basis (Oct 1 to Sep 30). OMB historical tables are organized that way for comparability. Using fiscal years avoids mixing partial cycles across reporting conventions.
Couldn’t we do this with monthly data instead?
Yes. Treasury’s Monthly Treasury Statement provides monthly receipts, outlays, deficits, and “means of financing.” Monthly granularity is great for timing and narrative-to-data alignment. The fiscal-year daily averages are better for regime identification and long-run comparison.
Does high borrowing automatically mean inflation?
Not automatically. Inflation outcomes depend on supply constraints, productivity, global trade conditions, labor dynamics, and monetary transmission. But high structural borrowing tends to keep the system biased toward demand support and contested real-rate regimes, which is why it shows up in long-run price levels and asset valuation behavior.
Why can markets rally while the public is getting crushed?
Because markets discount the financing regime and policy reaction, while the public experiences the price level and the cost of credit. In a structural deficit regime, markets often price the probability of eventual support, while households pay the spread between wages and the new cost structure.
Sources
These sources support the fiscal totals used to compute daily outlays and daily deficit financing, plus optional monthly datasets if you want a higher-frequency version of the same story.
- OMB Historical Tables (FY2026 Budget) via GovInfo
- OMB Historical Tables landing page (Table 1.1: Receipts, Outlays, Surplus/Deficit)
- U.S. Treasury Fiscal Data: Monthly Treasury Statement dataset
- Treasury Fiscal Service: Monthly Treasury Statement overview
Mikä on reaktiosi?
 Tykkää
0
Tykkää
0
 Epätäydellinen
0
Epätäydellinen
0
 Rakkaus
0
Rakkaus
0
 Hauska
0
Hauska
0
 Vau
0
Vau
0
 Surullinen
0
Surullinen
0
 Vihaisa
0
Vihaisa
0

Founder of Pattern Nexus. I research markets, macro, geopolitics, AI, history, ancient systems, and the patterns most people overlook. I’m also building Market Radar, a trading scanner designed to read pressure, risk, confirmation, and setup quality before chasing a move. Pattern Nexus is where I connect the dots between data, history, technology, and the bigger system playing out around us.















Kommentit (0)