
The Overburdened Debt Economy: How a $1 Trillion Surge Tightens the Noose on Households, Businesses, and Growth
The U.S. added $1T in new debt in just 82 days. Here’s how rising federal, household, business, and state debts are overloading the economy and pushing rates higher.
The Setup: $1 Trillion in 82 Days
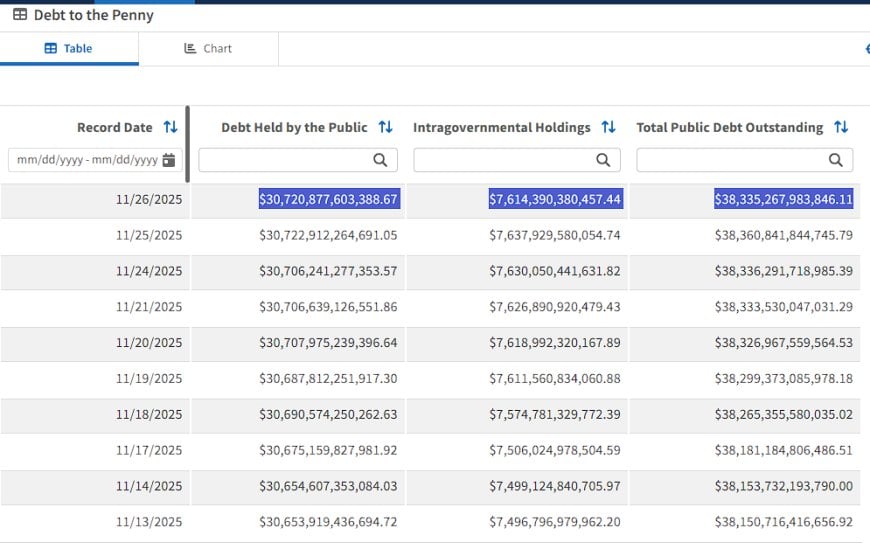
The headline is simple enough: the U.S. Treasury reported roughly $1 trillion in new federal debt in under three months. That works out to about $12 billion a day added to the tab.
On the surface, it looks like just another chapter in the “debt ceiling” saga. Underneath, it is something else entirely:
It is a forced acceleration of the debt load sitting on top of an economy already saturated with leverage.
The Government Accountability Office (GAO) has been blunt about the mechanics: as federal debt climbs, the government must pay more in interest. That pushes rates higher across the curve and leaks directly into mortgages, auto loans, credit cards, and business borrowing costs.
This is not an abstract macro story. It is a cash-flow story, and cash flow is oxygen.
This article doesn’t walk through every liquidity pipe or balance-sheet mechanism. Instead, it stays focused on the real-world impact:
- How large the total U.S. debt stack has become across every sector,
- How rising rates hit all those sectors simultaneously, and
- Where the pressure shows up first — and hardest — in the real economy.
Once you view the economy as one giant, interconnected debt organism, the $1 trillion surge stops being a headline and starts looking like what it really is: one more turn of the vice on an already overburdened structure.
Treasury Data Snapshot: Debt Surges to $38.3 Trillion
Mapping the U.S. Debt Stack
Before talking about pressure, we need to outline the weight. At a high level, the U.S. debt stack breaks into several major buckets:
Federal Debt — Treasury securities issued by the U.S. government.
Household / Consumer Debt — mortgages, auto loans, student loans, credit cards, personal loans.
Corporate / Business Debt — investment-grade bonds, high-yield bonds, bank loans, private credit.
State & Local Debt — municipal bonds and related obligations.
The exact numbers move month to month, but the story is consistent:
- Federal debt has surged into the mid-$38 trillion range, with $1 trillion added in just 82 days.
- Household debt is near record highs, driven mostly by mortgages but with mounting pressure from credit cards and auto loans.
- Corporate debt expanded for over a decade under low rates and now faces a dramatically more expensive refinancing environment.
- State and local governments carry their own bond loads and pension obligations, all now priced off a higher-rate regime.
Put together, this isn't a normal business cycle setup. It’s something closer to:
One giant, highly levered balance sheet with rising interest costs at almost every layer.
The $1 trillion federal surge matters not only because of the size, but because it accelerates the point where debt service begins crowding out everything else.
Interest Expense: The Silent Austerity
When people talk about debt, they usually think about the total outstanding amount. But in the real economy, interest expense is the part that actually hurts.
For the federal government, rising debt plus elevated rates means:
- Interest becomes one of the fastest-growing budget categories.
- Every dollar spent on interest is a dollar not spent on infrastructure, services, or tax relief.
- The system slides into silent austerity: spending rises, but public capacity does not.
The same pattern repeats across households, corporations, and municipalities:
- Households see more of their paycheck go toward interest rather than principal or consumption.
- Businesses divert cash from wages, hiring, or investment just to roll existing debt.
- State and local governments face higher borrowing costs for essential infrastructure.
Across the board, interest expense is slowly cannibalizing future growth.
Households: Debt-Loaded and Rate-Sensitive
Households are where the macro story turns into real life. GAO warnings are clear: rising federal debt eventually means higher interest rates on mortgages, car loans, and credit cards.
The transmission mechanism is simple:
- The Treasury issues more debt.
- Investors demand higher yields to absorb the supply.
- Those higher yields set the floor for consumer borrowing rates.
For households, this translates into:
- Higher monthly payments when refinancing or taking new loans.
- Less disposable income for savings or consumption.
- Greater fragility in the face of shocks like job loss or medical costs.
The danger isn’t one variable — it’s the combination:
- Record-high consumer debt levels,
- Rising borrowing costs,
- Slower wage growth for many workers,
- Higher baseline living costs (housing, insurance, food, energy).
A system can handle stress in one or two areas. It becomes unstable when every pressure point tightens at the same time.
Businesses: Refinancing Walls and Credit Rationing
Corporate America faces a quieter but equally severe problem. Companies issued massive amounts of cheap debt during the near-zero rate era, under the assumption they could always roll it cheaply.
That assumption no longer holds.
As federal borrowing ramps and global investors demand higher yields, corporate credit reprices upward:
- Refinancing walls — large blocks of debt maturing into a higher-rate world.
- Credit tightening — banks restrict lending, especially to smaller and riskier firms.
- Spread widening — weaker companies pay more relative to Treasury benchmarks.
And the downstream effects mirror household pressures:
- More cash flow redirected to interest,
- Less available for hiring, capex, or innovation,
- Rising default risk across high-yield and private credit segments.
The overburdened debt load isn’t just a federal problem — it’s a margin problem across the entire corporate sector.
States and Cities: Squeezed from Both Ends
State and local governments occupy a uniquely constrained position:
- They do not control monetary policy.
- They rely heavily on debt markets for long-term infrastructure.
- They have political limits on cutting essential services.
Rising rates — accelerated by federal debt issuance — translate into:
- More expensive municipal bonds for roads, schools, water, and transit.
- Pension funding strain as return assumptions face market reality.
- Budget pressure that leads to deferred maintenance and underinvestment.
This produces a slow-motion austerity — not an immediate collapse, but a gradual erosion of public capacity.
Macro Drag: How Debt Caps Growth
Aggregate all of these layers and you get the picture of an economy weighed down by its own liabilities:
- The federal government is paying more just to stand still.
- Households are paying more for the same shelter and transportation.
- Businesses are paying more simply to refinance existing obligations.
- States and cities are paying more just to maintain infrastructure.
None of this is productive spending. It maintains the present but does not build the future. In that sense, rising interest costs function as a tax on future growth.
Over time, that looks like:
- Lower long-term GDP growth potential,
- More fragile recoveries after downturns,
- Greater reliance on asset inflation to mask structural weakness.
The $1 trillion surge didn’t create this dynamic — it accelerated it, pushing the system deeper into a regime where more and more energy goes to servicing yesterday’s debt instead of building tomorrow’s capacity.
Where This Fits in the Cycle (Briefly)
Beneath all of this sits the broader liquidity cycle:
- Heavy issuance drains liquidity in some areas and pushes up yields.
- Higher rates tighten financial conditions for households and businesses.
- Balance-sheet stress accumulates first at the weakest points.
- Eventually, pressure forces a policy shift — one way or another.
The critical point is that: The system is entering its next phase with historically high, broadly distributed, and increasingly expensive debt loads.
Whatever form the next intervention or easing cycle takes, it will operate on an economy already structurally burdened. That limits its effectiveness and slows any recovery that follows.
The Pattern Nexus View
At Pattern Nexus, we look at the economy as a living system built on liquidity, collateral, and feedback loops — not headlines or political narratives. This article isn’t just about debt for debt’s sake. It fits into a much larger pattern we’ve been documenting across dozens of reports:
- The U.S. is transitioning toward a structurally higher debt regime.
- Interest costs are rising faster than economic output.
- The private sector is already debt-saturated.
- Policy makers are losing degrees of freedom.
- The system is slowly sliding toward a debt-interest feedback loop.
When viewed through this lens, the $1 trillion surge isn’t an isolated event — it’s the logical next step in a maturing macro structure that has been years in the making.
The Pattern Nexus Framework
Nearly every major article on Pattern Nexus points to the same structural mechanics:
Liquidity cycles drive prices.
Collateral supply determines liquidity.
Debt issuance reshapes collateral supply.
Interest costs reshape fiscal capacity.
Fiscal strain accelerates policy pivots.
The overburdened debt load fits squarely inside this framework. Rising debt doesn’t just change the numbers — it changes the architecture of the system.
- More Treasury supply means higher yields.
- Higher yields mean tighter financial conditions.
- Tighter conditions expose weak balance sheets first.
- Stress at the periphery eventually forces central intervention.
This is why we have repeatedly highlighted the coming 2026–2027 liquidity inflection: the system is moving toward a point where debt servicing, collateral scarcity, and recession risk converge.
How This Fits Into the Broader Pattern Nexus Thesis
This report directly ties into several core Pattern Nexus themes:
Reserve Scarcity & Liquidity Compression
As the federal debt expands and interest costs rise, the system naturally consumes more liquidity. This compresses reserves, tightens credit, and brings the economy closer to a policy-forced liquidity restart.
The Great Debt Plateau
Many of ourr other articles show that the U.S. economy is stuck on a “high-debt plateau,” where growth is no longer driven by productivity but by ever-increasing borrowing. This latest $1 trillion surge is one more step up that plateau — without a corresponding increase in real economic capacity.
Interest Burden as the New Macro Driver
Traditional macro models overemphasize inflation, wages, and consumer sentiment. The Pattern Nexus thesis emphasizes interest expense as the true governor of the system. This article strengthens that model: higher debt = higher interest = lower fiscal capacity = slower growth.
The Coming Policy Shift (QE-Style Intervention)
As the system becomes more overburdened, the next policy action becomes less optional and more inevitable. Whether it is called QE or something rebranded, the mechanics will be the same: a liquidity injection to stabilize a debt-heavy system.
This ties directly into ourr earlier articles on reserve scarcity, Fed balance sheet cycles, Treasury issuance waves, liquidity inflection points, and the 2026 reset window.
The Pattern Nexus Conclusion
The U.S. economy is not simply struggling under the weight of inflation or weak consumer confidence. It is struggling under the weight of a system-wide debt load that has become too large, too expensive, and too synchronized.
The $1 trillion surge in under 90 days is not the crisis — it is the signal.
It tells us the economy is moving deeper into the structural pattern we’ve been mapping for months:
- Debt up
- Rates up
- Interest expense up
- Growth down
- Liquidity stress rising
- Policy pivot approaching
This is the Pattern Nexus framework in action: a system cycling toward its next liquidity break — and its next liquidity intervention.
Sources
- U.S. Department of the Treasury — Debt to the Penny.
https://fiscaldata.treasury.gov/datasets/debt-to-the-penny/debt-to-the-penny - U.S. Department of the Treasury — Monthly Statement of the Public Debt.
https://fiscaldata.treasury.gov/datasets/monthly-statement-public-debt/summary-of-treasury-securities-outstanding - U.S. Government Accountability Office (GAO) — America’s Fiscal Future.
https://www.gao.gov/americas-fiscal-future - Federal Reserve Bank of New York — Quarterly Report on Household Debt and Credit.
https://www.newyorkfed.org/microeconomics/hhdc - Federal Reserve — Financial Accounts of the United States (Z.1).
https://www.federalreserve.gov/releases/z1/
आपकी प्रतिक्रिया क्या है?
 पसंद करें
0
पसंद करें
0
 नापसंद
0
नापसंद
0
 प्यार
0
प्यार
0
 मज़ेदार
0
मज़ेदार
0
 वाह
0
वाह
0
 दुखद
0
दुखद
0
 गुस्सा
0
गुस्सा
0

Founder of Pattern Nexus. I research markets, macro, geopolitics, AI, history, ancient systems, and the patterns most people overlook. I’m also building Market Radar, a trading scanner designed to read pressure, risk, confirmation, and setup quality before chasing a move. Pattern Nexus is where I connect the dots between data, history, technology, and the bigger system playing out around us.
















टिप्पणियाँ (0)