
Fiscal Dominance and the Sticky Term Premium: Why Long Rates Won’t Obey the Fed
Everyone is waiting for rate cuts to bring relief to mortgages, cap rates, and risk assets. But the long end of the curve doesn’t care what the policy rate does when fiscal dominance takes hold. This long-form explainer maps the mechanics behind sticky long rates: net Treasury supply, buyer base rotation, term premium re-pricing, and degraded market depth. If you want to understand why “cuts” may not mean “cheaper money” anymore, start here.
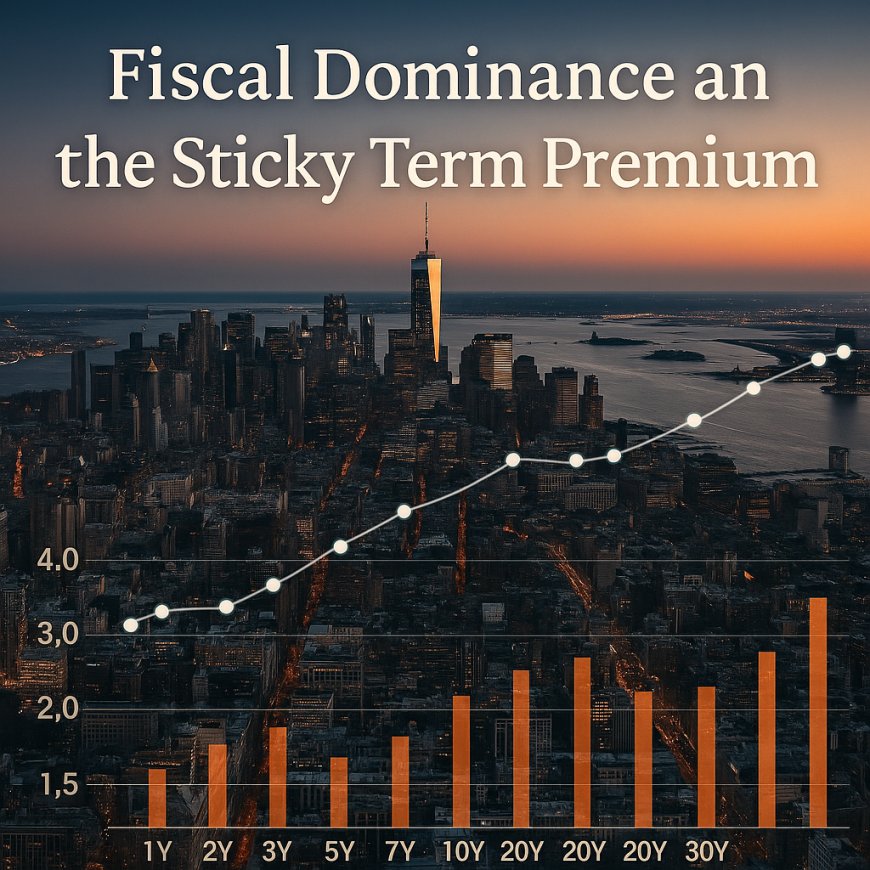
Fiscal Dominance and the Sticky Term Premium
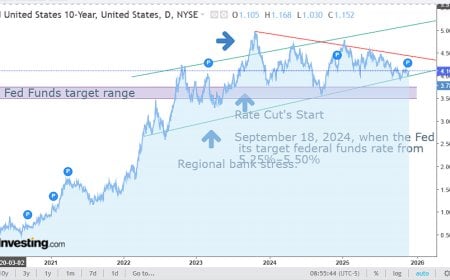
Conventional macro says: the Fed cuts, financing gets cheaper, growth rebounds. But the last few years have quietly rewritten the script. As deficits swell and net Treasury issuance becomes the market’s gravitational field, the long end of the curve has started to ignore the front end. That disconnect has a name — fiscal dominance — and understanding it is the difference between trading narratives and trading the system. When the government’s financing need is big enough, the cost of money starts getting set more by bond supply and buyer base dynamics than by the policy rate alone. The result is a stubbornly positive term premium that refuses to fall just because the Fed turns dovish.
Think of the term premium as the market’s “risk surcharge” for holding long-duration paper: compensation for duration, inflation uncertainty, supply risk, and microstructure trouble. After a decade of QE compressed that premium to near zero or negative, the regime is normalizing as QT, structural deficits, and a shrinking captive buyer base push it back up. The implication for mortgages, corporate debt, cap rates, and risk premia is simple: you can get a policy pivot without getting relief at the long end. In this cycle, “lower Fed funds” doesn’t automatically translate into “lower 10s and 30s.”
We can map the mechanism in four layers: the fiscal math (issuance), the buyer base (who absorbs it), the microstructure (how markets clear), and the psychology (why a scarred market demands compensation). Each layer reinforces the others, and together they explain why the curve has been sticky even as growth cools and inflation moderates.
Start with the math. The Congressional Budget Office projects sustained primary deficits and rising net interest costs that feed on themselves — higher coupons lift the deficit, which lifts issuance, which lifts coupons again. That’s not an apocalypse story; it’s a flow story. A structurally large net supply of duration must be intermediated by someone, at a price. During the QE decade, the “someone” was the central bank’s balance sheet and regulatory-induced bank demand. Today, the buyers are less captive and more price-sensitive: households through funds, foreign official and private accounts, pensions, insurers, and leveraged players who come and go with basis conditions.
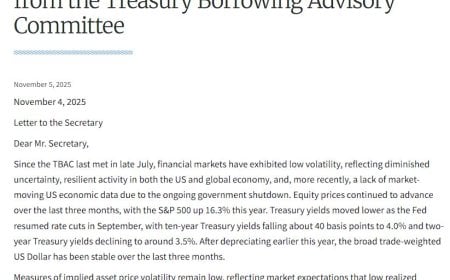
The Treasury Borrowing Advisory Committee (TBAC) minutes and quarterly refunding docs tell this story without drama: with coupons now a larger share of financing versus bills, and with terming-out supply to manage rollover risk, duration is being delivered to a market with shallower risk warehousing capacity than pre-2008. Dealer balance sheets are smaller relative to the size of the Treasury market; post-crisis capital rules and internal limits mean they intermediate flow but can’t warehouse systemic amounts of duration at tight spreads. The U.S. OFR’s market depth trackers show how thin top-of-book liquidity can get around auctions or stress windows — a small flow can move price farther than models assume. Thin depth + big size = higher premium.
Layer two is the buyer base rotation. For years, the Fed and price-insensitive actors absorbed interest-rate risk. As QT reduced that footprint and bank portfolios got stuffed with low-coupon paper, marginal absorption shifted to real-money and fast-money accounts that demand more compensation for volatility. Foreign official demand is more tactical and FX-hedge sensitive. Pension and insurer demand is ALM-driven but lumpy and spread-sensitive. Levered funds step in when basis trades are fat and repo is friendly — and step out when haircuts rise or financing wobbles. That cyclicality shows up in the BIS work on the Treasury basis: when leverage channels retreat, the market loses a shock absorber and term premium gaps wider until new balance sheets show up.
Layer three is the microstructure reality: market depth and price discovery. The New York Fed’s liquidity indicators and OFR data have highlighted episodes where depth in on-the-run Treasuries thinned materially. Combine that with heavier coupon calendars and you have an environment where auctions need a clearing premium. Issuers call it tail risk; traders call it slippage; economists call it term premium. It’s the same thing: the market charging for balance sheet and uncertainty. Importantly, those premia don’t compress sustainably without a credible, durable buyer of last resort or a structural narrowing of issuance. Rate cuts alone don’t refill depth — balance sheets do.
Finally, the psychology layer: once the market “learns” that the long end is hostage to supply and clearing risk, it reprices the distribution of outcomes. Inflation may trend lower, but the volatility around it — deglobalization frictions, energy transition capex, commodity cycles, geopolitics — encourages investors to ask for cushion. The ACM term premium estimates capture this regime shift: after living negative for years, premia turned positive as QT + supply + uncertainty rebuilt compensation. That doesn’t mean “higher forever”; it means “sticky until the plumbing changes.”
Where does the Fed fit in? Monetary policy can influence the front end and signal reaction functions, but unless policy also addresses the duration supply problem — either by shrinking net issuance (a fiscal choice) or by reintroducing a non-economic buyer (a balance sheet choice) — the long end will remain more obedient to auction math than to dot plots. That’s fiscal dominance in practice: when the fiscal vector sets the constraints and monetary policy has to operate inside them. The BIS has cautioned that in such regimes, stabilizing inflation and stabilizing debt service can point to different optimal rate paths — a tension that keeps volatility elevated and premia positive.
Why this matters beyond bond desks: the long end is the price of long money. Mortgages, CRE cap rates, project finance, DCFs — they all key off term yields. If you anchor business plans to “cuts = cheap long-term capital,” you risk confusing the directional story with the structural one. In this regime, capex that clears at 5–6% long rates is robust; capex that needs 3–4% to pencil is fragile. The same is true for households and wealth. If you’re waiting for 30-year mortgages to return to the post-2012 fantasy, you’re betting against the issuance calendar and the buyer base, not just inflation.
So what compresses the term premium from here? Three pathways exist. First, a credible fiscal consolidation that lowers net coupon supply relative to GDP. Markets don’t need austerity; they need believable trajectories. Second, explicit balance-sheet support that targets market depth — standing facilities, buybacks/switches, or, in extremis, QE that focuses on long-tenor liquidity rather than macro accommodation. The BIS and central-bank forums have floated structural tweaks (all-to-all, central clearing expansion, redesigned market-making incentives) to deepen Treasury intermediation; these are micro but matter. Third, a durable collapse in macro uncertainty — benign growth, tamed inflation volatility, and calmer geopolitics — that allows investors to accept less cushion. Of the three, only the third can happen without policy choices — and it’s the least reliable.
There’s a parallel here to the 2013–2016 period, when the Fed was tapering and then liftoff loomed, but the long end refused to sell off in a straight line because the buyer base (global pensions/insurers, reserve managers) was structurally starved for duration. Today is the mirror image: the buyer base is more tactical, balance sheets are thinner, and the issuer is larger. Same curve, different regime. That’s why history rhymes but doesn’t repeat: the plumbing moved.
For portfolio construction, the takeaway is pragmatic. Separate your view on policy rates from your view on term rates. If your thesis is “growth is slowing, cuts are coming,” good — but map how much of your P&L or operating plan depends on the 10s/30s moving with the front end. Stress-test a world where the Fed cuts 100–150 bps, inflation trends lower… and 10s only drop 40–60 bps because auctions keep tailing and liquidity premia remain. That’s not a tail risk; that’s the base case in fiscal dominance. Likewise, if you own assets priced off the long end (housing, CRE, long-duration equities), build scenarios where the cost of capital doesn’t “normalize” to last cycle’s floor. Endurance in this regime comes from design, not hope.
For builders and operators, think in resilience spreads instead of rate fantasies. Projects with cash flows that clear at today’s long end create anti-fragility if and when the premium finally compresses; projects that only work at yesterday’s rates embed fragility that compounds. If the premium fades (because issuance slows, liquidity deepens, or policy steps in), you harvest upside. If it persists, you survive. That’s how you build in a world where the cost of long money is no longer set by wishful thinking, but by calendars and balance sheets.
None of this is fatalistic. It’s just honest about constraints. Markets ultimately clear, and regimes ultimately change. But until the buyer base, the issuance profile, and the market’s plumbing are materially different, expect the curve to keep speaking the language of supply. Rate cuts can soften the accent. They don’t change the grammar.
Sources & References
- NY Fed – ACM Term Premium & Inflation Risk Premia
- U.S. Treasury – Quarterly Refunding & TBAC materials
- U.S. OFR – Treasury Market Structure & Liquidity Indicators
- NY Fed – Market Liquidity Indicators
- BIS Quarterly – Leverage & Treasury Basis Dynamics (2023)
- IMF – Fiscal Monitor (deficits, debt service trajectories)
- CBO – Budget & Long-Term Debt Projections
#Macro #Markets #Rates #Treasuries #Liquidity #FiscalDominance #PatternNexus
你的反应是什么?
 喜欢
0
喜欢
0
 不喜欢
0
不喜欢
0
 爱
0
爱
0
 有趣
0
有趣
0
 哇
0
哇
0
 悲伤
0
悲伤
0
 愤怒
0
愤怒
0

Founder of Pattern Nexus. I research markets, macro, geopolitics, AI, history, ancient systems, and the patterns most people overlook. I’m also building Market Radar, a trading scanner designed to read pressure, risk, confirmation, and setup quality before chasing a move. Pattern Nexus is where I connect the dots between data, history, technology, and the bigger system playing out around us.














评论s (0)