
Gold at the Edge: Are We Witnessing the Break of a 40-Year Trend?
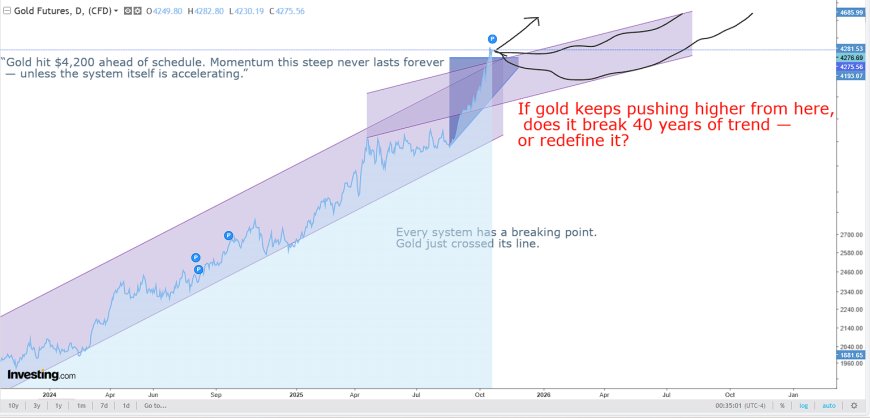
Gold has officially reached the upper boundary of its long-term logarithmic channel — a level that has capped every major cycle since the 1970s. If it keeps climbing from here, we may not be seeing a rally at all, but the beginning of a structural revaluation. Gold’s surge past $4,200 challenges half a century of price geometry. Explore whether this move signals another temporary peak or the start of a full monetary regime shift.
Something extraordinary is happening on the gold chart.
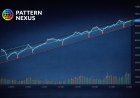
After decades of respecting the same geometric rhythm, the metal has surged to the very top of its long-term logarithmic channel — brushing the same slope that marked every major top since the 1970s.
On a linear chart, it looks like a typical breakout. But on a logarithmic scale — where percentage change, not absolute price, tells the real story — gold is pressing into a boundary that has defined its entire post-Bretton Woods existence.
If this push continues, it would be breaking trend geometry that has held for more than 40 years. And if it doesn’t stop here, the next move won’t be a correction — it’ll be a re-rating.
The Historical Pattern
Each gold super-cycle since 1971 has followed the same three-phase rhythm:
-
Expansion: a parabolic decade of acceleration.
-
Consolidation: a long sideways or downward digestion period.
-
Re-expansion: a faster, steeper breakout that re-prices the entire system.
Those waves line up with every major episode of global monetary stress:
-
1970s: The original shock — leaving the gold standard and repricing real value.
-
2000s: The credit bubble and global financial crisis.
-
2020s: The digital debt era — sovereign saturation and algorithmic liquidity.
Each expansion has been roughly 3–4× larger than the one before, and each resting period roughly 40% shorter — a Fibonacci-style compression that implies the system is accelerating.
The Current Setup
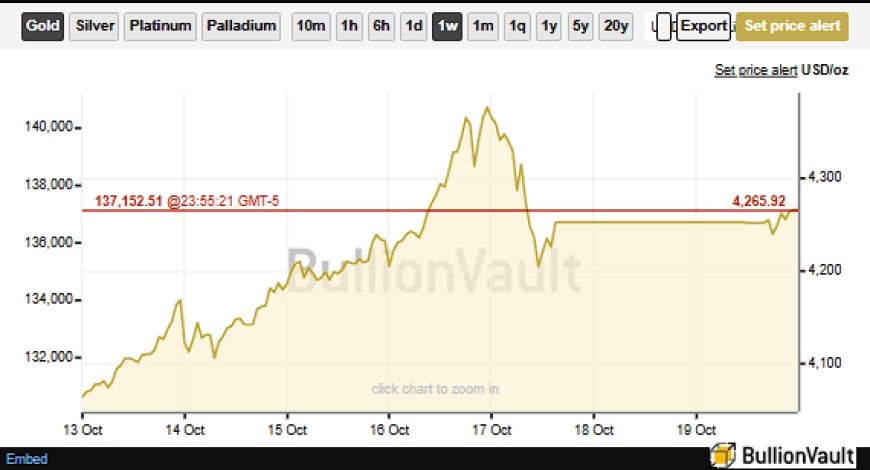
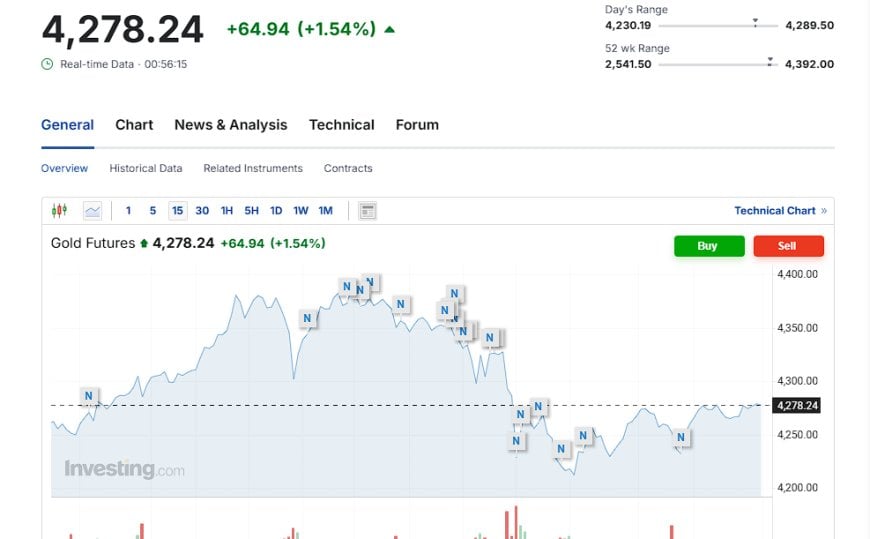
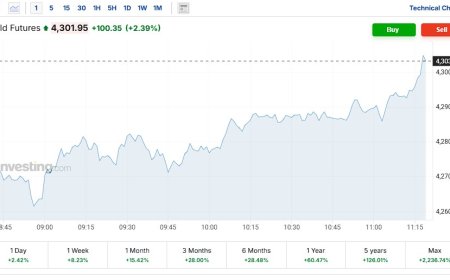
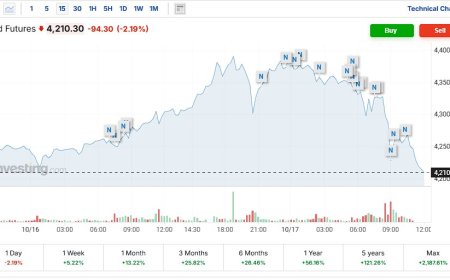
Gold around $4,200–$4,300 sits right at the ceiling of that 50-year channel.
Every previous touch of this line — 1980, 2011, 2020 — triggered consolidation. This time, however, several forces are different:
-
Central banks are net buyers, not sellers.
-
Debt is exponential, not cyclical.
-
Liquidity creation is digital and instantaneous, not mechanical.
-
Confidence in fiat systems is fragmenting, not concentrating.
This combination has created a feedback loop the old models can’t easily absorb. The usual containment mechanisms — futures leverage, swaps, and synthetic paper supply — are being overwhelmed by physical accumulation and policy uncertainty.
Two Possible Paths
1️⃣ The Contained Scenario — “Fractal Within the Fractal”
Gold cools off near current levels, consolidates between $3,900–$4,100 for several months, and forms a new base. The pattern remains intact. The next leg higher resumes once liquidity expands again — possibly late 2026.
2️⃣ The Breakout Scenario — “Regime Shift”
Gold tears straight through $4,600–$4,800 and doesn’t look back.
This would be the first time since the 1970s that the upper slope fails to contain price action — effectively declaring a new monetary geometry.
At that point, projections stretch toward $10,000–$12,000 by the early 2030s as real-asset collateral is repriced for the digital-currency era.
The Deeper Implication
If that second path unfolds, it’s not just about gold.
It would confirm that the old financial structure — the one built on managed debt, yield control, and fiat elasticity — has reached its physical limits.
Gold wouldn’t be “rising”; it would be re-denominating the system beneath it.
That kind of move would rival the 1970s peak wave — but compressed into a far shorter timescale.
Information now moves faster than policy. Markets price structural stress in weeks, not years. And the “containment line” that once represented confidence may now represent disbelief.
The Takeaway
If gold cools off here, the pattern holds — another successful containment, another decade within the same geometry.
If it breaks higher, we’re no longer measuring inflation or speculation.
We’re measuring the velocity of trust leaving paper promises and migrating back to tangible value.
Either way, the next few months will reveal whether this is just another cycle…
or the moment the 50-year trend finally breaks.
你的反应是什么?
 喜欢
0
喜欢
0
 不喜欢
0
不喜欢
0
 爱
0
爱
0
 有趣
0
有趣
0
 哇
0
哇
0
 悲伤
0
悲伤
0
 愤怒
0
愤怒
0

Founder of Pattern Nexus. I research markets, macro, geopolitics, AI, history, ancient systems, and the patterns most people overlook. I’m also building Market Radar, a trading scanner designed to read pressure, risk, confirmation, and setup quality before chasing a move. Pattern Nexus is where I connect the dots between data, history, technology, and the bigger system playing out around us.















评论s (0)