
The Weekly Market Wrap: The Week the 10-Year Stopped Listening
A volatile week across equities, bonds, commodities, and crypto. Stocks chopped, gold spiked then crashed, Bitcoin cooled off, and the U.S. 10-year Treasury defied the Fed yet again. A deep Pattern Nexus breakdown of what markets are really pricing: liquidity, deficits, AI capex, and the rising cost of capital.
Weekly Market Wrap: When the 10-Year Stops Listening
Week of November 10–14, 2025
This week felt like watching five different markets trade five different realities. Stocks finished only slightly higher on the week, but the intraday tape was violent. Gold ripped, then got hammered. Bitcoin gave back a big chunk of its recent melt-up. And the 10-year Treasury spent the week reminding everyone that the Fed can talk about cuts all it wants – the long end is going to price structural reality, not speeches.
– This Week’s Pattern (TL;DR)
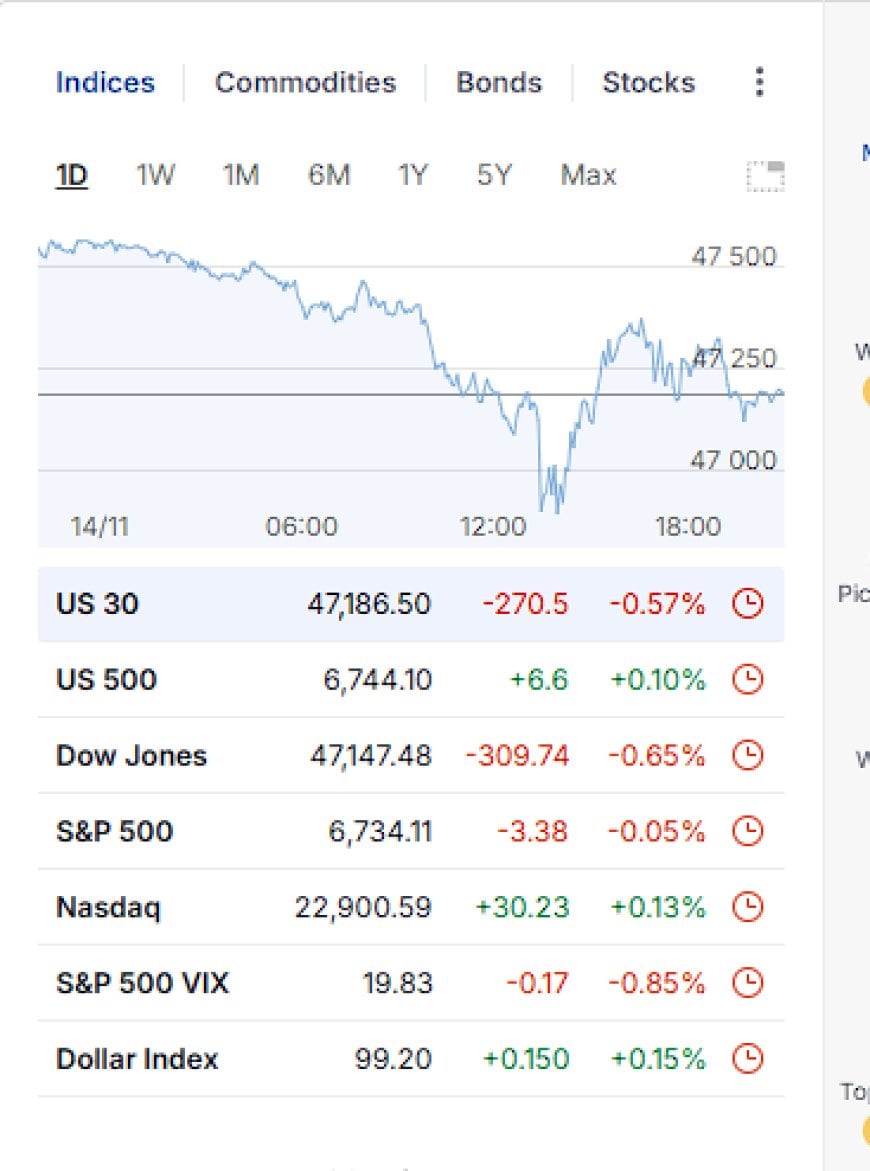
- Equities: The S&P 500 finished the week up about 0.1% and the Dow up roughly 0.3%, but that calm weekly change hides a brutal Friday intraday dump that was almost completely retraced before the close.
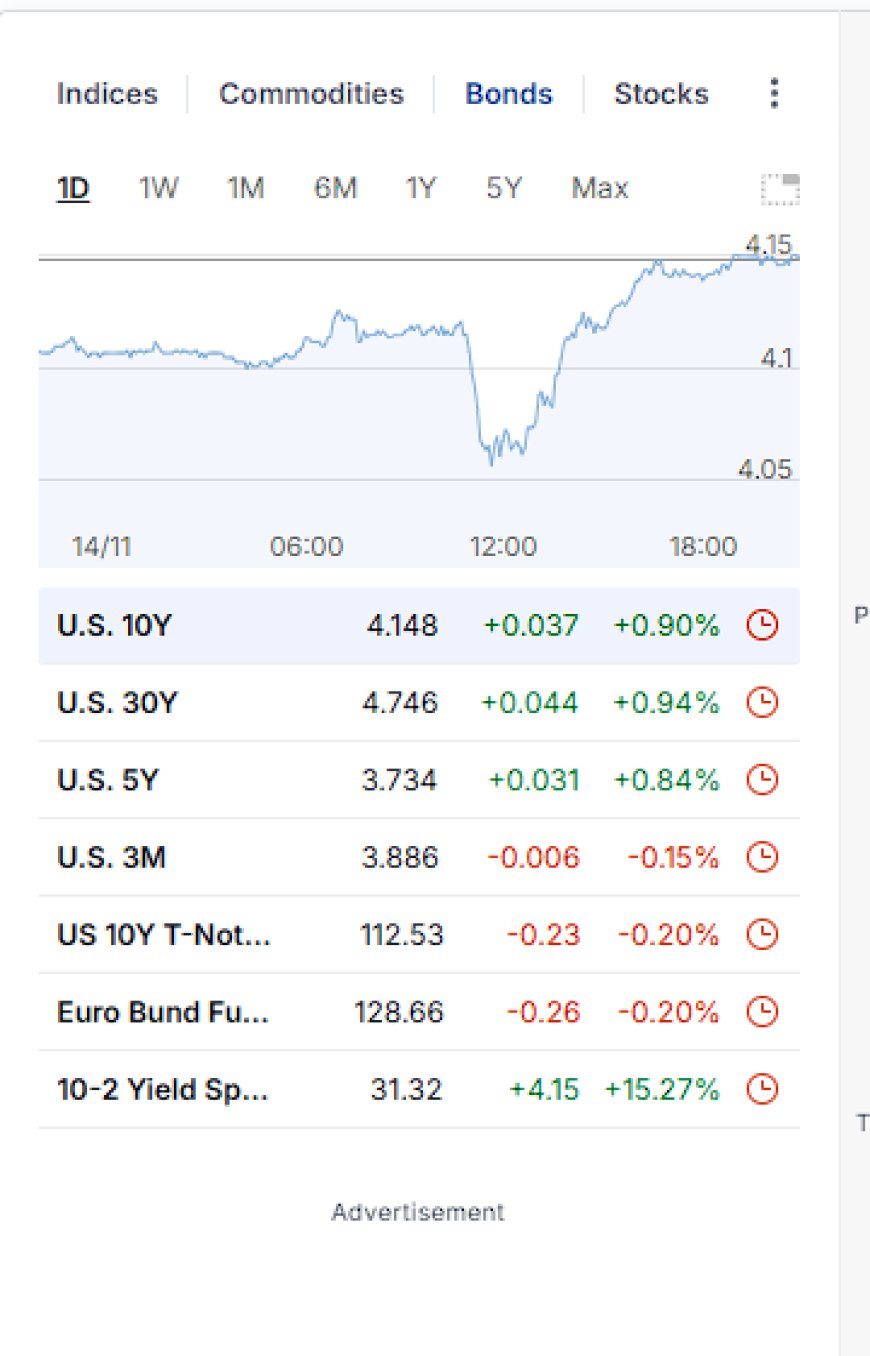
- Bonds: The 10-year Treasury yield spent the week oscillating around 4.1%, dipping early and then jumping back to roughly 4.15% by Friday as traders marked down the odds of near-term cuts and term premiums pushed higher.
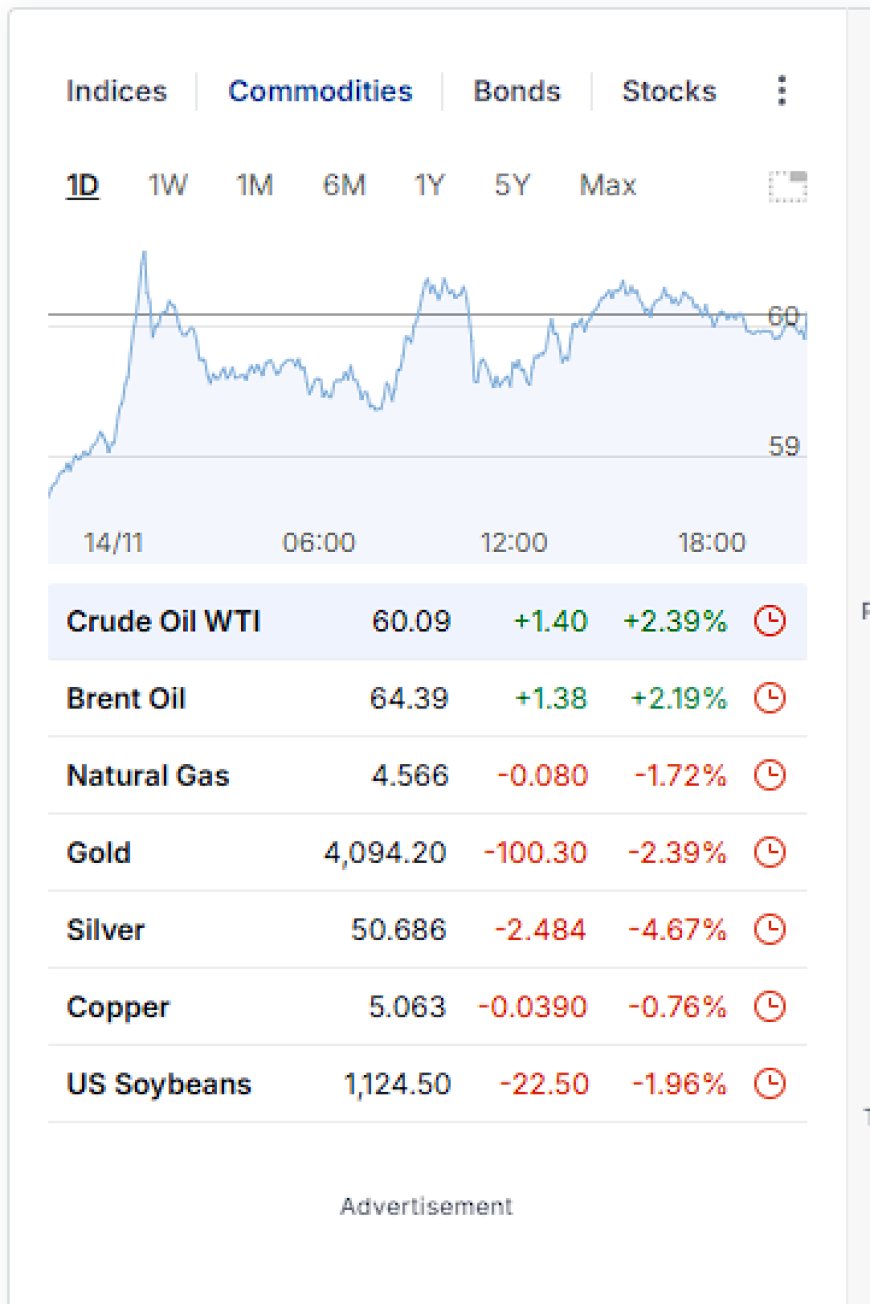
- Commodities: Oil held a decent bid. Gold and silver were the main casualties into the end of the week – gold is still up on the week overall after a strong Monday/Wednesday spike, but Friday’s flush was a reminder that liquidity and term premia still matter more than narratives.
- Crypto: Bitcoin and majors mostly digested the prior melt-up. BTC was down solidly from last week’s highs, but without cascading liquidations – more of a “cool-off” than a full regime change.
- Macro tape: Markets spent the week repricing December cut odds lower after hawkish Fed commentary, while the reopening of the U.S. government pulled forward a wave of delayed data and renewed focus on deficits and supply.
- Net frame angle: The long end is saying, “You can cut the front end, but the cost of real capital isn’t going back to the 0% world.” The 10-year’s refusal to follow the funds rate lower is the tell that matters.
Equities: Vol Spike Without a True Risk-Off
On the surface, the week ended looking tame: the S&P 500 gained a hair, the Dow added roughly a third of a percent, and the Nasdaq squeaked out a small weekly rise. Underneath that, though, Friday traded like two different markets stacked on top of each other – a 1%+ dump out of the gate, followed by an almost full intraday round-trip that left the S&P down just 0.1% on the day and the Nasdaq marginally green.
That intraday whiplash lined up almost perfectly with the move in the 10-year. As yields slid early, equities caught a reflex bid. Once the long end turned and ramped back toward 4.15%, the early equity pain returned, especially in anything duration-heavy or liquidity-dependent.
The interesting part wasn’t the index level – it was the internals. AI-linked names and data-center infrastructure stocks remained at the center of the storm. The “AI industrial” complex sold off hard in the morning and then ripped back as dip-buyers stepped in, effectively using the rate scare as an entry point rather than a reason to abandon the theme.
Market Internals: Biotech Casinos and Falling Knives
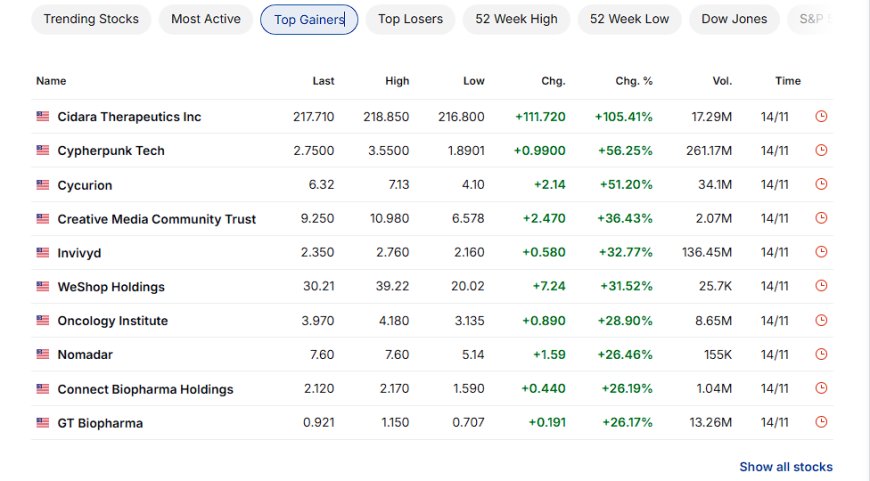
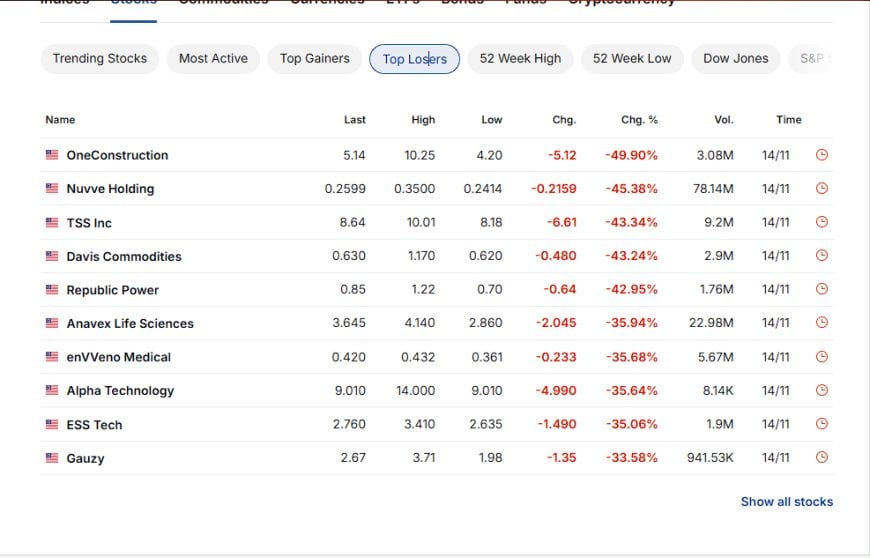
our gainers/losers panel is the late-cycle picture in one screenshot:
- Biotech and micro-cap names putting in +30% to +100% days on thin volume.
- Single-stock collapses of –35% to –50% as capital abandons stories that can’t survive 4%+ long-term money.
This is what I expect from a regime where liquidity is no longer free but still abundant enough to power narrative pockets. It’s not “everything bubble” behavior anymore – it’s targeted speculation sitting on top of a much more expensive cost of capital. The indices barely move, but people inside individual names are experiencing full-blown bear and bull markets in the same week.
From the Pattern Nexus perspective, that’s the equity side-quest of the larger system story: markets are trying to figure out which companies actually survive the refinancing wall and which ones only existed because money was cheap.
Bonds: The 10-Year’s Bizarre Refusal to Behave
This was the main character of the week.
Across the week, the 10-year yield moved from roughly 4.13% on Monday to about 4.15% by Friday – a small net change that massively understates the volatility in between. Intraday on Friday it traded like a meme stock: early-session buying drove yields lower alongside the equity dump, only for that move to fully reverse as Fed officials pushed back on aggressive cut expectations and term premia re-inflated.
At the same time, a fresh Reuters poll of bond strategists essentially blessed the current level as “home base,” projecting the 10-year to hover around 4.10% in 3–6 months and drift only slightly higher toward ~4.2% over a year, even with an estimated $3 trillion in additional federal borrowing over the coming decade. The message from the street: this is the new normal unless inflation surprises shock the system.
So why does the tape trade like it’s nervous?
- Supply is relentless. The reopening of the government brings a flood of delayed issuance back online. Every refunding cycle re-tests how much duration the private market is willing to absorb without help.
- Cut odds are softening, not collapsing. After the October cut, markets were leaning hard into a December follow-up. Hawkish commentary this week knocked those odds down, and yields responded quickly.
- Term premia are real again. When you layer massive fiscal deficits, political noise, and structural capex demand on top of an already-elevated debt load, investors demand a non-trivial premium to hold 10-year paper, even if inflation expectations don’t explode.
Put together, this is exactly the behavior I’ve been flagging for months: the Fed can steer the front end, but the long end is increasingly a referendum on:
- Deficits and issuance volume
- Global demand for U.S. collateral versus alternatives
- The scale of the AI/energy capex cycle that wants real returns, not financial repression
The weekly takeaway: a 10-year anchored around 4–4.25% is compatible with the system muddling through. The danger is not the level so much as the path – failed auctions, air-pockets in liquidity, or a sudden repricing of term premia that forces the Fed into yield-curve control or stealth QE to prevent a true funding accident.
Commodities: Oil Resilient, Gold’s Roller Coaster
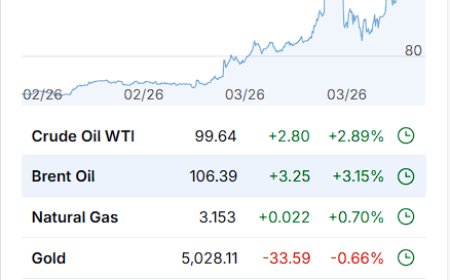
our commodities panel captures a classic “liquidity tightening into a growth-uncertain world” pattern.
Oil & Industrial Inputs
Crude finished the day in our screenshot up roughly 2–3%, and it spent most of the week grinding higher off the back of:
- Ongoing OPEC+ discipline
- Lingering worries about supply disruptions and geopolitical risk
- The structural story that AI data centers, grid upgrades, and re-industrialization quietly ratchet up baseline energy demand over the next decade
This is the slow-burn side of the AI-industrial frame: energy and metals as the physical backbone of intelligence expansion.
Gold & Silver: Up on the Week, Smashed on Friday
Gold and silver had a wild ride. Early in the week, gold pushed to fresh multi-week highs on rising expectations of a December Fed cut and ongoing central-bank demand. By mid-week it was trading north of $4,200, up around 2–3% on the week. Then Thursday and Friday hit.
Following hawkish-tilted Fed commentary and a general risk sell-off, gold dropped ~1% on Thursday and nearly 2–3% intraday on Friday before bouncing into the close. Even after that flush, bullion still finished the week higher overall – but the message was clear: liquidity and real-rate expectations still dominate the day-to-day tape, even with all the structural debasement narratives in the background.
Silver exaggerated all of that in both directions – classic beta to the monetary metal trade – posting a bigger percentage drop into the end-of-week air pocket.
From the Pattern Nexus lens:
- Oil and industrials are trading off future physical demand tied to AI, energy, and re-industrialization.
- Gold and silver are trading off the glidepath of real yields and the credibility of the policy regime. The longer the 10-year refuses to come down with cuts, the more choppy the metals path becomes, even if the long-term direction stays up and to the right.
Crypto & Dollar: Quiet De-Leveraging Under the Surface
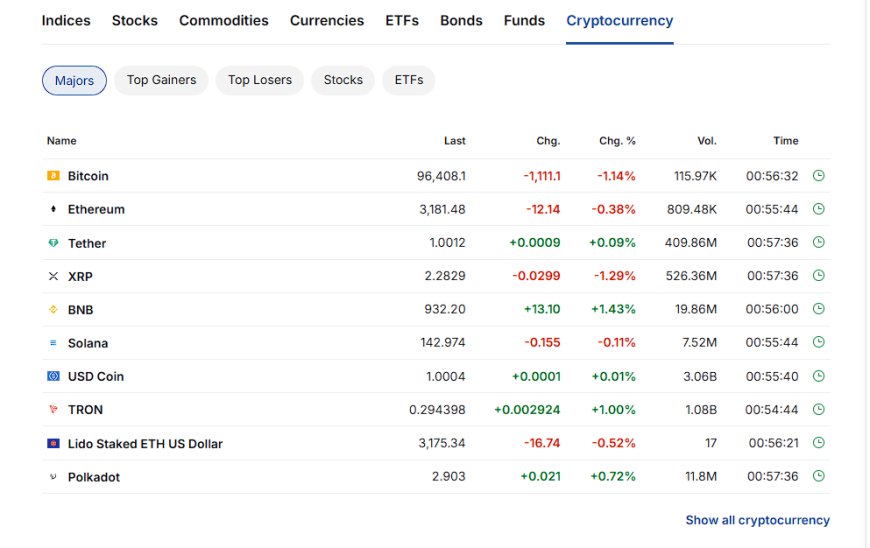
Relative to everything else, crypto had a “boring” week – which in crypto terms still means real money changing hands.
Bitcoin spent the week backing off recent highs, down solidly from last week’s peak but without the kind of cascading liquidations that mark the end of a cycle. Think of it as the market digesting a parabolic move rather than repudiating the asset class. The majors followed a similar pattern: mild red or small green prints day-to-day, but net lower than the recent blow-off levels.
The dollar index in our screenshot finished the day modestly higher. That lines up with the repricing of cut odds: a slightly less-dovish Fed plus a world still short high-quality collateral keeps the dollar bid even when U.S. data isn’t pretty. It’s less “America is perfect” and more “there still isn’t a better large-scale collateral base.”
In the broader net frame, crypto continues to behave like a high-beta option on the emerging tokenized-collateral system I’ve been writing about. It loves liquidity waves and hates weeks where term premia rise and the 10-year reminds people that capital has a cost again.
Funds & Flows: Passive Walls and Comfortable Cash
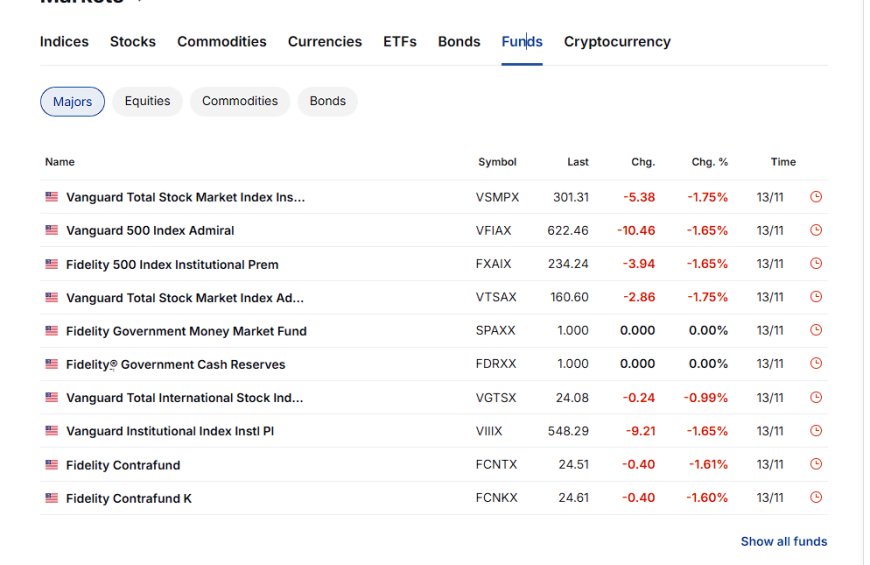
The big cap-weighted index funds were red on the day of the screenshot but not in panic mode. That’s exactly what you’d expect given the weekly outcome: a lot of noise intraday, very little change when you zoom out to the close-to-close numbers.
Meanwhile, the government money-market funds are pinned at $1 with yields north of 4%. That’s the invisible competitor to every asset discussed above. Every time the 10-year rips higher and gold or high-beta tech gets slammed, a non-trivial chunk of capital says, “You know what, 4–5% in T-bill-backed cash doesn’t sound so bad.”
This is the core tension of the cycle:
- The AI-industrial build-out demands enormous long-duration capital and leverage.
- The front end of the curve offers a very attractive, very liquid alternative that doesn’t require you to believe in any particular story.
Until something breaks hard enough that policymakers are forced back into outright QE, this tension is going to define how fast the AI/energy capex cycle can spin without over-levering the system.
How This Week Fits the Broader Net
Zooming out from the daily noise, this week was another datapoint in the same structural pattern I’ve been mapping across Pattern Nexus:
- The AI / energy / infrastructure flywheel keeps pulling capital forward. Equity and credit markets still treat data centers, grid upgrades, and high-end compute as “must fund” projects, even when rates back up.
- The fiscal firehose isn’t slowing down. The reopening of the government just resumes the prior path: heavy issuance, persistent deficits, and a Treasury market that needs to clear huge amounts of duration at a time when traditional buyers are more price-sensitive.
- Liquidity is now rented, not owned. The Fed can cut the front end, but the long end is trying to enforce a real-rate floor that reflects actual risk, not a 2010s fantasy.
- Every asset class has become a side-quest of the same boss fight: funding an AI-powered, energy-hungry, heavily indebted civilization without breaking either the bond market or the currency.
This week didn’t resolve any of that. It just showed where the strain is accumulating: in the 10-year’s choppy behavior, in the whipsaw of gold and silver, and in the quiet comfort of 4–5% cash competing with everything else.
What I’m Watching Next
- Upcoming 10- and 30-year auctions. Tails, weak bid-to-covers, or ugly dealer takedowns will matter more than another “data-dependent” soundbite.
- Fed communication vs. curve reality. Do they acknowledge the long end’s message, or keep pretending that the dots alone can steer the entire curve while deficits stay elevated?
- AI / power / grid announcements. New data-center clusters, nuclear restarts, transmission build-outs, and transformer bottlenecks – all of this feeds straight into the term-structure story.
- Gold and silver on dips. Does physical and ETF demand step in aggressively after this week’s flush, or does the market need a deeper shakeout before the next liquidity-driven leg higher?
For now, the simplest read is this: the system still works, but the 10-year is no longer an obedient follower of the Fed’s dot plot. It’s voting, in real time, on the entire net – deficits, AI, energy, demographics, and political risk. Weeks like this are when that vote shows up on the screen.
你的反应是什么?
 喜欢
0
喜欢
0
 不喜欢
0
不喜欢
0
 爱
0
爱
0
 有趣
0
有趣
0
 哇
0
哇
0
 悲伤
0
悲伤
0
 愤怒
0
愤怒
0

Founder of Pattern Nexus. I research markets, macro, geopolitics, AI, history, ancient systems, and the patterns most people overlook. I’m also building Market Radar, a trading scanner designed to read pressure, risk, confirmation, and setup quality before chasing a move. Pattern Nexus is where I connect the dots between data, history, technology, and the bigger system playing out around us.



















评论s (0)