
Market Wrap – November 17, 2025: Everything Red, but the 10-Year Still Runs the Show
Broad selloff across equities, metals, and crypto, while the dollar firms and the 10-year Treasury continues to defy the Fed’s 2026 rate-cut script.
Market Wrap – November 17, 2025: Everything Red, But the 10-Year Still Runs the Show
Equities, metals, and crypto sold off together while oil held near $60 and the dollar firmed. Under the surface, the real story is the Treasury curve quietly re-pricing the Fed’s 2026 narrative.
Cross-Market Snapshot – Red Across the Board
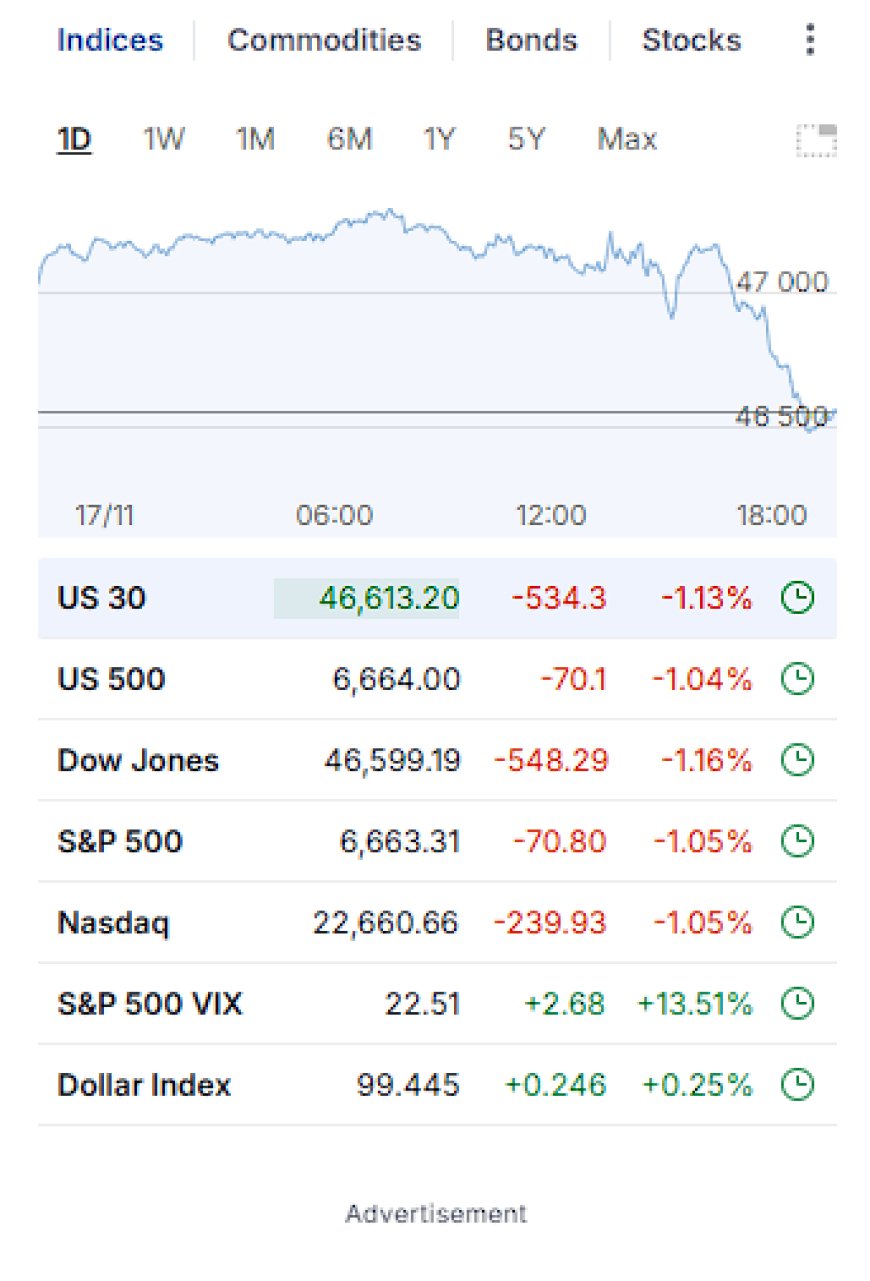
Today had the feel of a “nothing is working” session. US indices rolled over hard into the close, with the Dow and S&P 500 both down around 1.2–1.3% and the Nasdaq off a similar amount, giving back last week’s bounce. The VIX popped double-digits, reflecting a bid for protection rather than outright panic.
Commodities didn’t offer much refuge: gold and silver both slid, WTI hovered just under $60 a barrel with only a small loss on the day, and base metals were generally red. Crypto extended its multi-week bleed, with Bitcoin trading in the low $90Ks and probing new six-month lows.
The dollar index firmed modestly, reinforcing the “risk off but not crisis” tone: money rotated toward dollar cash and Treasuries rather than fleeing the system outright.
Equities – Broad Selloff, Micro-Mania Under the Surface
Major US indices closed near session lows:
- Dow Jones / US 30: roughly –1.1% on the day
- S&P 500: about –1.0% to –1.1%
- Nasdaq: a bit over –1.0%
- S&P 500 VIX: +13% on the day, reflecting renewed demand for hedges
The macro narrative from the mainstream desks was simple: traders are de-risking ahead of Nvidia’s earnings and the next jobs data print, both of which are now viewed as key catalysts for the Fed’s 2026 path.
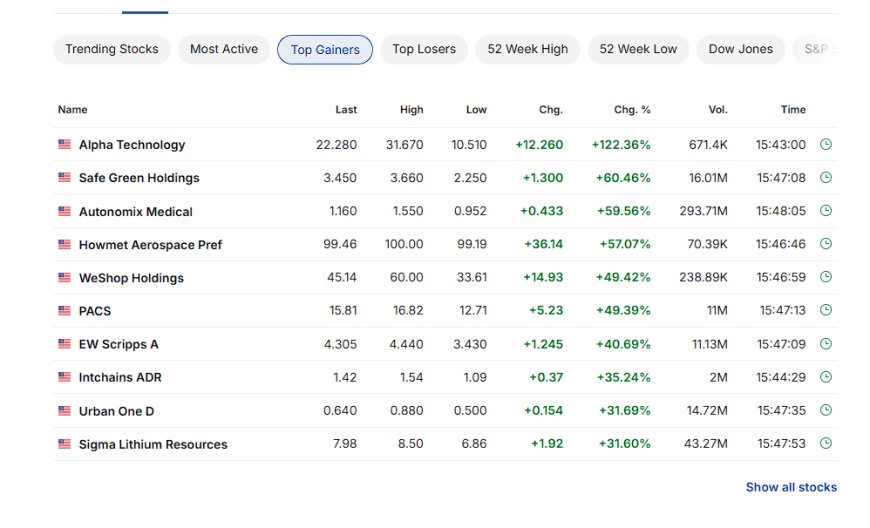
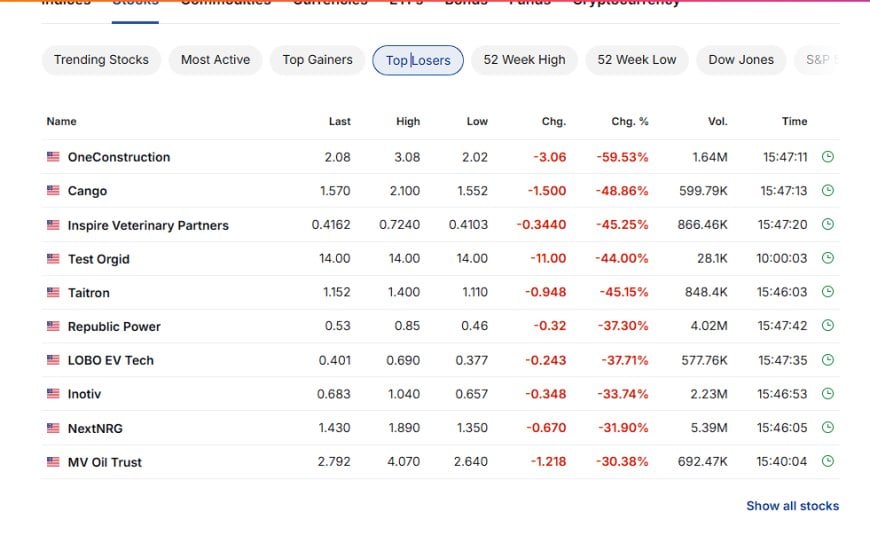
Under the index surface, it was another day of micro-cap whiplash. The top gainers list was stuffed with tiny names posting +40–120% moves, while the top losers were down 30–60% in a single session. That’s classic late-cycle liquidity behavior: the index looks “risk off,” but pockets of speculative leverage are still detonating in both directions.
Big picture, the equity tape is starting to respect what bond markets have been saying for months: earnings expectations for 2026 were priced off a world of gentle disinflation + clean rate cuts. We’re instead drifting into a world of sticky 3% inflation, noisy politics, and structurally higher term premia.
Commodities – Oil Holds the Line, Metals Can’t Catch a Bid
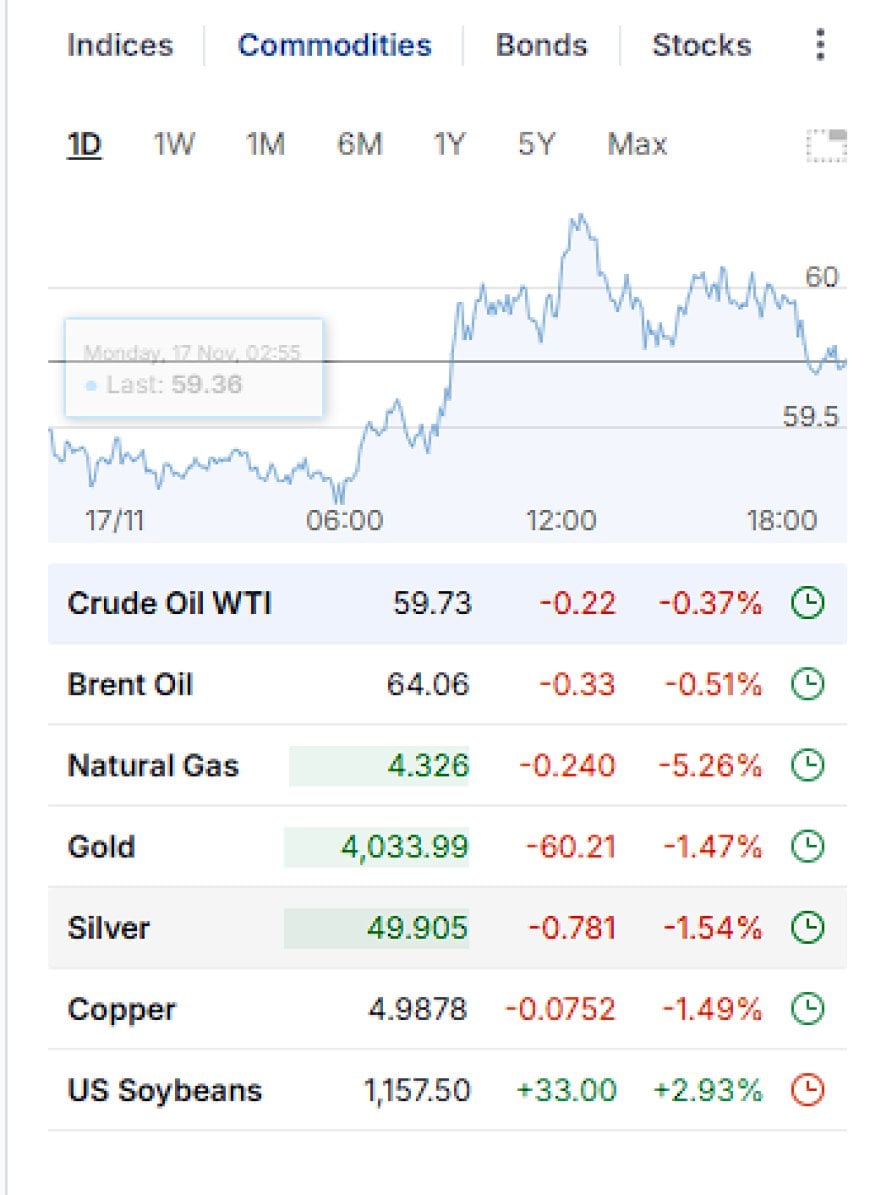
Energy: WTI crude spent the day oscillating around $59.50–$60, closing just under $60 and down less than 1%. Given the risk-off tone in equities, that’s actually resilience; markets are balancing soft global growth expectations against structurally tight capacity, underinvestment, and AI-driven power demand.
Metals: Gold and silver both slipped roughly 1.5% on the session, continuing a short-term downtrend as real yields grind higher and the dollar firms. The key here is psychological: even with geopolitical risk and cross-asset selling, gold isn’t acting like the “only hedge” — the market still believes Treasuries and dollars are functional shock absorbers.
Ags: Soybeans popped a few percent, but that move sits more in the world of supply/weather positioning than in the core macro story.
Rates & Bonds – The 10-Year Keeps Ignoring the Fed’s Script
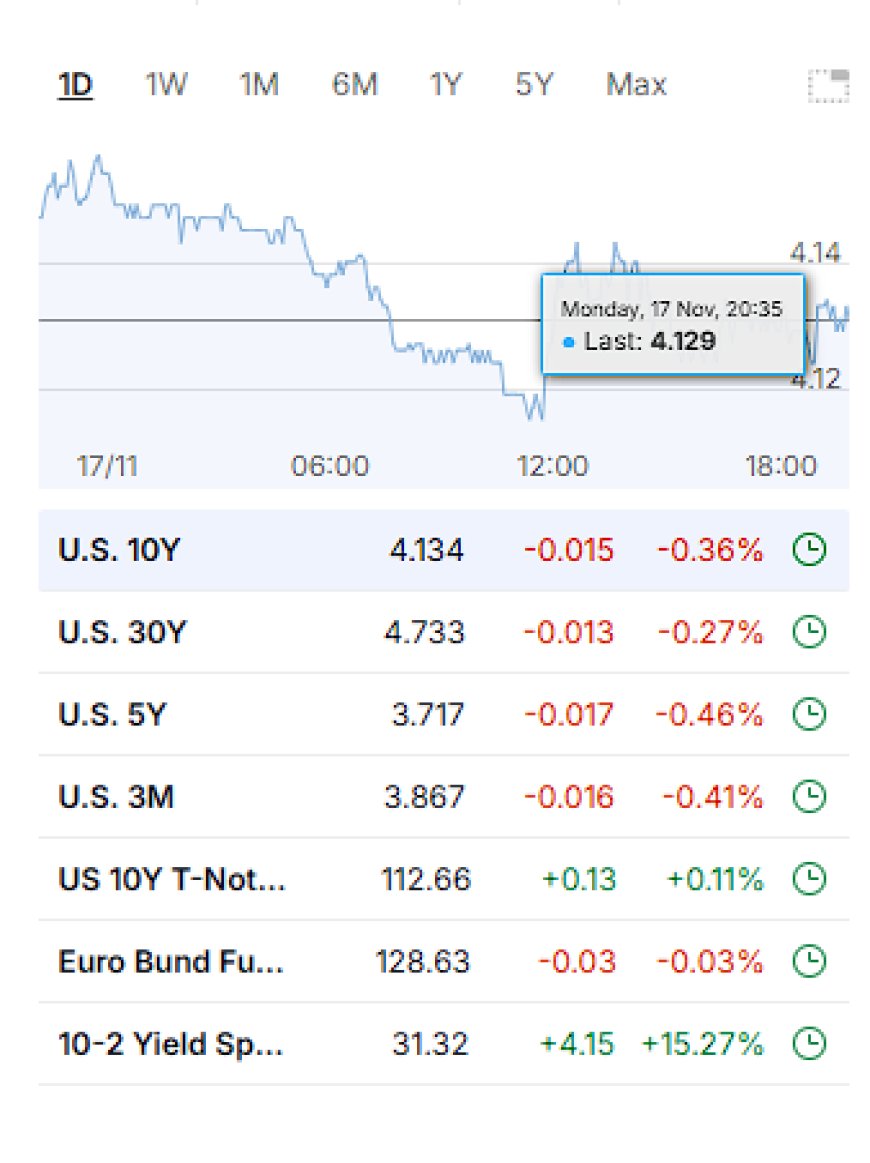
The 10-year Treasury yield finished the day around 4.13–4.14%, only a hair below the prior close and still above last week’s lows.{index=7} Intraday, yields dipped when stocks briefly tried to rally, then pushed back toward the highs as the equity rebound faded. That’s the key dynamic: the long end is no longer obediently following the “Fed will cut, everything will be fine” script.
On a multi-week basis, we’re seeing exactly what bond strategists have been warning about: a gradual steepening of the curve as 2-year yields drift lower on future-cut expectations while the 10-year refuses to break much below 4%.Term premium is doing the talking — reflecting:
- Persistent fiscal deficits and heavy Treasury issuance
- Tariff noise and political risk for 2026
- The capital intensity of the AI–industrial build-out (data centers, power, grid)
In other words: even if the Fed trims policy rates, the market is repricing the “risk-free” curve itself. That’s what I mean when I say the 10-year isn’t listening to the Fed’s story anymore.
Dollar & FX – Quietly Firm in the Background
The dollar index ticked higher by roughly a quarter of a percent today — not a breakout, but enough to matter when everything else is red. That mix (stocks down, gold down, dollar up, yields sticky) tells you this is less about an immediate “crisis” and more about a positioning reset inside the existing dollar system.
Global bond markets echoed the same tone: euro-area 10-year yields were little changed, still hovering near their recent levels, as traders digest both local fiscal stories and the US curve.
Crypto – Grinding Deleveraging Continues
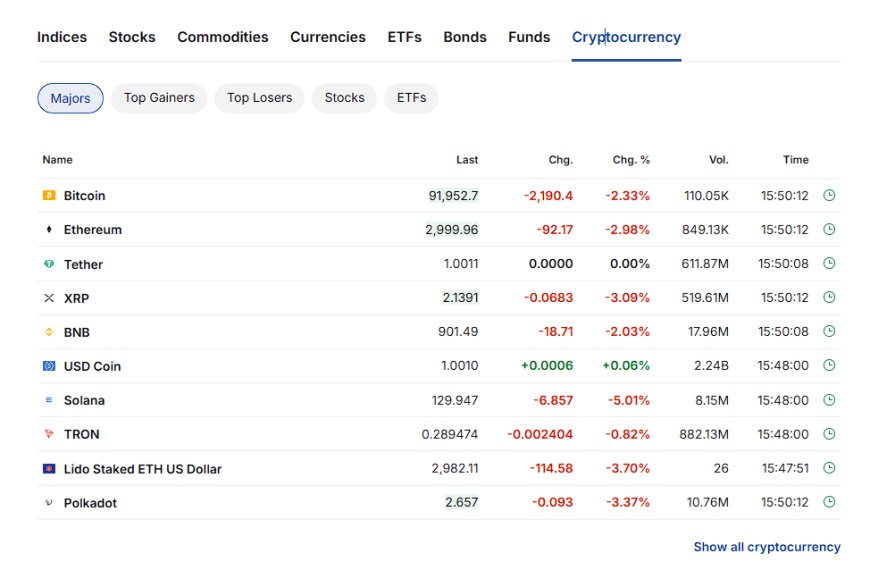
Bitcoin spent most of the session in the $91–93K band, down roughly 2–3% on the day and now more than 25% off its October high. Several desks noted it has effectively given back all of its 2025 gains, with on-chain data pointing to capitulation from short-term holders.
Ethereum and other majors like Solana underperformed further, with 3–5% drops as the alt-side of the complex continues to deflate. This is what a slow, grinding deleveraging looks like when broader risk assets are no longer providing positive feedback loops.
Importantly for the Pattern Nexus framework: none of this challenges the long-run story of stablecoins and tokenized Treasuries as the plumbing of the next dollar system. What we’re seeing is the speculative layer getting marked back to reality while the underlying rails (Treasuries, dollars, CBDC pilots, and regulated stablecoins) quietly entrench themselves.
Structural Pattern – The Market Is Rewriting 2026, Not Pricing a Crash
Put all of today together and the pattern is clear:
- Equities are repricing earnings and valuations from “AI + easy Fed” toward “AI + sticky inflation + fiscal overhang.
- The 10-year refuses to sustainably trade below the low-4s, keeping the cost of capital structurally higher.
- The curve is slowly steepening even before the Fed officially moves, as markets pre-position for cuts at the front end but demand a higher premium at the long end.
- Crypto is acting like a high-beta macro asset again, not an uncorrelated hedge.
- The dollar stays firm, reinforcing that global capital still hides inside the dollar system when things get weird.
This is exactly the environment I’ve been mapping out: a transition from the old “free money + QE solves everything” regime to an AI-industrial, capital-intensive regime where:
- Massive capex into data centers, power, and grid forces higher real rates over time
- Fiscal deficits and defense spending keep Treasury supply heavy
- The Fed’s ability to “guide” the long end shrinks relative to the bond market’s own risk calculus
Days like today feel “weird” because everything sells off at once, but that’s the point: the system is slowly renegotiating the price of time and risk heading into 2026.
Key Levels I’m Watching
- 10-Year Treasury: The 4.0–4.2% band remains the battleground. A clean break higher would pressure growth stocks; a sustained move below 4% would say the market finally believes in the Fed’s cut story.
- S&P 500: 6,600–6,650 is the immediate support zone; below that you start to validate the 5–6% pullback targets some strategists are floating.
- Bitcoin: $90K is now psychological support. A clean break opens the door to a deeper flush; a rebound from here would fit the “local bottom” arguments some analysts are making.
- WTI Crude: $58–60 as the near-term balance point between growth fears and structural tightness.
What to Watch Next
Over the next 24–72 hours, the catalysts are straightforward:
- Nvidia earnings – the market’s proxy for AI capex and the “AI industrial flywheel.”
- US jobs and inflation data – not just for the headline prints, but for how they reshape rate-cut odds for mid-2026.
- Further steepening of the curve – if 2s drop while 10s refuse to follow, the market is openly contradicting the Fed’s forward guidance.
Каква е вашата реакция?
 Харесай
0
Харесай
0
 Не ми харесва
0
Не ми харесва
0
 Любов
0
Любов
0
 Смешно
0
Смешно
0
 Уау
0
Уау
0
 Тъжен
0
Тъжен
0
 Ядосан
0
Ядосан
0

Founder of Pattern Nexus. I research markets, macro, geopolitics, AI, history, ancient systems, and the patterns most people overlook. I’m also building Market Radar, a trading scanner designed to read pressure, risk, confirmation, and setup quality before chasing a move. Pattern Nexus is where I connect the dots between data, history, technology, and the bigger system playing out around us.









Коментари (0)