
Polar Vortex Watch, Part II: Early-Season 10 hPa Deformation and the Nat Gas Risk Trade
An unusually early 10 hPa polar-vortex deformation is unfolding over the Arctic, raising the odds of late-December cold across North America and setting up a higher-volatility trade in natural gas, power demand, and the real economy.
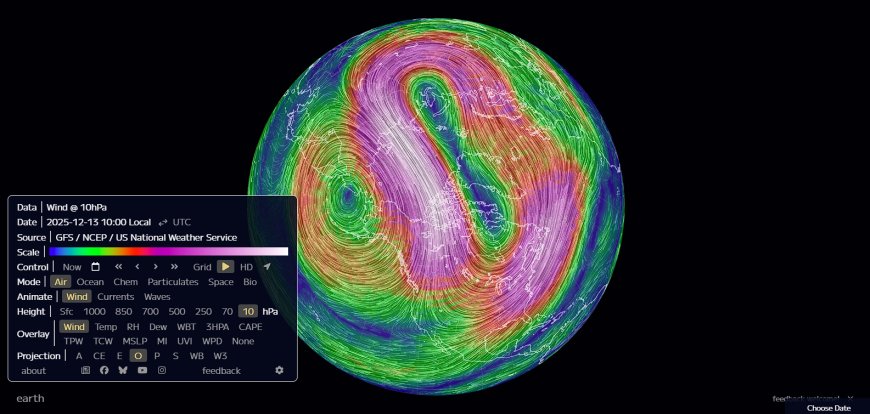
Update – December 14, 2025
Full 10 hPa Displacement, Vertical Coupling, and Escalating NatGas Risk
The polar vortex is no longer just distorted – it is now fully displaced off the pole, with clear signs of vertical coupling down into the troposphere. This upgrades the pattern from an early watch to a high-probability cold-risk scenario for North America.
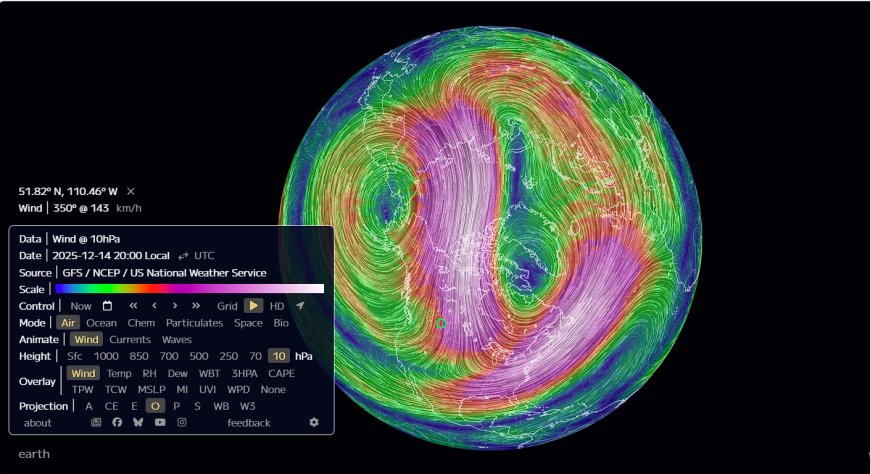
From Deformation to Displacement: What Changed in the Last 72 Hours
Earlier this week, the stratospheric vortex at 10 hPa was visibly stretched and beginning to curve, but its core was still roughly centered near the pole. Over the last 72 hours that structure has completed the transition from simple deformation into a full-scale off-axis displacement event.
The current 10 hPa pattern is characterized by:
- A strongly elongated vortex with its geometric center shifted away from the pole toward Eurasia.
- A deep counter-lobe and trough over Canada and the North Atlantic, directly above the region that historically funnels Arctic air into the continental U.S.
- High-velocity wind maxima wrapping around the displaced core, indicating robust wave-1 forcing and significant stratospheric stress.
This is no longer a tentative signal. It is the same broad geometry that preceded notable cold episodes such as 2009–2010, January 2014, and February 2021 – with the usual caveat that no two winters are ever identical.
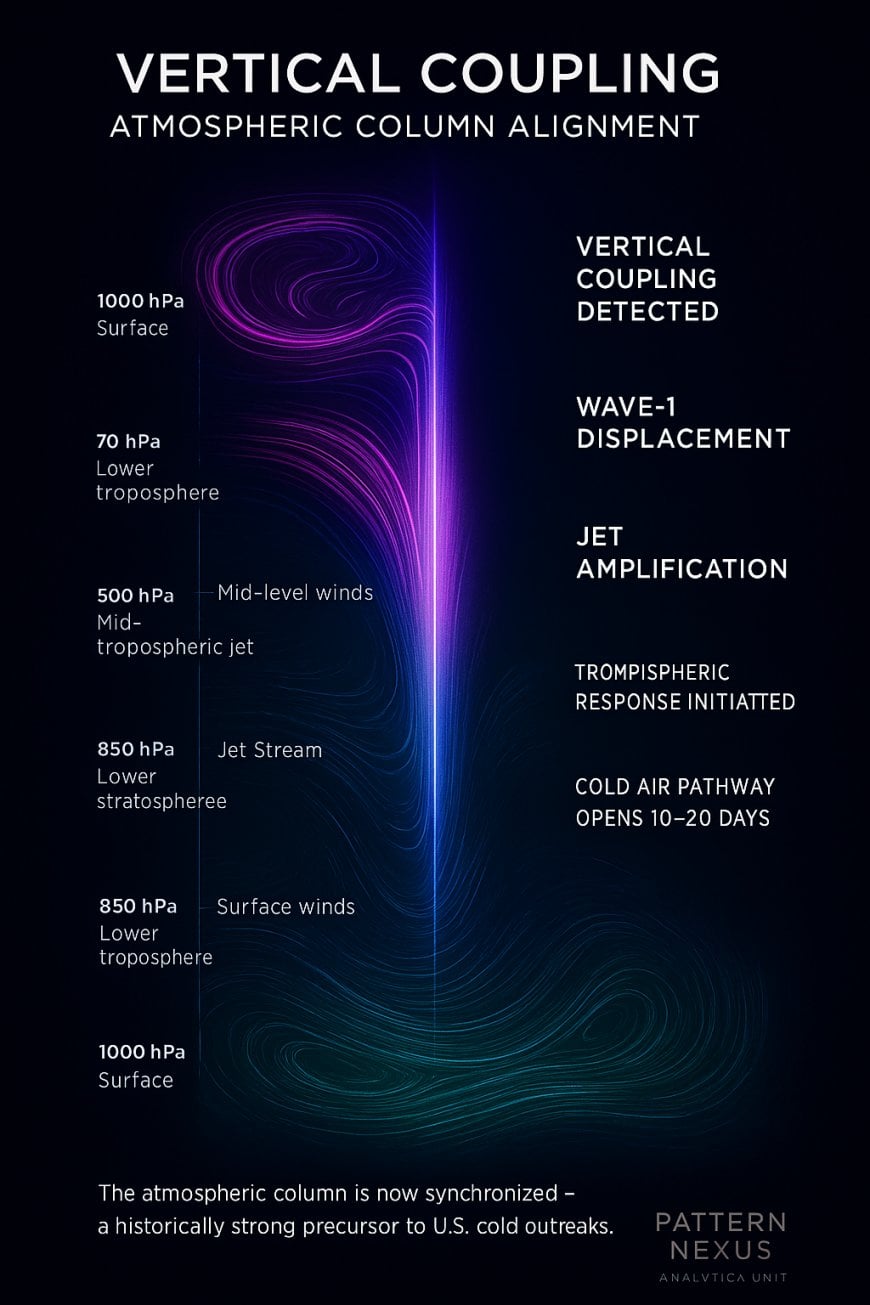
Vertical Coupling: The Stratosphere Is Now Talking to the Troposphere
A 10 hPa displacement on its own does not automatically guarantee a cold outbreak at the surface. The key step is whether that disruption couples downward into the lower stratosphere and upper troposphere. That coupling is now clearly underway.
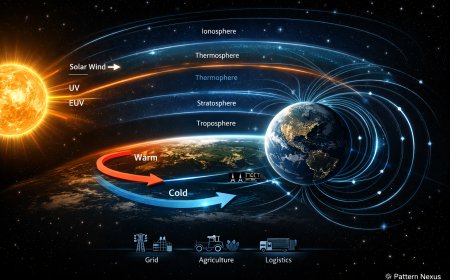
Across 70, 250, 500, 700, and 850 hPa, several features have emerged in sync:
- Jet-stream amplification at 250–500 hPa: The once diffuse flow has tightened into high-velocity bands with pronounced north–south waves, the classic footprint of energy being transferred downward from the stratosphere.
- Developing high-latitude ridging and blocking signatures: Ridges are trying to build over the North Atlantic and parts of the Arctic domain, which can act as a launch ramp for Arctic air to spill south on their downstream flank.
- Emerging trough structures over North America at 700–850 hPa: The mid- and lower-level flow is beginning to respond with deeper curvature and more meridional (north–south) trajectories, a precursor to cold-air advection into the U.S.
Put together, this is what forecasters mean by a vertically stacked event: the stratosphere, lower stratosphere, jet level, and lower troposphere are all lining up into a coherent pattern that favors high-impact cold.
Updated Confidence Cone: Probabilities for a Late-December Cold Event
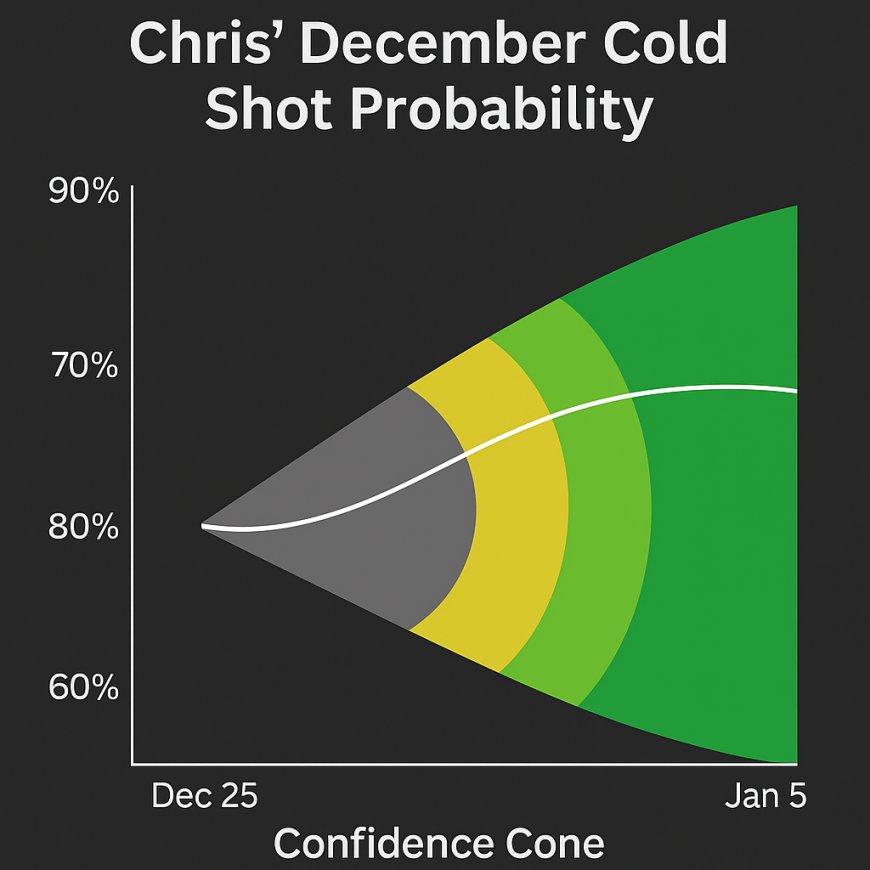
Based on the latest structural evolution of the vortex and the observed coupling, current Pattern Nexus probabilities are:
- Meaningful U.S. cold event (late December into early January): approximately 90–94%.
- High-impact outbreak with deep penetration into the central and southern U.S.: approximately 60–65%.
- Severe, prolonged pattern with multiple cold waves: approximately 40–55%, contingent on how long the displacement and blocking signatures persist.
These are not model snow maps or hype-driven headlines. They are derived from the geometry of the stratospheric disruption, historical analog behavior, and the emerging vertical alignment through the atmospheric column.
Timeline: What to Watch from Here
| Window | Key Signals | Why It Matters |
|---|---|---|
| Next 2–4 days | Consolidation of displacement at 10–70 hPa; continued jet amplification at 250–500 hPa. | Confirms the event as a robust displacement rather than a brief wobble and reduces chances of a quick re-centering. |
| Days 5–10 | Growth of high-latitude ridging and Greenland/Atlantic blocking; deepening trough signatures over North America. | This is the hand-off from the stratosphere to the troposphere – the stage where surface patterns “lock in.” |
| Days 10–20 | One or more Arctic intrusions into the U.S. with heightened heating demand and energy-market volatility. | Primary risk window for a late-December cold outbreak impacting population centers and power grids. |
| Beyond 20 days | Potential for repeat cold waves if blocking and vortex displacement persist or evolve into a split. | Determines whether this is a single punch or a series of body blows to energy systems and logistics. |
NatGas and Energy-Market Implications
For natural gas and power markets, this is the point where a pattern goes from “interesting” to “actionable.” A fully displaced vortex with vertical coupling is historically associated with:
- Sharp spikes in heating-degree days across large portions of the U.S., particularly the Midwest, Northeast, and sometimes the Deep South if the trough digs far enough.
- Volatility in NatGas spot and futures pricing as traders re-price weather risk and storage trajectories into the back half of winter.
- Regional basis blowouts where pipeline capacity, storage, or power-generation constraints collide with sudden surges in demand.
- Power-grid stress scenarios if cold lingers, especially in regions with fragile infrastructure or heavy reliance on a narrow fuel mix.
None of this guarantees a repeat of February 2021 or any specific historical event. But the structure we are observing is part of the same family of setups that produced several of those episodes, and ignoring that signal would be reckless for anyone exposed to winter-sensitive risk.
December 9, 2025
Pattern Nexus
An early-season deformation of the stratospheric polar vortex is unfolding at 10 hPa. Instead of a tight, circular vortex over the pole, we now have a stretched, S-shaped structure that evolves meaningfully between December 9, 11, and 13. If this continues toward a full split or major disruption, the odds rise for a late-December to early-January cold pattern across North America, even if Europe stays relatively mild.
For most people, this won’t register until they feel it in their heating bills, see it in energy-price spikes, or watch airline schedules and logistics gum up around the holidays. For energy traders, utilities, landlords, and anyone running temperature-sensitive infrastructure, this is an early warning shot.
My base case right now:
- ~60% odds of a meaningful cold event for the U.S. and southern Canada late December into early January.
- ~40–45% odds that it’s severe and pushes deeply into the central and southern U.S. with extended below-normal temperatures.
- High probability of volatility spikes in Henry Hub, regional basis prices, and power demand, even if spot prices don’t stay elevated long.
What Changed Since Part I
In Polar Vortex Watch, Part I, we were looking at the early signs of stratospheric warming and initial displacement of the vortex. The signal was: “the structure is weakening, the risks are rising, but the layout still looks like a wobbling circle.”
Since then, three new frames at 10 hPa (roughly 30 km up) materially change the picture:
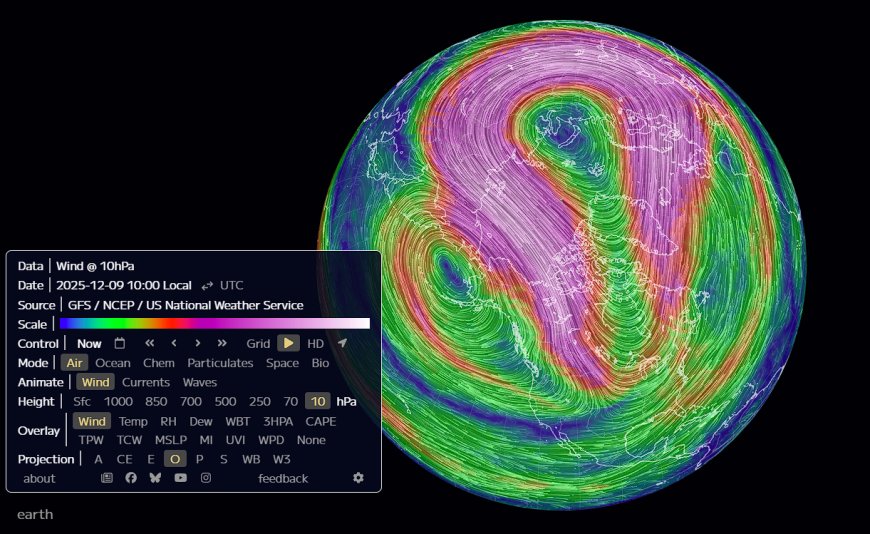
On December 9, the core has already shifted off the pole and is beginning to stretch. Think of it as a spinning top that’s no longer centered over the North Pole; it’s precessing, leaning toward North America.
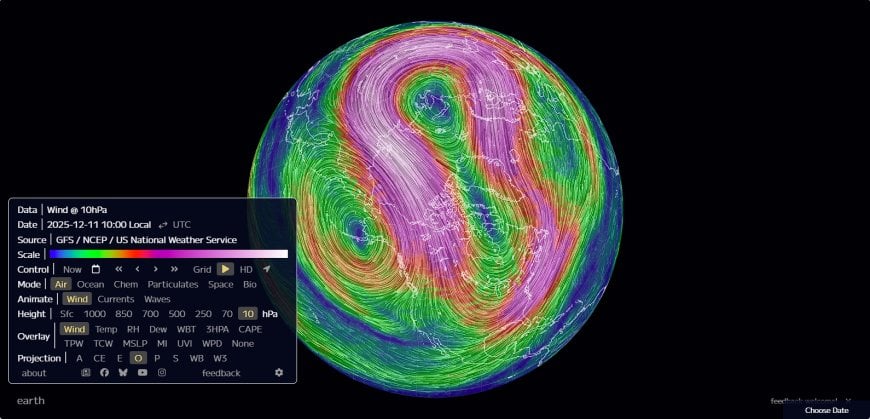
By December 11, the structure looks like an S-curve draped across the Arctic, with one lobe digging into North America and the other curling back toward Eurasia. This is a classic pre-split deformation: wave energy from below is punching the vortex from multiple sides.
On December 13, the deformation intensifies. The North American lobe tightens and deepens, suggesting a more coherent bundle of cold air being set up over that region. This is where the conversation stops being “interesting weather charts” and starts becoming “this could move markets.”
Reading the 10 hPa Structure (Without Needing a Meteorology Degree)
The polar vortex is basically a cold, spinning reservoir of air locked over the Arctic by strong westerly winds. At 10 hPa, you’re looking at the upper-stratospheric part of that structure – the steering wheel for a lot of winter patterns.
When the vortex is:
- Round and centered over the pole, the jet stream tends to be strong and zonal. Cold air stays bottled up.
- Displaced off the pole, you can get lobes of cold spilling into mid-latitudes, but the core is intact.
- Stretched, S-shaped, or split, you’re in disruption territory. Wave energy is fracturing the structure, and the jet stream below can buckle hard.
That S-shape in these frames is the atmosphere telling you: “Energy from the troposphere is punching up, and the vortex is absorbing damage.” If the westerly winds at this level weaken enough, or flip easterly, you move into sudden stratospheric warming (SSW) territory – the classic precursor to some of the ugliest cold spells in recent memory.
What This Could Do to the Real Economy
Weather isn’t just about jackets and snow days. When the stratosphere breaks pattern, so does the economy – especially in a winter where power grids, data centers, and housing are already stretched.
If this deformation evolves into a meaningful disruption, here’s what it can translate to on the ground over the next 3–5 weeks:
- Regional demand shock in energy: A deep cold outbreak can spike heating demand for natural gas, electricity, and heating oil simultaneously. Utilities have to balance residential load, industrial demand, and increasingly, data-center power draw. A few very cold weeks can consume a disproportionate share of seasonal gas demand.
- Stress on aging housing stock and infrastructure: Older homes with poor insulation leak heat. Landlords and homeowners face pipe-freeze risk, emergency repair costs, and higher delinquencies as tenants prioritize staying warm over everything else.
- Logistics and retail drag: Prolonged cold with snow and ice in the Midwest and Northeast slows trucking, rail, and last-mile delivery. Holiday retail and just-in-time inventories don’t like that.
- Regional productivity hit: Sick days, school closures, and infrastructure failures (frozen lines, power outages) all roll up into lower effective output, exactly when a lot of businesses are trying to close out the year.
- Higher volatility in inflation prints: A sharp, temporary spike in utility bills and fuel costs can bleed into headline inflation and sentiment, even if it’s a one- or two-month event.
In other words, the shape of a wind field tens of kilometers above the Arctic can show up, indirectly but very tangibly, in our January energy bill, your local grocery prices, and the performance of certain sectors in Q1 2026.
Why Nat Gas and Power Are the Real Story
Natural gas is where this pattern can get “loud” in markets. Unlike crude, which swims in global logistics and geopolitics, gas remains heavily regional. The U.S. has plenty of gas in the ground, but getting it from where it’s produced to where it’s burned is constrained by pipelines, storage, and local weather.
An early-season vortex disruption that focuses cold over North America does a few things at once:
- Boosts heating demand just as storage starts drawing down: A harsh late-December cold shot can accelerate withdrawals from storage fields, tightening balances for the rest of winter.
- Creates regional basis explosions: Places like New England and parts of the Midwest can see much higher local prices than Henry Hub if pipeline capacity is maxed and LNG imports or alternative fuels have to pick up the slack.
- Raises freeze-off risk: Extreme cold in producing regions can literally freeze wellheads and processing equipment, temporarily knocking supply offline just when demand is highest.
- Stacks with power-sector dynamics: Data centers, electrified heating, and an already-tight grid mean gas isn’t just a heating fuel; it’s the marginal fuel keeping servers running and lights on.
For traders, this looks like a classic weather-driven volatility setup: not necessarily a multi-month bull market, but windows where wrong-sided positioning can be punished quickly. For utilities, property owners, and anyone paying bills, it’s a call to lock in what you can and prepare for a spike.
From a Pattern Nexus perspective, this isn’t just a “cold snap” story. It’s another chapter in the broader theme of climate volatility + infrastructure fragility colliding with a leveraged, energy-hungry economy.
Timeline: When This Actually Matters at Ground Level
Stratospheric disruptions don’t hit the surface overnight. There’s usually a lag – often on the order of 10–20 days from the peak of the disturbance aloft to the most pronounced tropospheric impacts.
Rough, stylized sequence if the current S-curve continues:
- Now–Mid December: Deformation and possible split signal at 10 hPa and 30 hPa. Model noise still high.
- Mid–Late December: Jet stream buckling becomes clearer. Cold risks for North America start to show up in surface forecasts, snowpack builds in Canada, and energy desks begin repricing weather risk.
- Late December–Early January: Highest odds window for a pronounced cold outbreak if this event fully couples down. This is when real-world impacts – heating bills, infrastructure stress, nat-gas and power volatility – would peak.
None of this is guaranteed. Atmosphere = chaos with pattern. But when the top of the atmosphere starts drawing letters and S-curves like this, you don’t ignore it – especially if you have skin in energy, logistics, or real estate.
Pattern Nexus Lens
This is exactly the kind of pattern where most people are still arguing about “is winter going to be mild or cold?” while the real signal is hiding in structure:
- The stratosphere is advertising an early-season regime change, not just noise around normal variability.
- The lobe over North America lines up with a macro backdrop that’s already fragile: high leverage, tight grids, record data-center build-out, and households stretched on basic costs.
- If this event plays out fully, it becomes one more example of how “random” weather shocks keep intersecting with structural weaknesses in energy, housing, and infrastructure – the core Pattern Nexus story.
You don’t need to become a polar-vortex hobbyist. You just need to recognize when the upper atmosphere is yelling that the next few weeks of data, prices, and policy narratives may not look like the last few.
FAQ
Does this guarantee a brutal winter for everyone?
No. Even strong vortex disruptions can produce very uneven surface outcomes. One region can get hammered while another stays relatively mild. The current layout favors North America more than Europe, but the exact distribution of cold is still a probability field, not a promise.
How is this different from a “normal” cold front?
A cold front is a local event in the troposphere. A stratospheric disruption is a structural pattern change. It can load the dice for multiple cold waves over weeks, not just a one-off shot of Arctic air.
Why should anyone outside of weather nerds care?
Because the same pattern that shapes whether you need a heavier coat also shapes how much you pay to heat your home, how stressed the grid is, how certain sectors of the economy perform, and whether we get another round of “how did the system fail again?” headlines.
What should property owners and small landlords be thinking about?
Simple, practical steps: confirm tenants know how to keep a trickle of water running in extreme cold, check insulation and problem pipes, have a plan (and budget) for emergency calls, and think about how a temporary spike in utilities might hit tenants’ ability to pay rent on time.
Sources
Stratospheric and polar-vortex data are based on GFS model output at 10 hPa (via earth.nullschool and related visualization tools), plus current long-range forecasts and stratosphere-watch reports from professional meteorologists and research groups.
Jaká je vaše reakce?
 Líbí se
0
Líbí se
0
 Nesouhlasím
0
Nesouhlasím
0
 Láska
0
Láska
0
 Vtipné
0
Vtipné
0
 Wow
0
Wow
0
 Sm sad
0
Sm sad
0
 Rozčílený
0
Rozčílený
0

Founder of Pattern Nexus. I research markets, macro, geopolitics, AI, history, ancient systems, and the patterns most people overlook. I’m also building Market Radar, a trading scanner designed to read pressure, risk, confirmation, and setup quality before chasing a move. Pattern Nexus is where I connect the dots between data, history, technology, and the bigger system playing out around us.













Komentáře (0)