

The Polar Vortex Is Breaking Down. Now ECMWF Is Modeling a Major Midwest Storm.
Nine consecutive date-matched Arctic wind records, a forecast 10-hPa reversal, and ECMWF maps depicting an extraordinary late-November Midwest upper low. Pattern Nexus compares the NASA observations,…
A record-disrupted Arctic polar vortex and one of the more dramatic late-November Midwest storm solutions in the ECMWF operational model are now appearing in the same forecast window. The atmospheric connection is plausible. The model confidence is not equal.
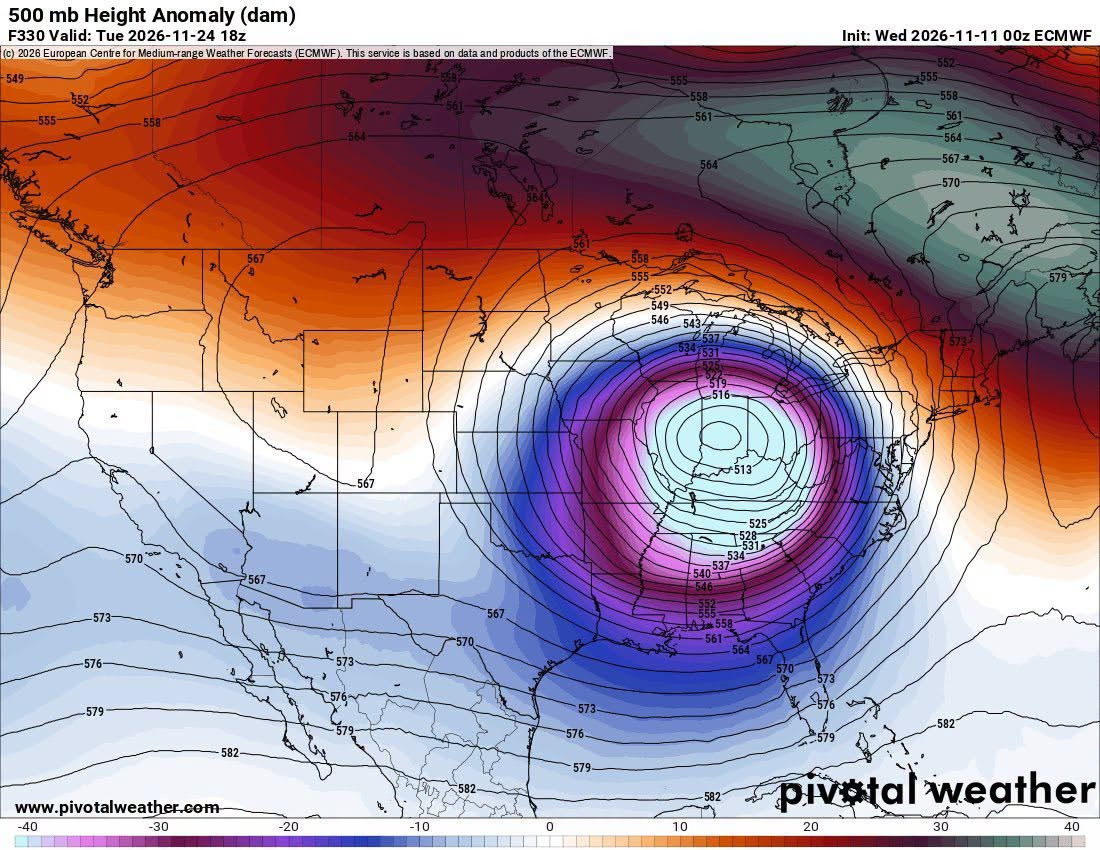
- November 24: ECMWF HRES depicts a deep 500-hPa closed low near the Midwest, with a ~985-hPa cyclone and intense winds aloft.
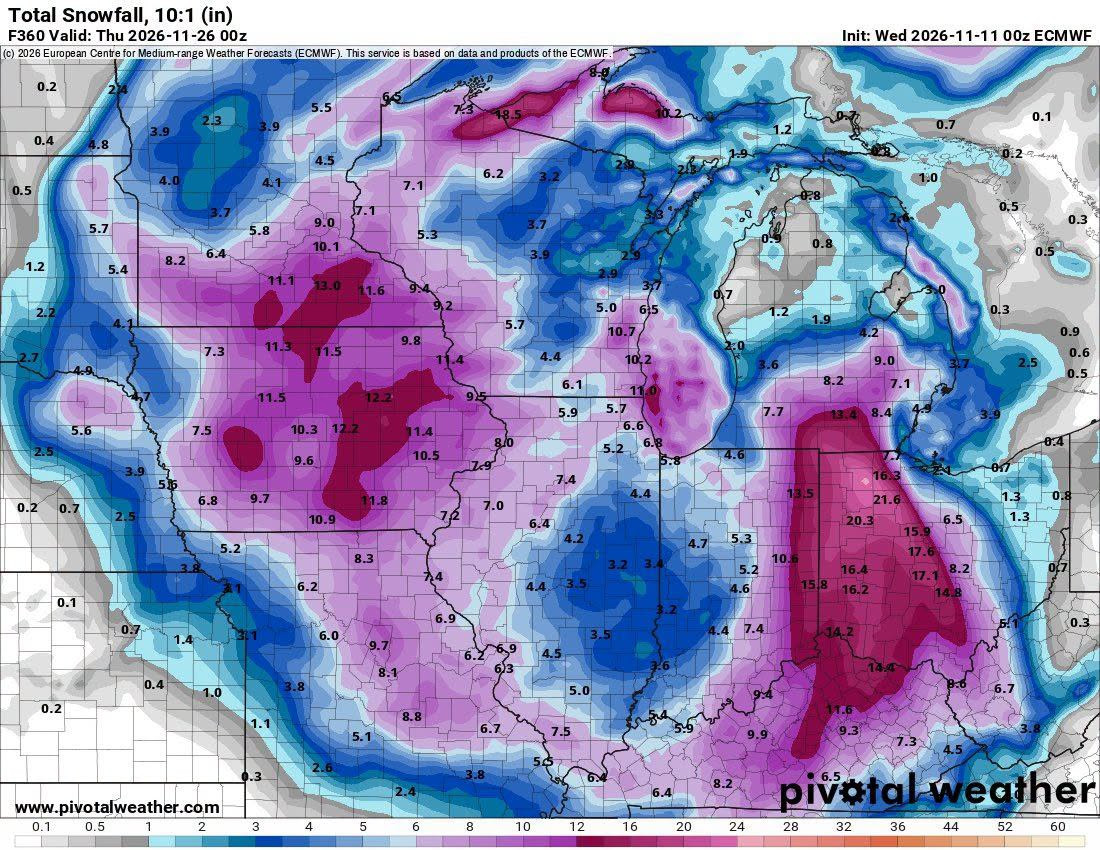
- November 26: The F360 cumulative 10:1 snowfall map paints corridors above 10–20 inches; those are low-confidence model totals at a 15-day lead.
- Observed: NASA recorded nine consecutive date-matched 10-hPa wind minima through November 9; the November 9 reading was +1.22 m/s against a +28.42 m/s historical mean.
- Forecast reversal: NASA GEOS projects negative winds November 10–12; ECMWF and AIFS ensembles each place 50/50 members below zero by November 15.
- Vertical signal: Negative wind anomalies extend from 10 to 100 hPa, but the downward causal chain remains unverified.
- Contrary guidance: NOAA's November 11 week-two outlook favors above-normal Great Lakes temperatures November 19–25.
Research snapshot: 11 November 2026, U.S. Central Time. NASA analyzed through November 9; ECMWF initialization November 11 00Z; NOAA CPC November 11 outlook. Forecast hours are UTC.
NASA · 10 hPa
+1.22 m/s observed November 9; historical mean +28.42 m/s.
ECMWF ENS · 10 hPa
50/50 members forecast at least one wind reversal by November 15.
HRES · 500 hPa
~513-dam closed low over the central U.S. at Nov 24 18Z.
NOAA CPC · WEEK 2
Above-normal Great Lakes temperatures favored Nov 19–25.
01 · MODEL SNAPSHOT
The ECMWF has drawn a remarkable late-November circulation
A European weather-model run initialized at 00Z November 11, 2026 places an unusually deep, closed circulation over the central United States by 18Z November 24. The charts are forecast hour 330, nearly fourteen days after initialization. A related accumulation panel extends to forecast hour 360, 00Z November 26. They are one forecast cycle, not an observed event.
I have been following the Arctic stratospheric circulation since late summer. September showed unusual early organization. October brought displacement and planetary-wave forcing. November has now produced an extreme slowdown in the upper-level Arctic winds. The question is whether the forecasted North American pattern represents the next stage of the same atmospheric reorganization, or simply a coincident tropospheric storm evolution.
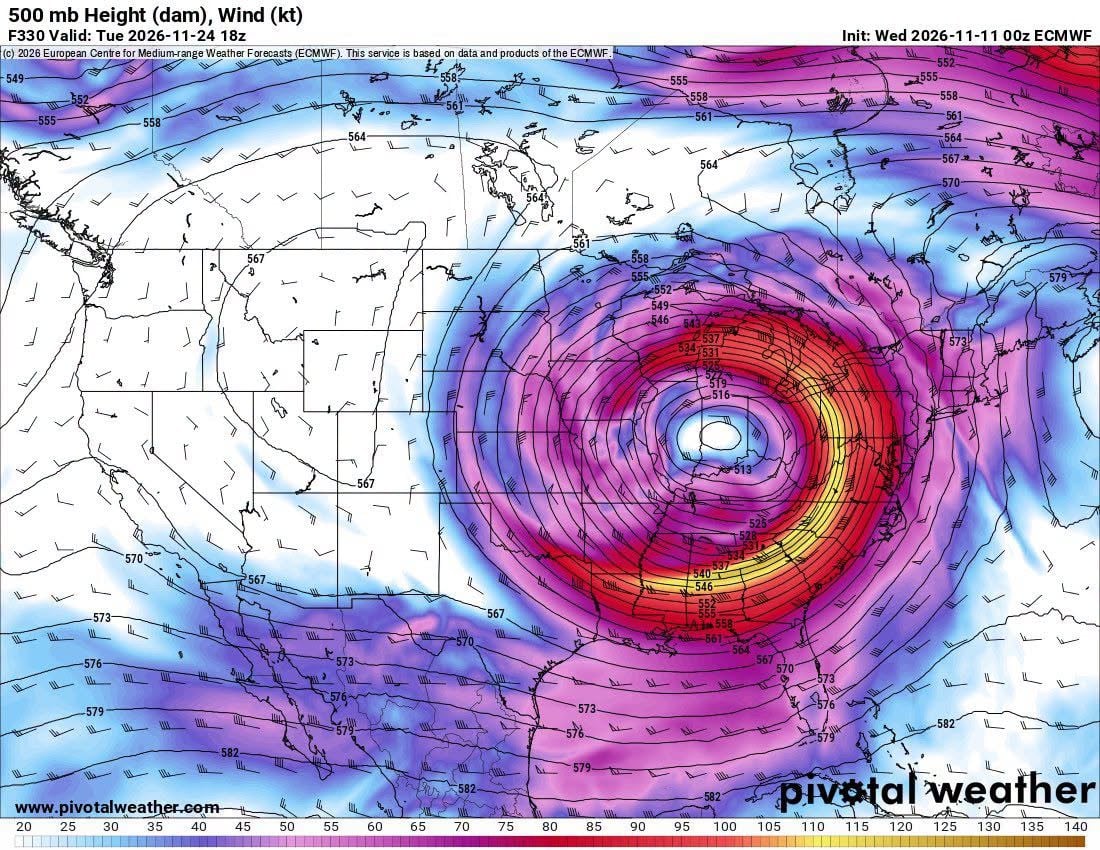
On the 500-hPa map, the core is enclosed by multiple height contours near 513 dam—roughly 5,130 meters of geopotential height at the 500-hPa pressure surface. Winds wrap tightly around the circulation, with a narrow high-speed belt on its eastern and southern flanks. That much curvature and height-gradient concentration over the continental interior is notable in the operational solution.
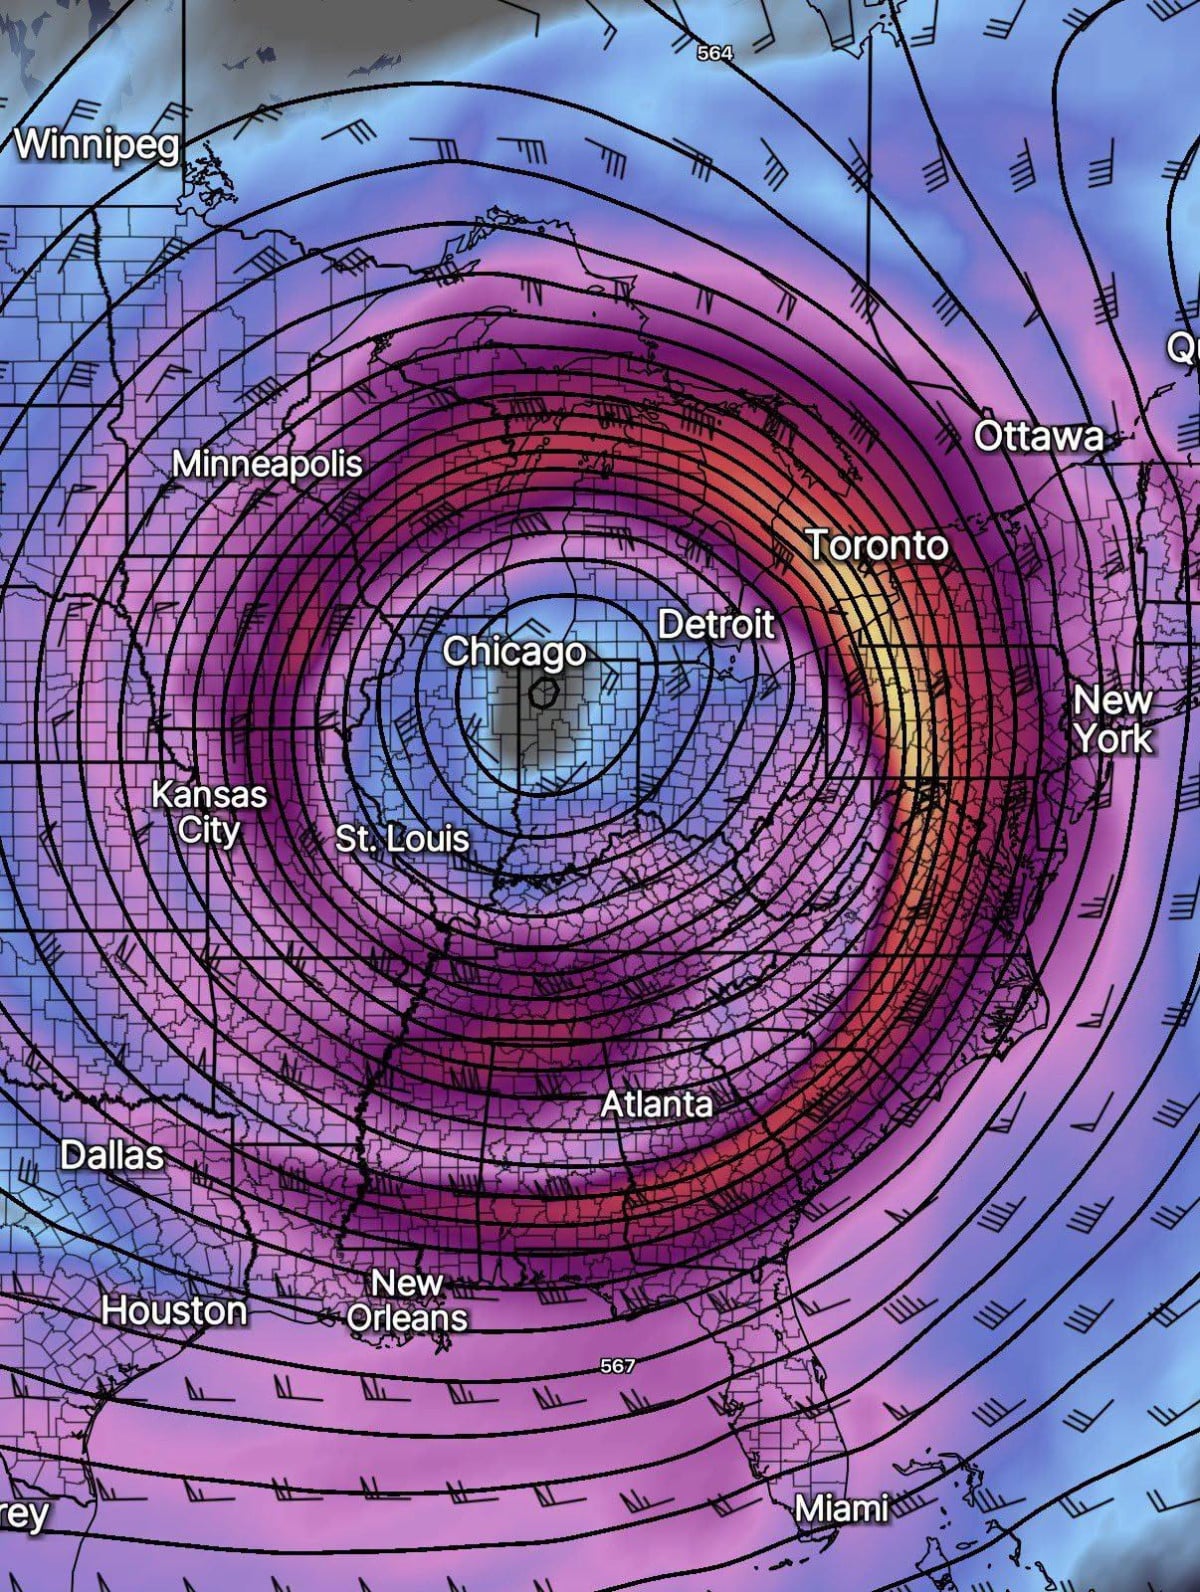
The tight wind field and circular height contours are not a stand-alone snowfall prediction. They describe the mid-tropospheric steering flow. If a circulation like this developed, the placement of its core would govern where cold air wraps into the storm, where ascent and deformation concentrate precipitation, and which corridor receives the most persistent wind and snow. A displacement of even a few hundred kilometers would completely change the regional outcome.
02 · HEIGHT ANOMALY
An exceptionally deep trough alongside a ridge to the north
The anomaly panel makes the broader arrangement clearer. A concentrated negative height departure develops over the central United States while positive height anomalies occupy substantial portions of Canada. The two features form an amplified north–south circulation rather than a relatively flat west-to-east jet.
That matters because regional cold delivery is a geometry problem. A weak polar vortex does not tell us where the cold will travel. The ridge position and downstream trough placement decide where Arctic air is directed, how long it remains in place, and whether individual weather systems reinforce or dislodge it. A Canadian ridge paired with a central-U.S. trough is the sort of configuration capable of opening a cold-delivery corridor into the Midwest.
The projected height anomaly is also not a map of 10-hPa stratospheric winds. It describes weather-layer circulation approximately five to six kilometers above the surface. Any connection to the stratospheric disruption has to be established through the intervening pressure levels and wave dynamics.
03 · THE STORM FIELDS
A deep surface cyclone, wrapping precipitation, and a snow corridor
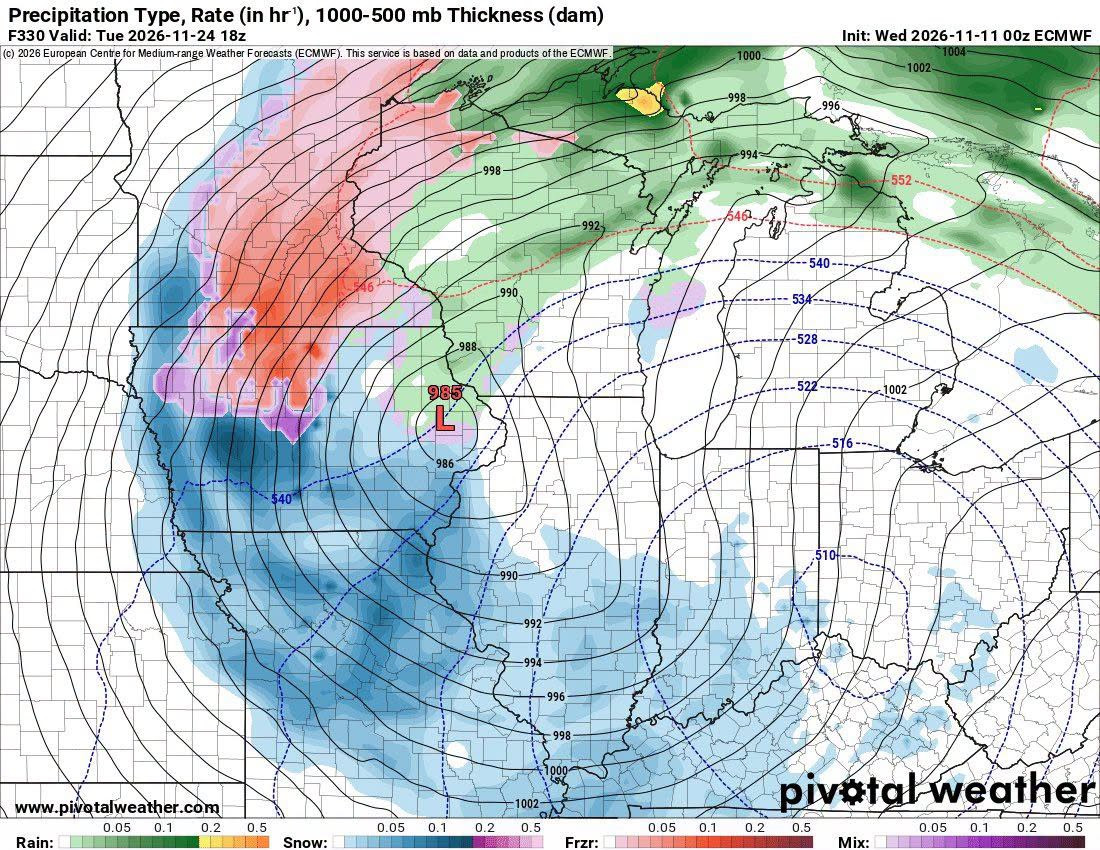
The accompanying ECMWF precipitation panel places a surface low near 985 hPa in the central part of the country. Rain, snow, and mixed precipitation wrap around the circulation in a large comma-shaped pattern. The upper-level low and surface low are not perfectly stacked in the maps, consistent with a developing or mature baroclinic system with vertical tilt.
The model is painting an unusually broad snow shield to the west and south of the upper-level core, while rain and mixed precipitation occupy the warmer sectors. The 1,000–500-hPa thickness lines are a coarse thermal indicator, not a substitute for a full atmospheric temperature profile. The snow-versus-rain transition would depend on the depth of cold air, wet-bulb temperature and the precise track.
The snowfall field is the attention-grabbing part of this run. It contains corridors of 10–20+ inches across parts of the Midwest and nearby states, with localized model values above twenty inches in the eastern part of the footprint. Those numbers are neither an official snowfall forecast nor a credible location-specific prediction two weeks in advance. The accumulated field combines every snow-producing episode through November 26 and assumes a fixed 10:1 snow-to-liquid ratio.
Operational interpretation: The circulation is a legitimate model solution with meaningful large-scale dynamics. The storm track, precipitation type and snowfall maxima are lower-confidence details that can shift dramatically between model cycles. Treat the maps as a high-impact scenario requiring ensemble support, not a forecast of a specific city receiving a specific depth of snow.
04 · THE WIND DATA
NASA has measured nine consecutive same-date Arctic wind minima
The part of this analysis supported by observations is even more unusual. At 60°N and 10 hPa, NASA tracks the zonal-mean zonal wind: an east–west average around the entire latitude circle at approximately 30 kilometers altitude. Positive values represent westerly flow; negative values indicate easterly flow. This is one of the main indices used to diagnose major stratospheric vortex disturbances.
From November 1 through November 9, the 2026 daily analyzed values were below the previous historical minimum for each calendar date in NASA's 1978/79–2025/26 comparison. The November 9 analyzed wind was +1.22 m/s, compared with a historical mean of +28.42 m/s and a previous same-date minimum of +12.45 m/s. That is a −27.20 m/s departure from the historical mean, and 11.23 m/s below the preceding date-matched minimum.
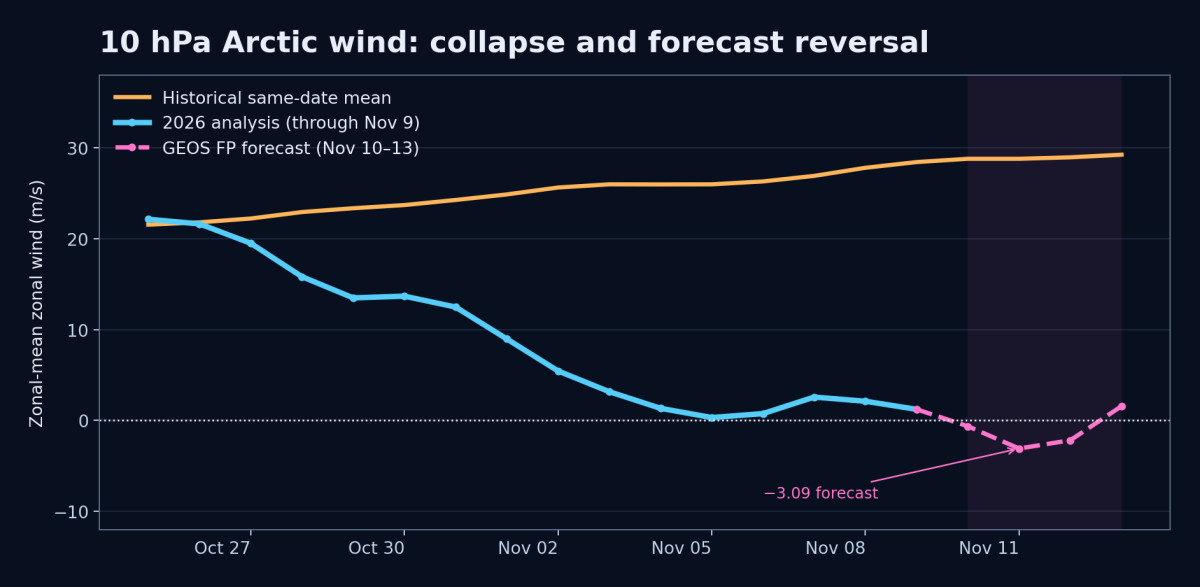
The same NASA file projects −0.64 m/s on November 10, −3.09 m/s on November 11 and −2.18 m/s on November 12 before returning positive on November 13. Those rows are labeled forecast leads, not analyzed observations. Calling this a confirmed major sudden stratospheric warming before the actual daily analyzed reversal would misstate the evidence.
The transition is striking because the climatological mean on November 11 is still about +28.78 m/s. We are not observing a small fluctuation around an expected seasonal weakening. A circulation that normally strengthens through this time of year has essentially stalled in the index and is forecast to cross zero.
05 · TEMPERATURE
The polar stratosphere is warming as the winds collapse
The wind record is only one diagnostic. NASA's 60°–90°N temperature series shows the polar cap at 217.52 K on November 9, compared with a historical mean of 208.25 K and a previous same-date maximum of 213.31 K. The temperature anomaly is about +9.27 K. The day before, the temperature reached 218.02 K, itself more than nine kelvin above the date-matched mean.
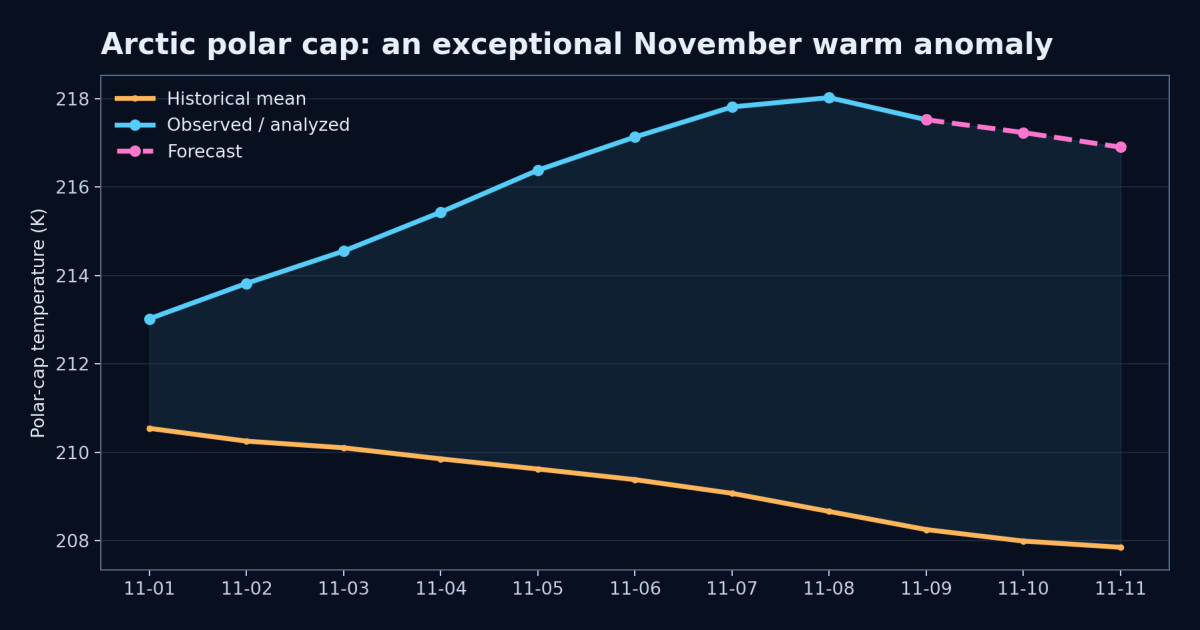
An anomalously warm polar cap and collapsing west-to-east winds together form the classic fingerprint of a disturbed stratospheric vortex. Planetary-scale waves can displace and distort the vortex, change the circulation and produce warming through dynamical compression. What happens at the surface is still a separate question, but the upper-atmospheric disturbance is not speculative.
06 · THE WAVE PULSE
The wave forcing arrived before the weakest winds
Our earlier Pattern Nexus work identified a strong burst of eddy heat flux at 100 hPa during the end of October. The 45°–75°N heat-flux series exceeded its earlier same-date maxima for six consecutive days, October 29 through November 3. That wave-activity pulse preceded the deepest wind collapse in the opening days of November.
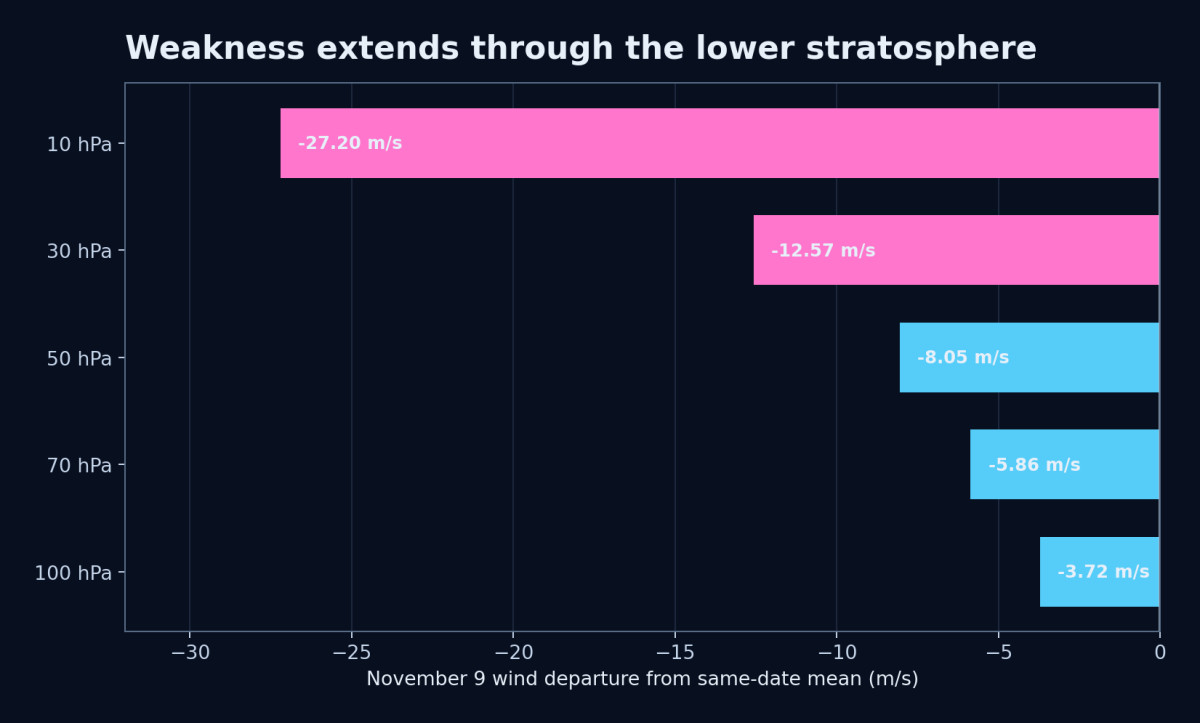
Eddy heat flux is a standard proxy for the upward transport of wave activity into the stratosphere. Mountains, land–sea thermal contrasts, transient weather patterns and high-latitude blocking all can generate the long planetary waves that perturb the vortex. A strong tropospheric wave pulse can therefore precede and partly drive a stratospheric warming. This is essential when testing causation: a tropospheric pattern may help disturb the stratosphere, and the changed stratosphere may later feed back into tropospheric circulation.
That is the coupling question we have been pursuing. We cannot establish which direction dominates just by matching a storm date to a reversal date. We need time–height maps and lagged wave-activity measurements that show how information and momentum move between layers.
07 · THE VERTICAL PROFILE
The weakness now reaches several stratospheric levels
NASA's November 9 analyzed winds are below normal not only at 10 hPa but also at 30, 50, 70 and 100 hPa. The departure declines with depth, which is exactly the kind of vertical gradient that needs to be tracked during a disturbance.
| Level | 2026 analyzed | Historical mean | Departure |
|---|---|---|---|
| 10 hPa | +1.22 m/s | +28.42 m/s | −27.20 m/s |
| 30 hPa | +5.59 | +18.16 | −12.57 |
| 50 hPa | +7.13 | +15.18 | −8.05 |
| 70 hPa | +8.14 | +14.00 | −5.86 |
| 100 hPa | +9.70 | +13.42 | −3.72 |
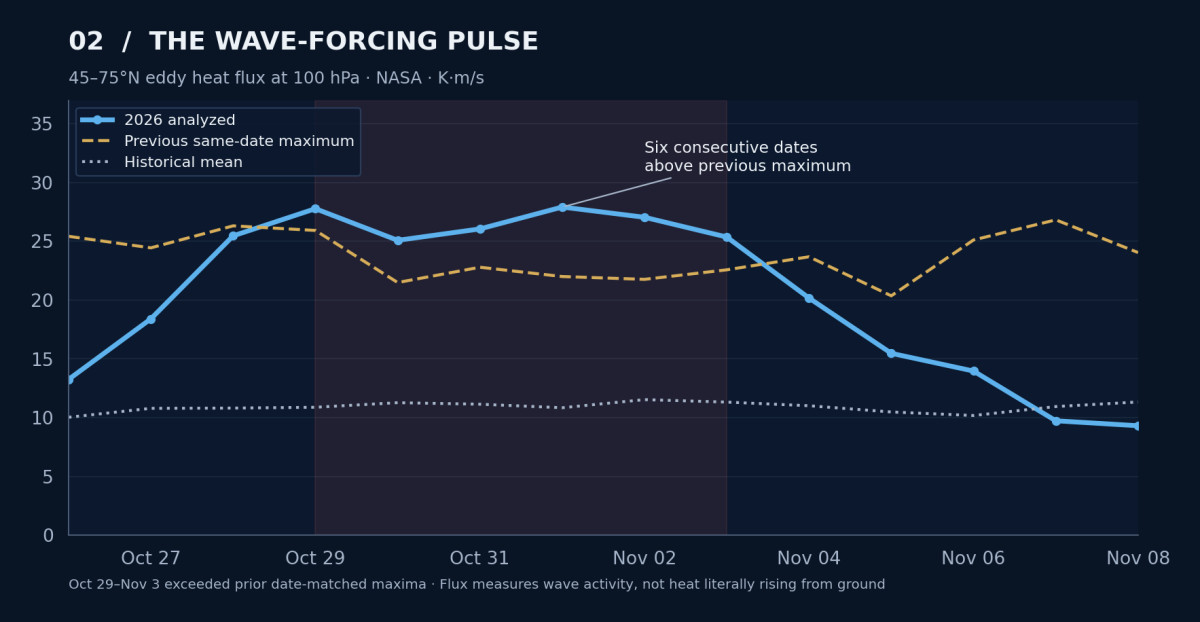
At 10 hPa, the reading is 11.23 m/s below the previous same-date minimum; at 30 hPa it is 4.21 m/s below, and at 50 hPa it is 1.36 m/s below. At 70 and 100 hPa, the deficit is smaller and the winds remain westerly. The data establish a vertically extensive stratospheric disturbance, not a completed descent of the entire anomaly into surface weather.
The next meaningful check is whether the anomalies deepen at 70–100 hPa and appear in lower-atmosphere geopotential-height and wave diagnostics. That would move the argument from a temporal correlation toward a physically traceable mechanism.
08 · ENSEMBLE EVIDENCE
The vortex reversal is far more strongly supported than the Midwest storm
Independent of the long-range surface maps, the November 11 00Z ECMWF ensemble contains 50 of 50 members predicting a 60°N, 10-hPa wind reversal by November 15. Its AI ensemble, AIFS ENS, also has 50 of 50 members reversing by that date. The historical comparison on the monitoring site shows no equivalent by that date in its 1991–2020 reference period. These are exceptionally coherent model signals for the stratospheric index.
Those figures are raw member fractions, not calibrated certainty, and they are measuring wind reversal—not a blizzard, not a Chicago temperature, and not whether the November 24 ECMWF operational cyclone will happen. Ensemble unanimity on the large-scale stratospheric transition cannot be transferred to a particular precipitation map two weeks later.
| Question | Evidence on November 11 | Assessment |
|---|---|---|
| Is the polar vortex unusually weak? | NASA daily analyzed winds and warm polar cap | Directly observed |
| Will 10-hPa zonal winds reverse? | NASA forecast crosses zero; ECMWF ENS and AIFS ENS 50/50 by Nov 15 | Strong model agreement, pending daily analysis |
| Will a deep Midwest cutoff form on Nov 24? | One ECMWF operational HRES solution shown | Scenario, not consensus |
| Will 10–20+ inches of snow fall at any specific location? | One F360 cumulative 10:1 snowfall field | Low-confidence regional detail |
Model hierarchy: A daily analyzed value verifies what the atmosphere has done. An ensemble forecasts what many plausible future solutions might do. An operational deterministic run supplies one detailed realization. Mixing those levels produces false certainty; separating them allows us to evaluate the genuine signal.
09 · THE COUPLING WINDOW
Why the approximately two-week separation deserves attention
There is a legitimate physical reason to examine the interval between an early-November stratospheric disturbance and a late-November North American weather pattern. In a 2026 Geophysical Research Letters paper, Katherine Barragan and Cristiana Stan examined cold-air outbreaks along the eastern United States and identified a subset—approximately 16%—associated with stratosphere–troposphere coupling through wave dynamics.
Their analysis describes distorted vortex configurations roughly 10–15 days before certain cold-air outbreaks. Downward-propagating planetary-wave signatures interact with the mid-tropospheric jet stream, contributing to amplified troughs favorable for cold delivery. The paper demonstrates a plausible subseasonal pathway; it does not prove that every late-November trough following a stratospheric disruption must be caused by it.
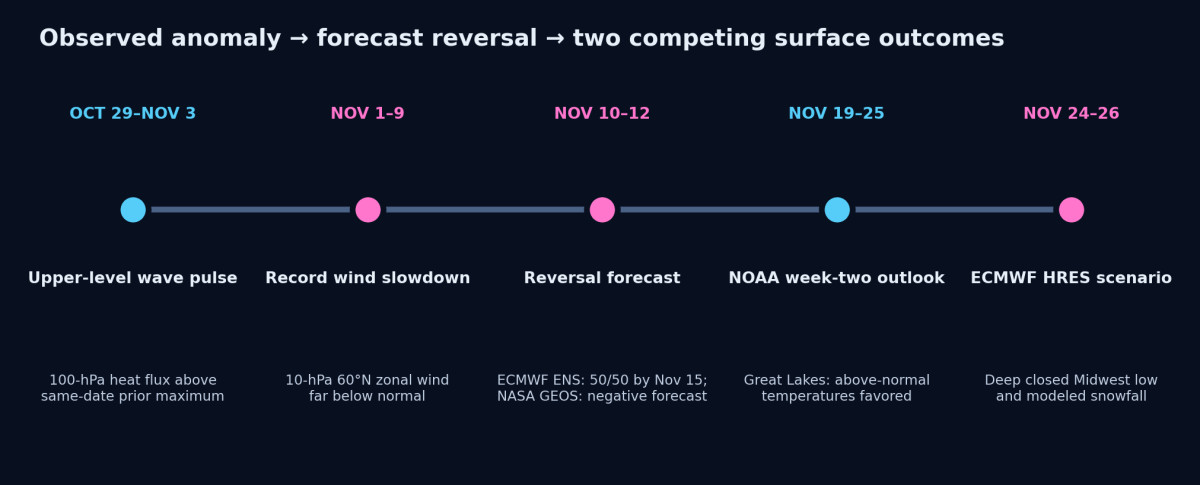
The timing in these charts is close to that research window: a strong wave pulse around October 29–November 3, an extreme weakening in early November, a forecast 10-hPa reversal around November 10–12, and a dramatic operational 500-hPa pattern approximately thirteen days later. That temporal alignment makes this a valuable test case. On its own, it is not evidence that the November 24 storm exists, or that the vortex caused it.
The actual attribution requires time–height pressure and wind anomalies; 100-hPa and upper-tropospheric wave-activity flux; vortex potential-vorticity geometry; and downstream jet changes. We would then look for the signature progressing toward the weather layer in the correct sequence. If the midlatitude trough leads the stratospheric signal instead, the interpretation changes.
10 · THE MODEL DISAGREEMENT
NOAA is still favoring a warmer Great Lakes period
Now compare that dramatic deterministic ECMWF run with NOAA's November 11 Climate Prediction Center forecast. For November 19–25, the official 8–14-day outlook favors above-normal temperatures across the Great Lakes, with probabilities above 60% for the warm category in portions of the region. Its ensemble-weighted 500-hPa height blend favors generally above-normal heights over much of the eastern United States. The discussion assigns 4 out of 5 confidence to the week-two forecast.
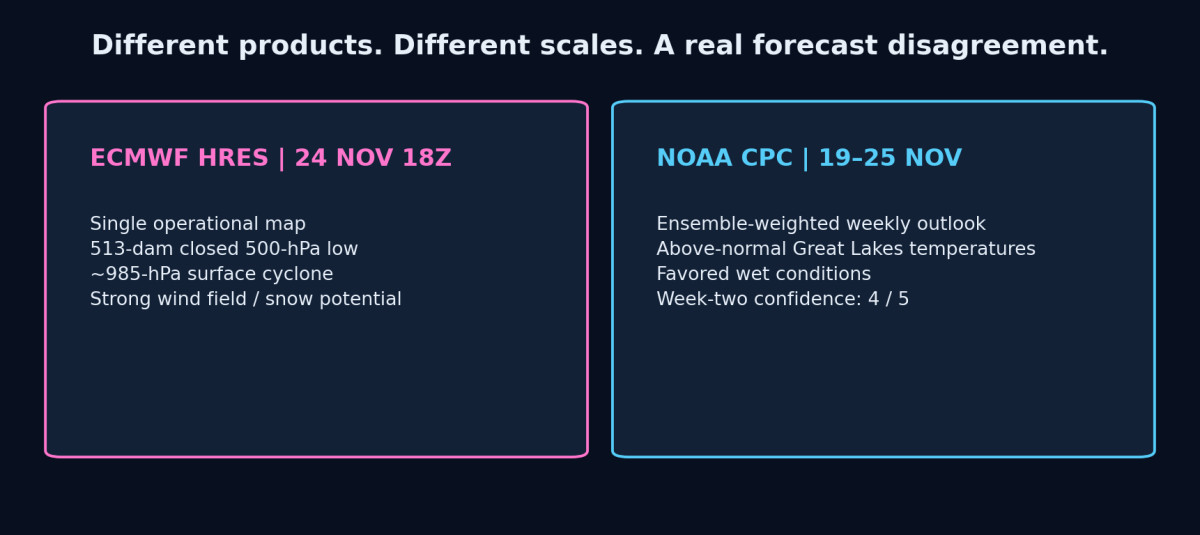
This is a substantive disagreement, but the products are not identical. A single intense storm late in a week can occur within a generally warm week. Conversely, a forecast mean of high heights over the Great Lakes tends to argue against the prolonged, deeply negative height pattern shown in the most extreme operational realization. We need the ECMWF ensemble member spread for the specific 500-hPa trough and cyclone before assigning it a regional probability.
NOAA also favors above-normal precipitation over much of the central United States in this period. That adds support for an active weather pattern, but it does not decide whether the precipitation arrives as rain or snow. The thermodynamic profile and track remain open questions.
Current conflict: Ensemble unanimity on a stratospheric wind reversal is not ensemble unanimity on a Midwest winter storm. As of the November 11 forecast cycle, the storm geometry is substantially more uncertain than the upper-level vortex disruption.
11 · REGIONAL CONSEQUENCES
What would have to line up for a major Midwest winter event
If the strong upper low survives successive forecast cycles, the most consequential changes would be its location and the placement of the low-level thermal boundary. A cutoff closing over Illinois, Missouri or eastern Iowa can place different states under the strongest deformation-band snowfall. A northwest shift can pull milder air into the Great Lakes; a southeast shift can move the heaviest snow into the Ohio Valley or Appalachian region.
A low around 985 hPa may produce strong pressure gradients, but surface winds cannot be read directly from the 500-hPa shading. Upper-level winds on the ECMWF panels approach a very strong jet band, while local surface gusts would depend on vertical mixing, frontogenesis, stability, cyclone depth and terrain. The same vertical structure governs where precipitation is heavy and which places stay warm enough for rain.
Lake effects could amplify or suppress local snowfall around Lakes Michigan, Huron, Erie and Ontario, depending on the wind direction, lake–air thermal contrast and surface stability. But nothing in the single 15-day accumulation graphic can tell us that a particular lake-shore community will receive its plotted total.
The appropriate geographic view is a risk corridor, not a deterministic impact zone: from the central Plains through the Upper Midwest, Great Lakes and Ohio Valley, with placement contingent on subsequent runs. The eastern and southern sides of the circulation could see very different precipitation and temperature outcomes.
12 · WHAT SETTLES IT
The next observations and model runs can separate signal from noise
For the stratospheric transition, the first milestone is straightforward: NASA's next analyzed 60°N/10-hPa daily value must actually cross below zero. We then measure how long the easterly flow persists, whether the polar cap remains anomalously warm and whether the response strengthens farther down at 30, 50, 70 and 100 hPa.
For the Midwest forecast, successive 00Z and 12Z ECMWF operational runs need to retain a similar upper-level height anomaly, while the ensemble mean and member distribution begin clustering around a related solution. If the operational closed low disappears or shifts widely among successive cycles, the exact snowfall map loses predictive value even if the hemisphere-scale pattern remains active.
| Diagnostic | Confirmation would look like | Weakening / invalidation would look like |
|---|---|---|
| NASA 10-hPa analyzed winds | Analyzed negative zonal mean at 60°N | Forecast reversal disappears or is not observed |
| Lower-stratospheric anomalies | 30–100-hPa evolution consistent with coupling | Upper anomaly stays isolated or quickly rebounds |
| 500-hPa ensemble spread | More members form a comparable central-U.S. trough | One-off operational low with dispersed ensemble outcomes |
| Blocking and jet structure | Persistent Canadian ridge and downstream trough | Ridge shifts / jet returns to flatter flow |
| Surface cyclone and precipitation | Ensemble clustering in track, thermal profile and QPF | Low track, temperature and snow footprint remain unstable |
This is not a binary prediction that either the exact ECMWF image appears or nothing happened. The more useful question is whether the verified vortex disturbance systematically changes the odds of blocking, trough amplification and cold-air delivery compared with the prior forecast and seasonal baseline.
13 · SCENARIO FRAMEWORK
Three plausible paths through the end of November
Scenario A — Strong vortex disruption, limited Midwest winter response. The 10-hPa winds reverse as forecast, but the lower-stratospheric influence weakens, the upper-level jet reconfigures differently, or the most pronounced cold anomaly ends up outside the central United States. NOAA's broadly warmer Great Lakes outlook is more consistent with this path.
Scenario B — Amplified trough, substantial but shifting storm. The circulation develops a significant central-U.S. trough and one or more organized cyclones, but the exact ECMWF closed-low geometry and snowfall maxima fail to persist. This remains a meaningful late-November weather risk without requiring the extreme November 24 operational depiction to verify.
Scenario C — Persistent blocking, deep Midwest cutoff and major snowfall. The Canadian ridge and central-U.S. negative height anomaly become entrenched; a deep surface cyclone forms in favorable thermal conditions; prolonged ascent and deformation generate heavy snow in a defined corridor. This is the high-impact case represented by your supplied operational charts, not the established base case.
At this lead time, I am not assigning numerical probabilities to these regional scenarios. We do not have the necessary temperature and cyclone-track ensemble distribution for the November 24–26 window. The probabilities available for the stratospheric wind index are answering a different question.
14 · FREQUENTLY ASKED QUESTIONS
Frequently asked questions
Are the ECMWF charts showing real weather occurring now?
No. They are forecast projections from the November 11 00Z model cycle, valid November 24–26. The NASA wind and temperature observations through November 9 describe conditions already measured.
Does every polar-vortex wind reversal lead to a major U.S. snowstorm?
No. It can change the likelihood and geography of blocking and cold delivery over subsequent weeks. The location and intensity of individual cyclones depend on the lower-atmospheric pattern.
How unusual is the November stratospheric event?
The NASA 60°N 10-hPa wind index set nine consecutive date-matched record lows through November 9, while polar-cap temperature exceeded the previous same-date maximum. ECMWF ensembles forecast an exceptionally early wind reversal; the reversal must still be verified in analyzed data.
Is a two-week separation enough to prove downward coupling?
No. It matches a documented physical lag for a subset of cold outbreaks, but a causal test requires wave-flux, wind and height anomalies through the vertical atmospheric column and careful control of the tropospheric precursor waves.
Are the snowfall amounts official predictions?
No. The map is one 10:1 snowfall accumulation output through forecast hour 360. Specific totals can change with low track, temperature structure, moisture, melting and subsequent snowfall episodes.
15 · PATTERN NEXUS LENS
The upper-atmosphere signal is confirmed. The next test is geographic.
The central research result is already measurable. The Arctic stratospheric circulation did not behave normally during its autumn buildup. It moved from unusual early-season strength toward an extraordinary wind collapse as the polar cap warmed and wave forcing intensified. The current data extend that anomaly through several stratospheric pressure levels, and the major forecasting systems now align on an early 10-hPa reversal.
The new ECMWF maps introduce a possible weather-layer expression of the disturbance: an amplified blocking-and-trough configuration over North America, a remarkably deep Midwest upper low and a large winter precipitation footprint near November 24–26. The forecast is worth tracking because it arrives within the documented coupling window and its spatial structure resembles a cold-delivery setup. It is not yet evidence of one-way causation.
What makes this research useful is that the earlier observations, mechanisms and dates are already on record. We do not have to invent an explanation after a storm occurs. We can test the actual sequence: wave activity, stratospheric wind collapse, downward evolution, jet reorganization, blocking, cold delivery and observed weather. The weaker model paths are part of the test, too.
Pattern Nexus assessment · November 11, 2026: Nine date-matched wind minima and extraordinary polar-cap warming are observed. An imminent 10-hPa reversal is strongly forecast. The November 24–26 Midwest storm is an extreme, geographically specific ECMWF operational scenario in tension with NOAA's ensemble-weighted outlook. Its eventual accuracy—and its connection to the stratosphere—remain to be determined.
SOURCES & DATA
Source material, methodology and research continuity
NASA daily 2026 data are GEOS FP for dates beginning August 1, compared with the MERRA-2 climatological distribution from winter 1978/79 through 2025/26. Rows with Fcst=0 are analyzed; rows with positive Fcst are forecasts. The ECMWF maps analyzed here are the 2026-11-11 00Z initialization and are reproduced without changing the forecast values; both 330-hour and 360-hour products are used.
Primary measurements and model guidance
- NASA Ozone Watch — Arctic zonal mean wind, 60°N at 10 hPa (2026)
- NASA — polar-cap temperature, 60–90°N at 10 hPa (2026)
- NASA — 100-hPa 45–75°N eddy heat flux
- NASA — 60°N zonal wind, 30 hPa
- NASA — 60°N zonal wind, 50 hPa
- NASA — 60°N zonal wind, 70 hPa
- NASA — 60°N zonal wind, 100 hPa
- ECMWF & AIFS ensemble — November 11 vortex-reversal probabilities
- ECMWF ensemble method and reversal dates
- NOAA CPC — November 11 6–10 and 8–14 day forecast discussion
- NOAA CPC — 8–14 day forecast maps
- Barragan & Stan (2026), Stratosphere–Troposphere Coupling During Cold Air Outbreaks
- NOAA Climate.gov — Understanding the Arctic polar vortex
- Pivotal Weather — ECMWF chart service; original graphics supplied for the November 11 forecast cycle
Earlier dated Pattern Nexus reports
- Pattern Nexus — November 10, 2026: The Polar Vortex Is Breaking Down
- Pattern Nexus — October 29: The Polar Vortex Is Stretching
- Pattern Nexus — November 1: Record Wind, Reversal, Wave Two, Cold Delivery
- Pattern Nexus — October 22: Winter Polar Vortex, El Niño, QBO and Regression
- Pattern Nexus — September 1: Early Organization Signal
Forecast provenance: Pivotal Weather/ECMWF charts provided with this report. Weather-model imagery is forecast information, not actual satellite imagery or a current event observation. The generated title graphic is conceptual illustration; only the Pivotal Weather and NASA figures carry numerical model or measurement values.
Article overview
Nine consecutive date-matched Arctic wind records, a forecast 10-hPa reversal, and ECMWF maps depicting an extraordinary late-November Midwest upper low. Pattern Nexus compares the NASA observations, operational storm scenario, ensemble evidence, and NOAA's competing outlook.
מה התגובה שלך?
 אהבתי
0
 לא אוהב
0
 אהבה
0
 מצחיק
0
 וואו
0
 עצוב
0
 כועס
0

Nexus (Christopher)
Founder of Pattern Nexus. I research markets, macro, geopolitics, AI, history, ancient systems, and the patterns most people overlook. I’m also building Market Radar, a trading scanner designed to read pressure, risk, confirmation, and setup quality before ch…
Related research
Polar Vortex Watch 2026–27: The Sun Quieted, the Vortex Hit a Record — Now the Real Test Begins
The early-season Arctic vortex has now crossed from unusual into a verified date-matched record at 10 hPa. At the same time, NOAA reports v…
5 shared topics.
The Polar Vortex Is Stretching: A Historic November Forecast, and the Cold Outbreak That Hasn't Happened
polar vortex, November 2026, Arctic polar vortex, sudden stratospheric warming, NASA Ozone Watch, ECMWF, vortex collapse, planetary waves, …
4 shared topics.
The Polar Vortex Is Breaking Down in November — What the Actual Data Show
Eight consecutive record-low Arctic wind days, an exceptionally warm polar stratosphere and an early-November reversal forecast. What the m…
3 shared topics, same research avenue.
The Polar Vortex Test: Winter 2026–27, El Niño, the QBO and the Limits of Prediction
Five record-setting September polar-vortex wind days, an October shift below normal and a potentially historic El Niño set the stage for No…
3 shared topics.
Polar Vortex Watch 2026–27: Early Arctic Organization Is Now Pressing Historical Extremes
What started as an unusual late-August structural signal is becoming something much harder to dismiss. The 10-hPa Arctic winds have moved a…
3 shared topics.
The ISS Is Leaking Again: Aging Hardware, Russian Segment Cracks, and the Closing Window Before Commercial Space Stations
The International Space Station air leak is not just a scary headline about astronauts in danger. It is a systems warning. The leak sits in…
3 shared topics.
Polar Vortex Now: Stratospheric Deformation, NatGas Risk, and the ERCOT Night-Ramp Stress Test
A unified live update tying today’s polar vortex structure (10 hPa), surface cold delivery, and ERCOT’s real-time constraints into the NatG…
3 shared topics.
Polar Vortex Watch, Part II: Early-Season 10 hPa Deformation and the Nat Gas Risk Trade
An unusually early 10 hPa polar-vortex deformation is unfolding over the Arctic, raising the odds of late-December cold across North Americ…
3 shared topics.
תגובות (0)
Security Check
Please complete the captcha to verify you are human.