

The Polar Vortex Is Approaching a November Record: From September Extremes to an Early Reversal Forecast
Five September wind records have given way to an exceptionally weak Arctic circulation. PN checks 47 NASA autumns, the 1952 and 1968 warming benchmarks, ECMWF model disagreement, and the separate tes…
Jump to a section
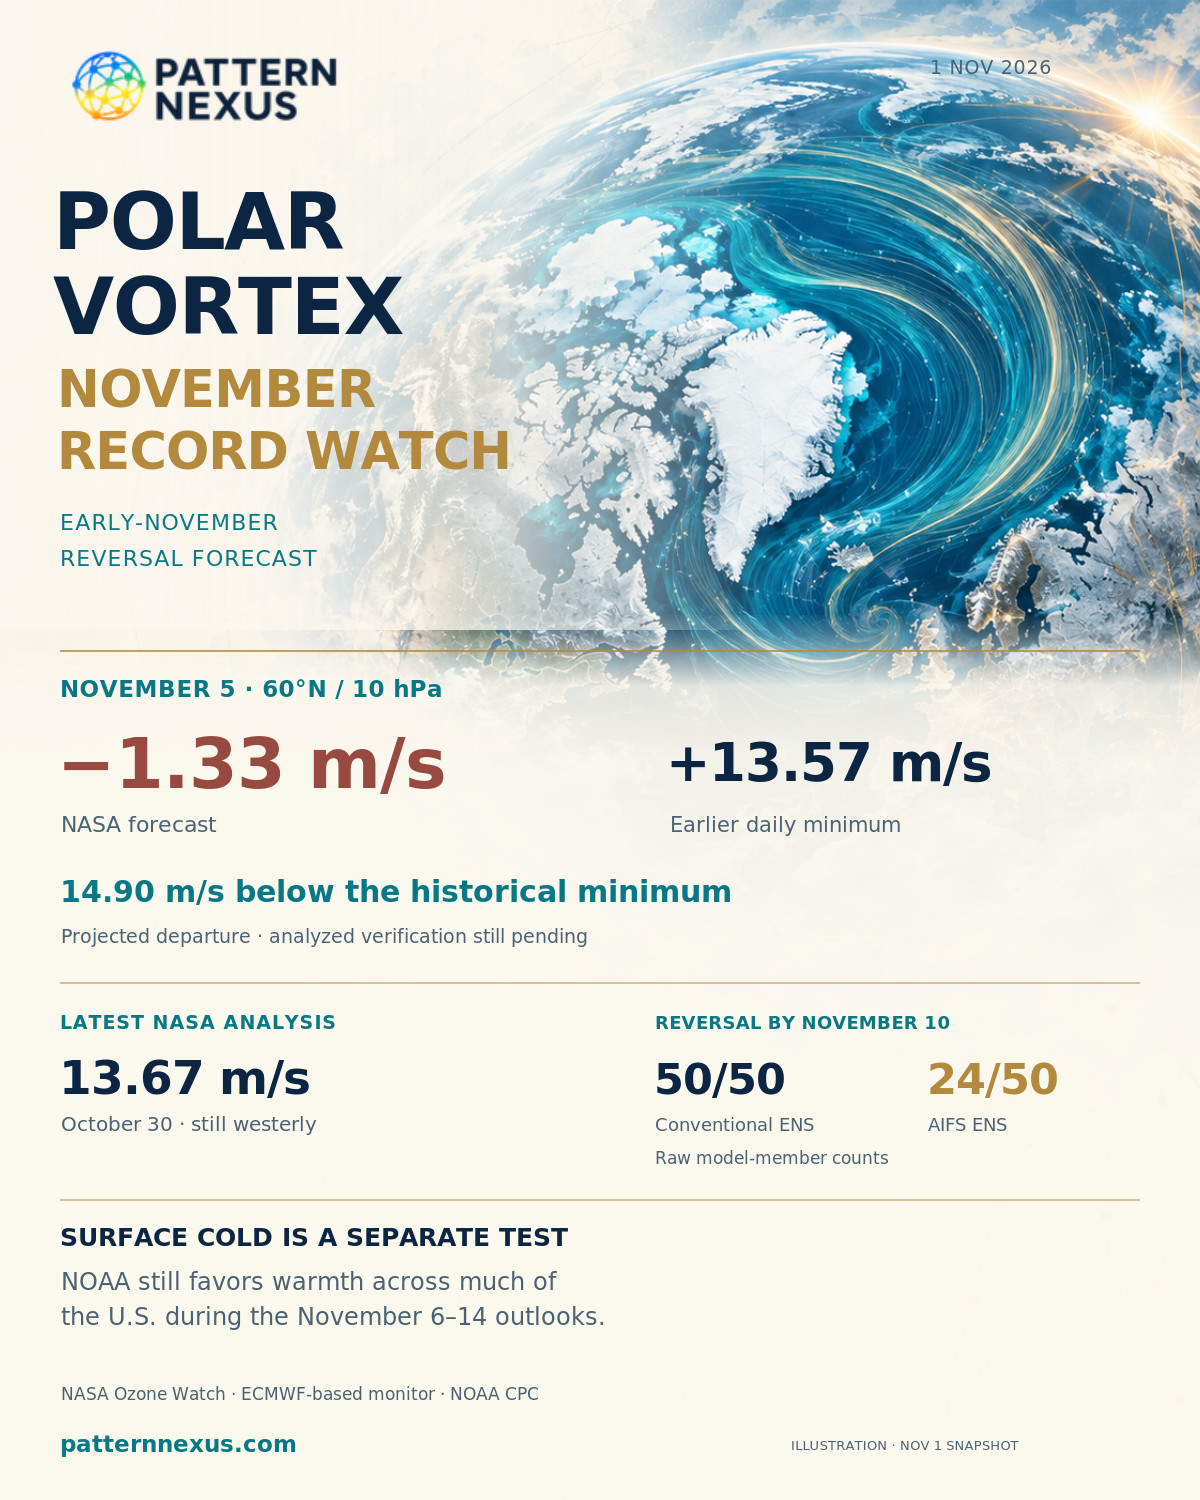
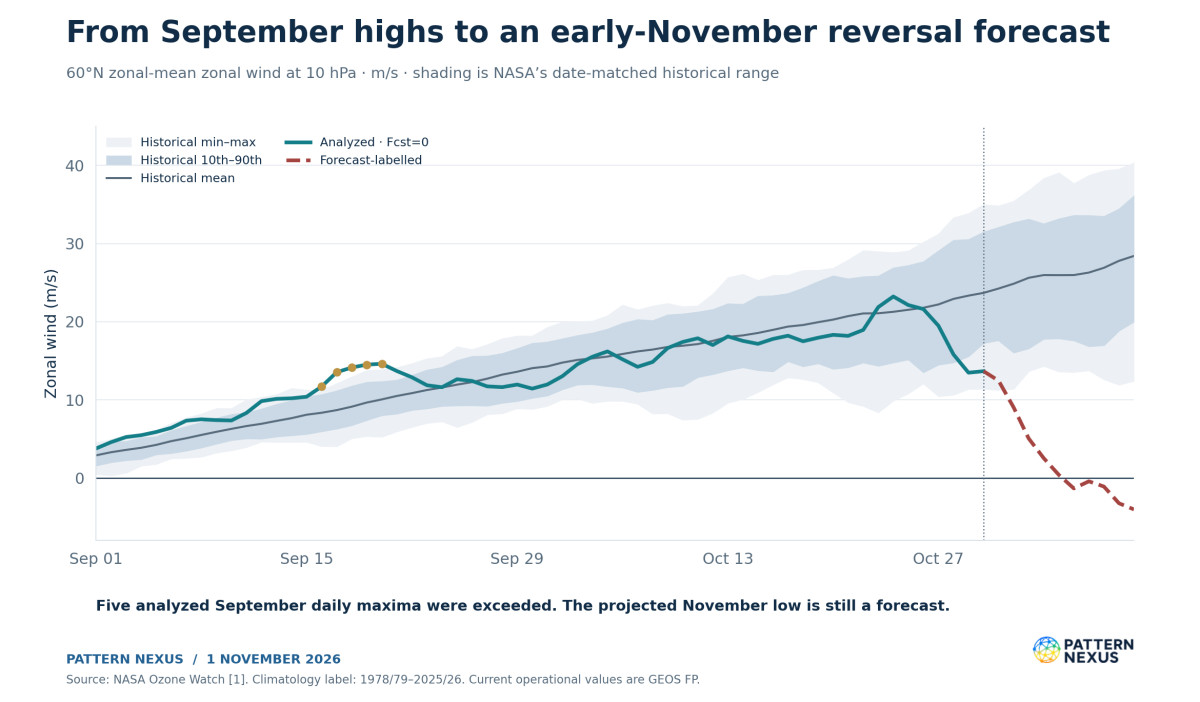
The polar vortex is approaching a November threshold that deserves a full historical comparison. NASA’s published wind forecast crosses from westerly to easterly on November 5. At −1.33 m/s, that forecast sits 14.90 m/s below the earlier historical minimum for November 5. The conventional ECMWF ensemble also strongly supports a reversal, although its AI ensemble is slower and less unanimous. [1,4]
The latest NASA analyzed wind is still positive: 13.67 m/s on October 30, versus a historical mean of 23.69 m/s. That is 42.3% below the mean, but above the historical minimum. The analyzed series has not established the projected November record. [1]
I rechecked the seasonal sequence against 47 valid NASA autumns. All five September 16–20 high-wind exceedances hold. None of those historical NASA autumns contains a negative November daily wind. The current watch has moved from exceptional early-season strengthening into exceptional weakening relative to the seasonal calendar. [1,12]
There are two relevant early-warming benchmarks. The ERA5-based catalogue beginning in 1959 lists November 28 as its earliest onset. A longer ERA5 study, published in March 2026 and extending back to 1940, includes November 19, 1952. An early-November reversal would precede both. Event classification, the date, and the data product still have to verify. NOAA’s near-term outlook continues to favor warmth across much of the United States. [5,6,10,18]
13.67 m/s on October 30. Weak for the date, still westerly.
November 5 is forecast 14.90 m/s below the earlier daily minimum.
Compare both November 19, 1952 and the post-1959 November 28 benchmark.
A wind reversal, vortex split, and regional cold outbreak require separate verification.
01 · POLAR VORTEX RESEARCH
The seasonal anomaly has changed faster than the raw wind suggests
The atmosphere normally builds stronger Arctic stratospheric westerlies through autumn as the polar region loses sunlight and cools. A wind value that is exceptional in September can be weak by late October. That seasonal background is essential to understanding the sequence now unfolding.
On September 20, NASA analyzed the 60°N, 10-hPa wind at 14.62 m/s. Its date-matched historical mean was 10.06 m/s, giving a positive anomaly of 4.56 m/s. On October 30, the analyzed wind was 13.67 m/s against a mean of 23.69 m/s, producing an anomaly of −10.02 m/s. The actual wind declined only 0.95 m/s between those two dates. Its departure from the seasonal mean deteriorated by 14.58 m/s. [1]
That calculation explains how an early strong-vortex watch can develop into a weak-vortex watch without requiring the raw wind to collapse continuously from September onward. The historical circulation was expected to strengthen substantially. The current circulation failed to keep pace, then experienced a sharper late-October deceleration.
The shorter interval is more dramatic. October 24 analyzed at 23.23 m/s, 1.96 m/s above the historical mean. By October 30, the actual wind had fallen 9.56 m/s, or 41.2%, while the historical mean had risen 2.42 m/s. The anomaly therefore declined 11.98 m/s in six days. These are PN calculations from the dated NASA rows. They describe a rapid change in the circulation relative to its expected seasonal development. [1]
The September research began with the vortex’s organization and geometry. Those questions remain separate from wind strength. A nearly circular circulation can be strong or weak; a rapidly flowing circulation can still be displaced or distorted. The present update follows strength, shape, temperature, wave activity, and the vertical structure together. The record question belongs inside that wider circulation analysis. [13,14]
02 · POLAR VORTEX RESEARCH
The latest analyzed wind is weak, with a small daily recovery
NASA’s newest analyzed daily value in the retrieved file is October 30. The calendar has moved into November, but the rows marked as forecasts have not become observations merely because their valid dates are approaching. The product’s forecast flag remains the controlling field for this update. [1]
| October 30, 2026 · 60°N, 10 hPa | Wind or comparison |
|---|---|
| Analyzed wind · Fcst=0 | 13.67 m/s |
| October 29 analyzed wind | 13.48 m/s |
| Daily change | +0.19 m/s |
| Historical minimum | 11.43 m/s |
| Historical 10th percentile | 17.29 m/s |
| Historical mean | 23.69 m/s |
| Historical 90th percentile | 31.46 m/s |
| Historical maximum | 34.97 m/s |
| Departure from mean | −10.02 m/s |
| Distance above historical minimum | +2.24 m/s |
| Departure from historical 90th percentile | −17.79 m/s |
| Departure from historical maximum | −21.30 m/s |
The 42.3% weakness figure uses the historical mean as its denominator: (23.69 − 13.67) ÷ 23.69. It is not a percentile rank, a measure of total vortex energy, or a statement that the vortex has lost 42.3% of its physical area. Likewise, being 3.62 m/s below the historical 10th percentile identifies a weak daily value without supplying a standardized anomaly. The source does not provide the standard deviation needed for a conventional z-score. [1]
The independent historical-file check places four of the 47 earlier October 30 values below 13.67 m/s. If inserted into that rounded sample, the current value would be fifth lowest among 48. That empirical ordering is consistent with the published below-10th-percentile result. It does not make October 30 a new minimum.
The last day also interrupts any claim of uninterrupted daily weakening. The analyzed wind rose 0.19 m/s. A small recovery within a large negative anomaly is entirely compatible with a disturbed circulation, but the wording should follow the actual daily sequence. The next observations need to establish whether the renewed forecast deceleration occurs.
03 · POLAR VORTEX RESEARCH
The November forecast is outside the historical envelope
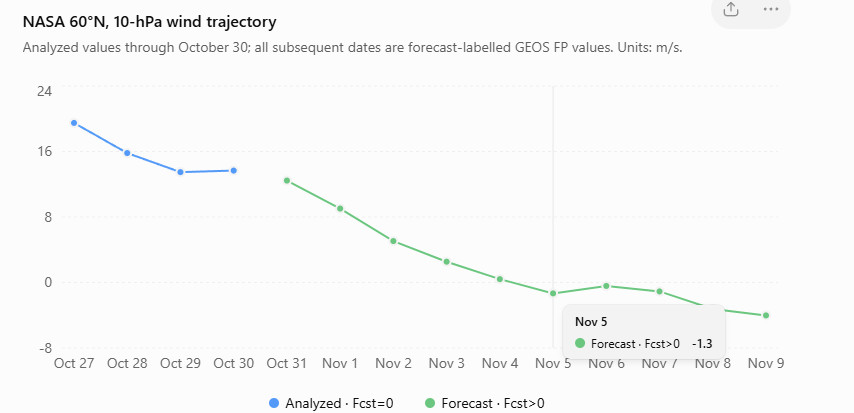
The forecast is exceptional because it moves below earlier calendar-day minima well before it reaches zero. November 1 is forecast at +9.03 m/s against a historical minimum of +11.43 m/s. A new daily low can therefore occur while the zonal-mean flow is still westerly. A later zero crossing would add a directional reversal to that historical wind-strength result. [1]
| Valid date | NASA wind | Historical minimum | Historical mean | Wind minus historical minimum | Fcst field |
|---|---|---|---|---|---|
| October 31 | +12.45 | +11.28 | +24.25 | +1.17 | 6 |
| November 1 | +9.03 | +11.43 | +24.86 | −2.40 | 12 |
| November 2 | +5.06 | +13.68 | +25.62 | −8.62 | 36 |
| November 3 | +2.54 | +14.35 | +25.97 | −11.81 | 60 |
| November 4 | +0.41 | +13.64 | +25.96 | −13.23 | 84 |
| November 5 | −1.33 | +13.57 | +25.97 | −14.90 | 108 |
| November 6 | −0.42 | +13.79 | +26.29 | −14.21 | 156 |
| November 7 | −1.09 | +12.64 | +26.90 | −13.73 | 180 |
| November 8 | −3.23 | +11.95 | +27.79 | −15.18 | 204 |
| November 9 | −4.02 | +12.45 | +28.42 | −16.47 | 228 |
All wind columns are m/s. Every row in this table is forecast-labelled in the retrieved snapshot. The Fcst field is copied exactly; it is not recalculated from the article’s publication time. [1]
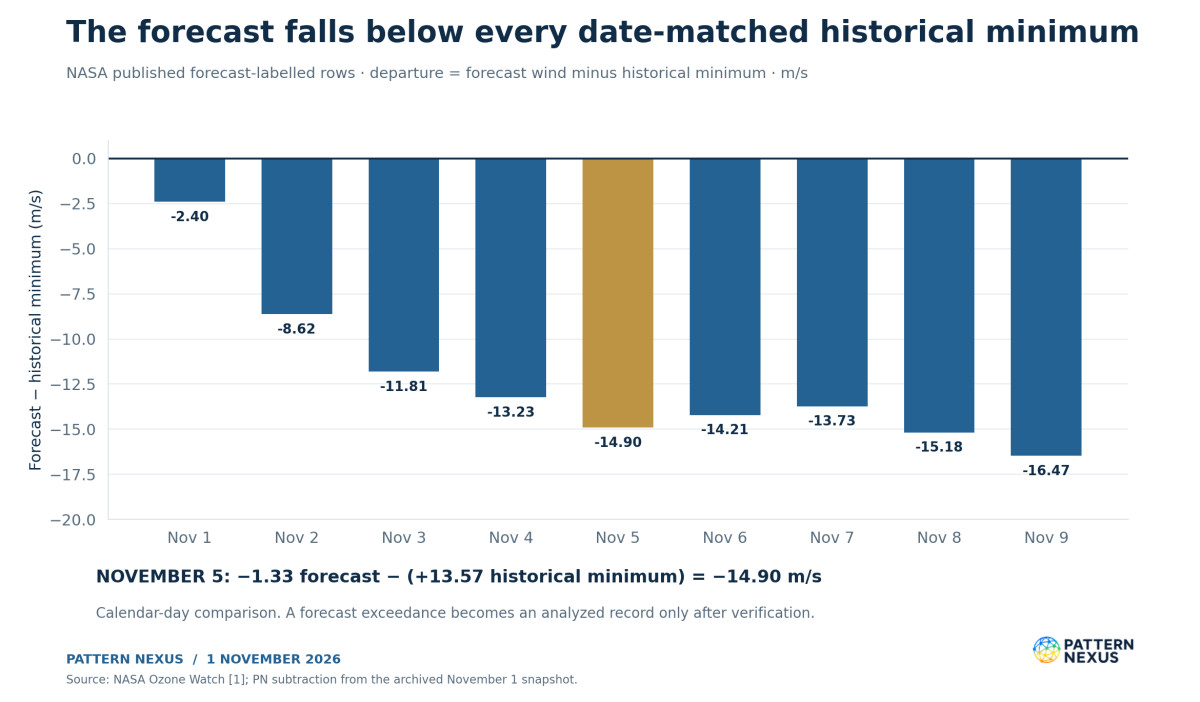
For November 5, the arithmetic is −1.33 − 13.57 = −14.90 m/s relative to the minimum, and −1.33 − 25.97 = −27.30 m/s relative to the mean. These answer different questions. The first measures the distance beyond the earlier daily low. The second measures the departure from the usual circulation for that date.
The forecast first turns negative on November 5 and remains negative through the last available row, November 9. That is a projected five-date easterly interval. It is not five verified easterly days. The shallow values near zero on November 5–7 also leave the exact onset date sensitive to ordinary model and analysis differences.
The file should be read as a published forecast-labelled sequence. Its Fcst increments are not uniformly 24 hours, including the jump from 108 to 156. Without an explicit initialization record for each row, I would not describe the whole sequence as a trajectory from one newly initialized model run. Archiving the original flags preserves that information instead of hiding it beneath a smooth chart.
04 · POLAR VORTEX RESEARCH
The earlier historical benchmark depends on how far back the catalogue runs
The November 28 benchmark is valid for the ERA5-derived monitor catalogue that starts in 1959. It lists onsets on November 28, 1968 and November 28, 2025 as its earliest seasonal entries. NOAA’s multi-reanalysis compendium also documents the 1968 warming, with onset ranging from November 27 in NCEP–NCAR to November 29 in JRA-55; ERA-40 and ERA5 place it on November 28. [5,6]
A longer record changes the historical reference. Lu and Rao’s March 2026 study examines ERA5 events from 1940–2022. Its event table includes November 19, 1952. That event predates the monitor’s 1959 starting point. Describing November 28 as the earliest warming ever would omit a published earlier case. [18]
| Historical frame | Earlier November benchmark | Comparison if November 5 verifies |
|---|---|---|
| Retrieved NASA autumn daily-wind files, 1979–2025 | No negative November daily value in the 47 valid autumns | First negative November date in this retrieved series |
| ERA5 monitor catalogue beginning in 1959 | November 28, 1968 and 2025 | 23 calendar days earlier |
| ERA5 event table covering 1940–2022, Lu and Rao | November 19, 1952 | 14 calendar days earlier |
| NOAA’s multi-reanalysis 1968 event | November 27–29, depending on reanalysis | 22–24 calendar days earlier |
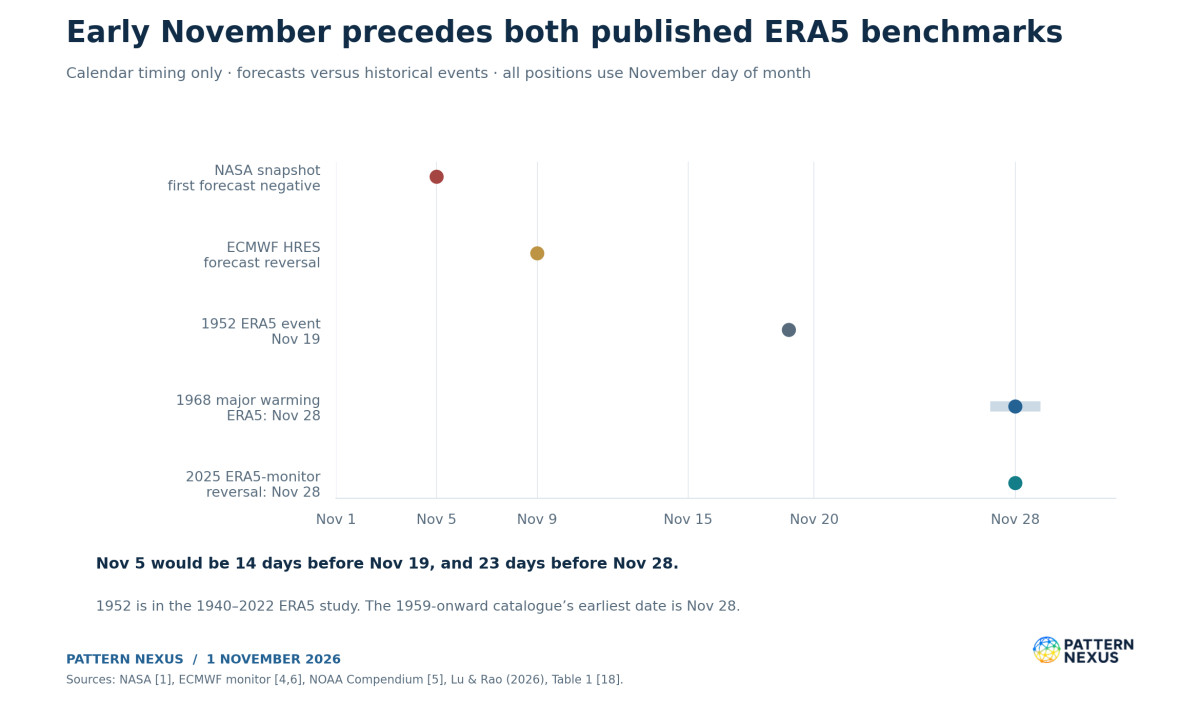
The NASA and ERA5 results can differ at the zero threshold. NASA’s retrieved November 28, 2025 wind is +0.27 m/s. The independent ERA5 catalogue reports a brief −0.02 m/s reversal for that event. A difference of 0.29 m/s changes whether a threshold is crossed, even though both products describe an extremely weak circulation. The historical NASA finding and the ERA5 catalogue can both be reported accurately when their products and definitions remain attached. [6,12]
An onset around ECMWF HRES’s November 9 forecast would still precede November 19 by ten days and November 28 by nineteen. The scientific significance therefore does not depend entirely on NASA hitting November 5 exactly. Verification of an early-November reversal would be remarkable within the named historical records even if timing moves several days.
The defensible record claim is conditional and bounded: an analyzed early-November reversal that satisfies the selected event criteria would precede the onsets in these cited catalogues and establish new date-matched lows in the NASA product. That is a substantial statement. It does not require a claim about every polar-vortex disruption in Earth’s history.
05 · POLAR VORTEX RESEARCH
The conventional and AI ensembles have materially different timing
The independent monitor’s November 1 00Z ECMWF ensemble table counts members whose daily 60°N, 10-hPa wind turns negative at least once by each target date. Those are cumulative counts. The 50 members reversing by November 10 are not necessarily 50 members with negative winds on November 10, and the table does not establish an uninterrupted reversal in every member. [4]
| Reversal by target date | Conventional ENS | AIFS ENS | Difference in raw shares |
|---|---|---|---|
| November 5 | 33/50 · 66% | 2/50 · 4% | 62 percentage points |
| November 10 | 50/50 · 100% | 24/50 · 48% | 52 percentage points |
| November 15 | 50/50 · 100% | 35/50 · 70% | 30 percentage points |
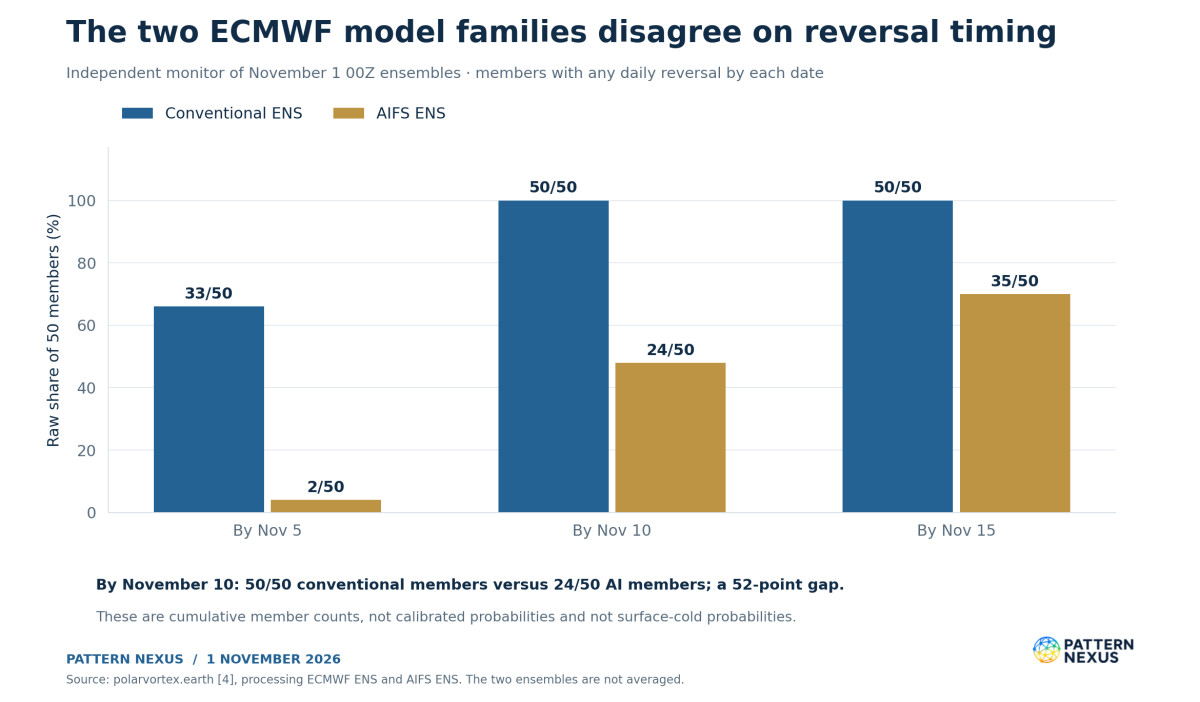
The conventional ensemble strongly favors an early reversal. The AI ensemble has much weaker support for the first few days and a broader delay. By November 15, both model families contain a substantial reversal signal, while their disagreement remains large enough to affect onset, duration, and the downstream verification window.
The raw fractions do not supply calibrated real-world probabilities. Members share model structure, training or physical assumptions, and initialization information. They are not 50 independent historical experiments. Averaging 100% and 48% into a single 74% probability would conceal model disagreement without providing a calibration method.
The monitor places HRES’s deterministic reversal around November 9, later than the first negative NASA row. Agreement on a weakening regime can coexist with disagreement on the threshold date. For the daily watch, I would track how many consecutive cycles preserve the signal, how the first-negative-date distribution moves, and whether the forecast easterlies deepen or recover. That requires archived run-by-run data; the current three-date table cannot provide it on its own.
06 · POLAR VORTEX RESEARCH
The lower stratosphere is weak, but the latest day recovered at every sampled level
Pressure levels describe atmospheric surfaces, rather than fixed geometric heights. The 10-hPa circulation is roughly 30 kilometers above the surface; 70 and 100 hPa sample the lower stratosphere. Their exact heights vary with the atmosphere. A three-level comparison can establish vertical coherence in wind weakness, but it cannot by itself trace the movement of an anomaly into the weather-producing troposphere. [1–3,17]
| October 30 analysis | 10 hPa | 70 hPa | 100 hPa |
|---|---|---|---|
| Wind, m/s | 13.67 | 8.04 | 9.86 |
| Daily change, m/s | +0.19 | +0.17 | +0.86 |
| Historical mean, m/s | 23.69 | 13.09 | 13.34 |
| Mean anomaly, m/s | −10.02 | −5.05 | −3.48 |
| Historical 10th percentile, m/s | 17.29 | 9.59 | 10.26 |
| Wind minus 10th percentile, m/s | −3.62 | −1.55 | −0.40 |
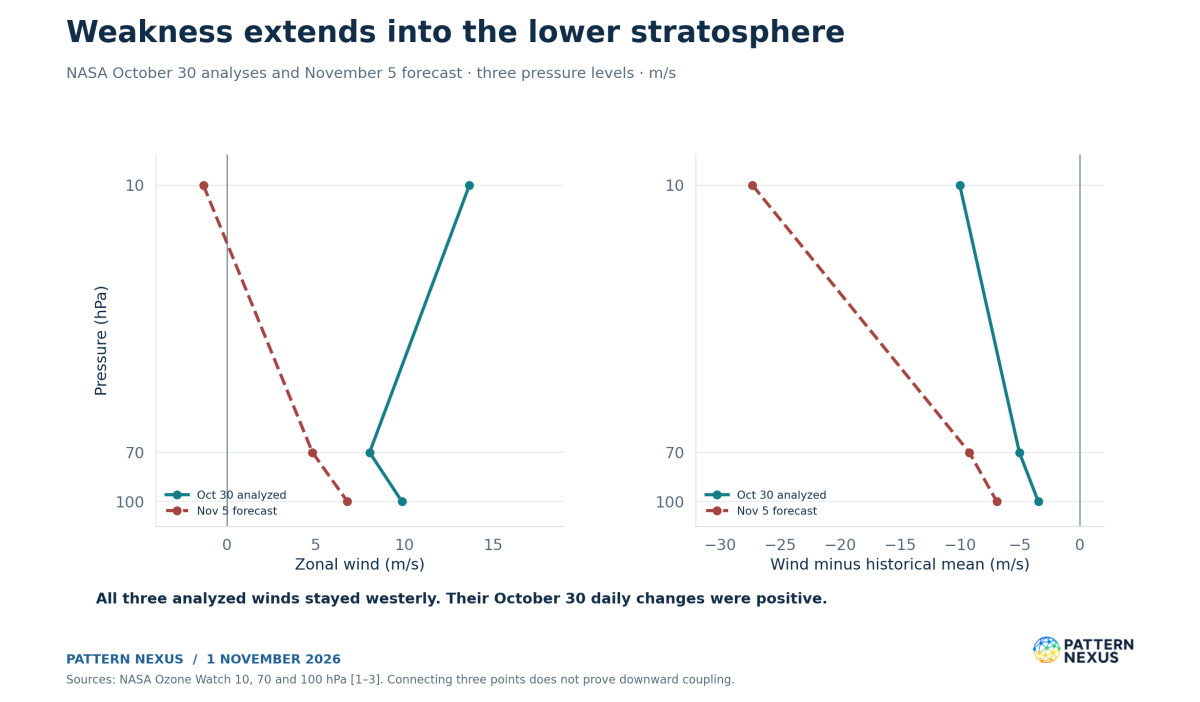
All three sampled levels are below their date-matched 10th percentiles, and all three remain westerly. All three also strengthened slightly on the last analyzed day. The shared negative anomalies support a weak column across these sampled stratospheric levels; the daily increases show that its evolution is not a simple uninterrupted descent or collapse. [1–3]
For November 5, NASA forecasts −1.33 m/s at 10 hPa, +4.82 m/s at 70 hPa, and +6.79 m/s at 100 hPa. Relative to their historical means, those are −27.30, −9.22, and −6.94 m/s. The largest projected anomaly is high in the stratosphere. Lower levels remain westerly in that forecast snapshot.
A downward-coupling claim needs more than three negative anomalies at one latitude. It needs sustained temporal development across levels, preferably polar-cap height or annular-mode diagnostics and the evolving tropospheric circulation. Lower-stratospheric persistence matters because the surface response can depend on how long the anomaly survives near the tropopause. A brief upper-level threshold crossing and a deep, persistent disturbance are different forecast problems. [17]
07 · POLAR VORTEX RESEARCH
The temperature data show a developing warming, with a forecast peak still ahead
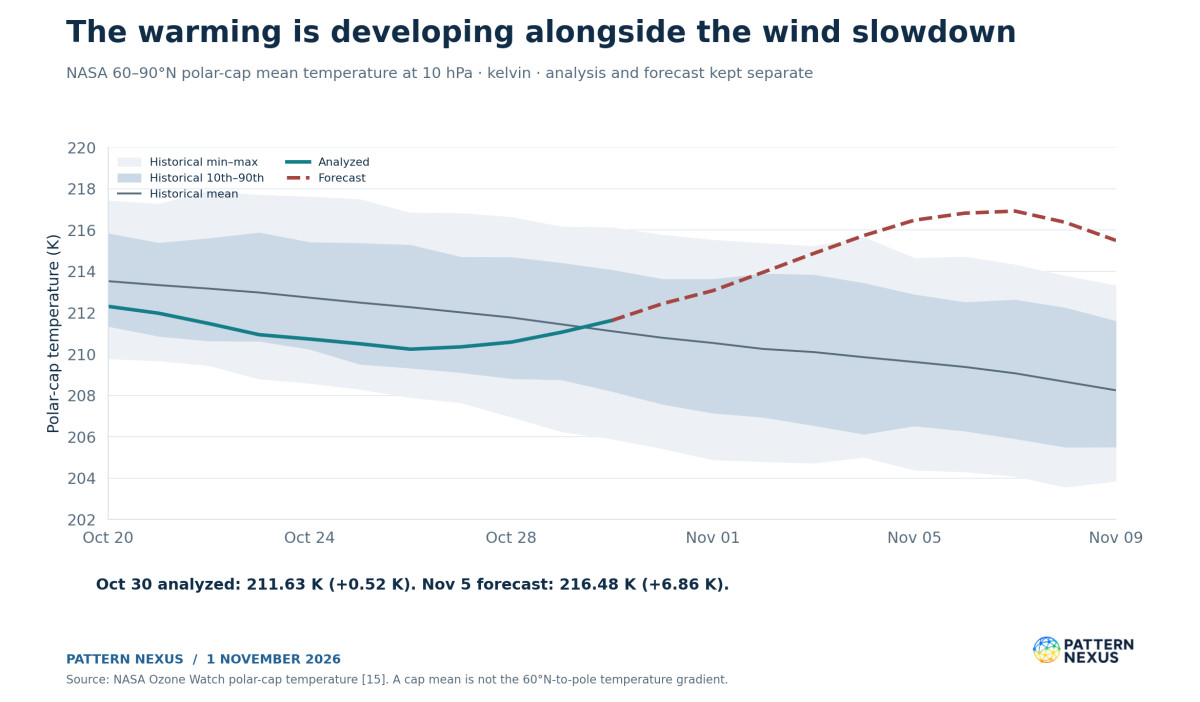
The newest NASA analyzed 60–90°N polar-cap mean temperature at 10 hPa is 211.63 K on October 30. Its historical mean is 211.11 K, producing a +0.52 K anomaly. The temperature rose 0.57 K from October 29 and 1.39 K from October 26. The analyzed cap has started to warm, but the much larger temperature departure remains forecast. [15]
NASA projects 216.48 K on November 5 against a mean of 209.62 K: +6.86 K. The forecast is also 1.85 K above that date’s earlier historical maximum of 214.63 K. The projected departure peaks at +7.85 K on November 7, then eases. These temperature forecasts add a thermodynamic signal to the forecast wind reversal. [15]
The ECMWF-based monitor reports a current cap temperature near 213 K against a normal near 211 K. Its current panels describe October 31 and use different model fields and a 1991–2020 normal. The NASA analysis above is for October 30 and uses NASA’s stated climatology. These should appear as separate dated estimates, rather than being substituted for one another as if they were the same measurement. [4,15]
The event definition also needs care. The widely used Charlton–Polvani detection rule identifies the daily-mean zonal wind reversal at 60°N and 10 hPa during November–March, with recovery rules separating events and final warmings. Older WMO-style definitions additionally discuss reversal of the polar temperature gradient. A single polar-cap mean temperature cannot test that gradient because it averages across the region. [5,19,20]
The current analyzed winds have not crossed zero. The article therefore does not declare an observed major warming. When a reversal verifies, the event should be evaluated under the explicitly selected detection rule, with temperature evolution reported alongside it. There is no reason to invent a universal cap-mean temperature threshold or demand a particular headline temperature jump that the chosen rule does not specify.
08 · POLAR VORTEX RESEARCH
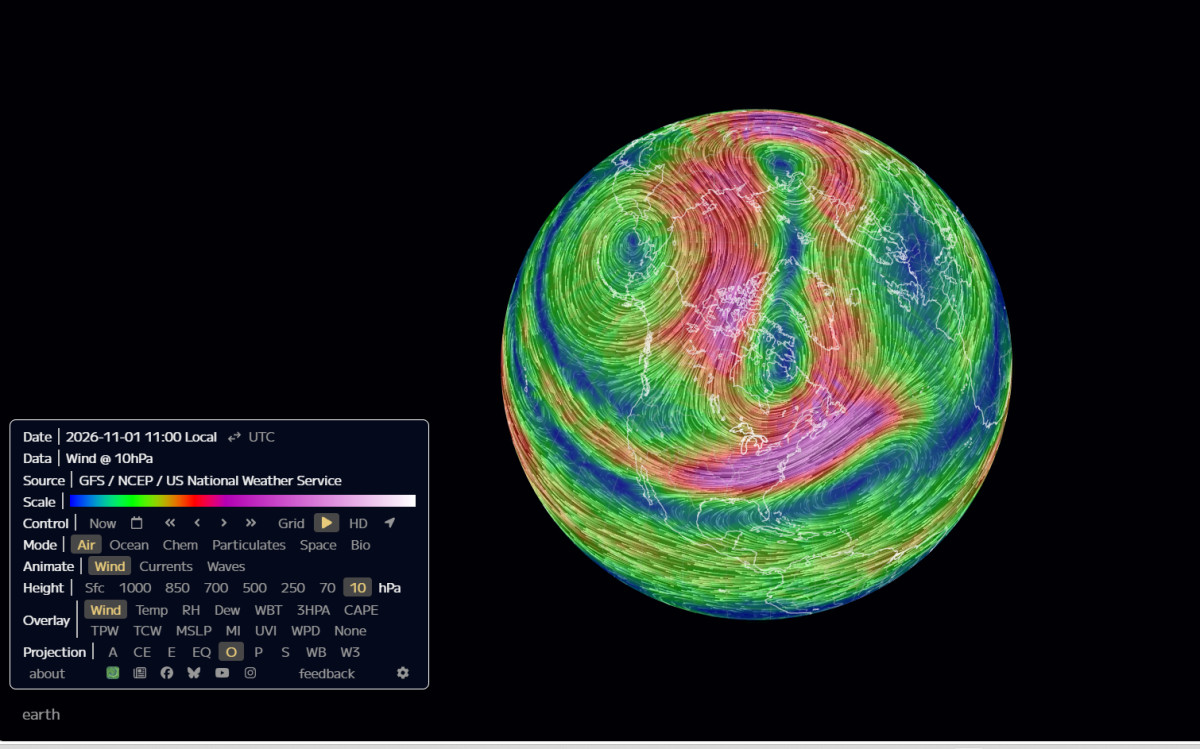
The original GFS image shows the spatial deformation
The supplied visualization displays GFS/NCEP winds at 10 hPa with a November 1, 2026, 11:00 local-time label. It shows a highly deformed hemispheric flow with pronounced meanders and multiple curved circulation structures. The original image is retained below, including its model, level, and interface labels.
A streamline image is a spatial view of modeled wind. Its colors and curves do not directly delineate material vortex boundaries or calculate potential-vorticity connectivity. A visually dramatic pair of curved centers can motivate a split test, but it cannot complete that test. The relevant calculations require the gridded atmospheric fields, a defined vortex-identification method, and a persistence criterion.
The screenshot’s visible local-time field also does not identify its initialization cycle, forecast lead, or UTC offset. I have not assigned those missing attributes. Its role is to document the spatial configuration presented for the watch, while NASA’s daily wind and the independently processed ECMWF diagnostics provide separately identified quantitative tests.
The image documents the deformation that prompted the update. A full dynamical classification requires the separate field calculations described above. NASA’s daily wind and the ECMWF-based diagnostics can test parts of that interpretation without treating the screenshot as a measurement of the entire circulation.
09 · POLAR VORTEX RESEARCH
Wave-2 deformation is strong and the vortex center remains near the pole
The monitor’s November 1 00Z processing reports an aspect ratio of 2.78, a centroid at 83.9°N, a wave-1 amplitude of 384 meters, and wave-2 amplitude of 548 meters. Its current diagnostic panels refer to October 31. The forecast stretches the aspect ratio to 2.94 on November 2. [4]
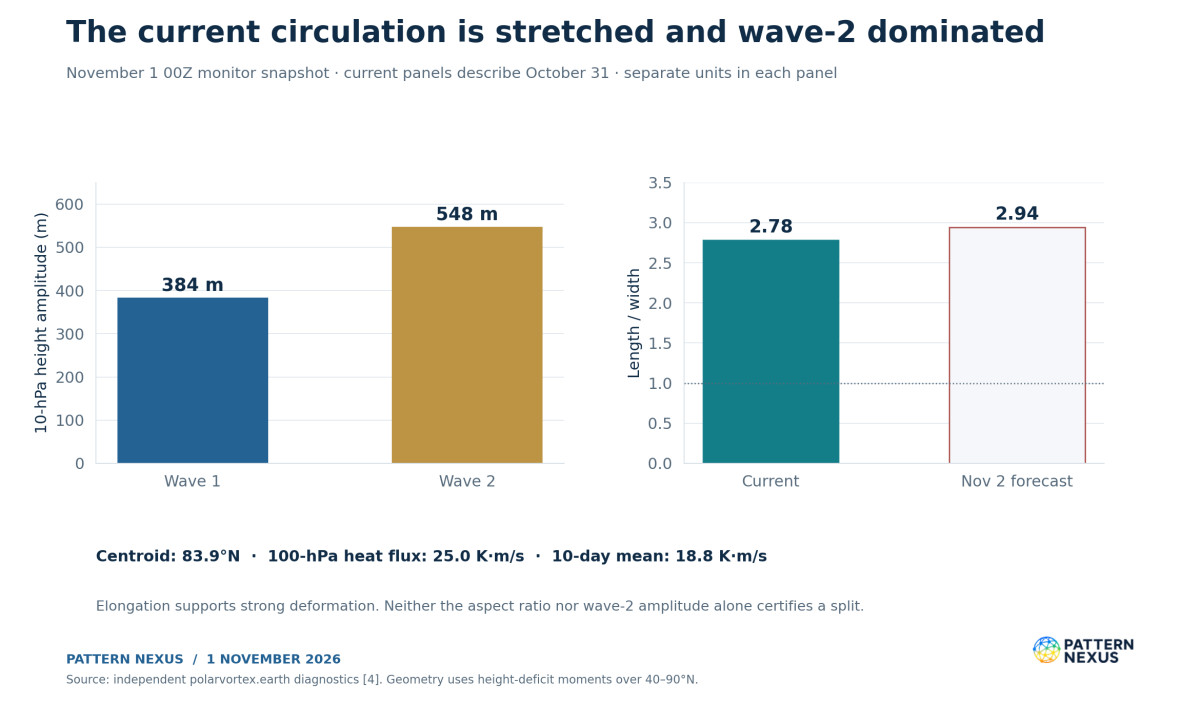
The aspect ratio measures length divided by width within the monitor’s height-deficit moment method. A value near one describes a rounder distribution; 2.78 describes pronounced elongation. The centroid’s distance from the pole remains modest. Together, the metrics favor a description of a near-polar circulation being stretched and deformed, rather than a simple translation of the entire vortex far into lower latitudes.
The monitor identifies the vortex using areas below the domain-mean 10-hPa height over 40–90°N, weighted by their height deficit. That is a specified diagnostic, not a universal material boundary. The result can be compared with its own historical baseline because the monitor applies the same calculation to its ERA5 reference fields. It should not be silently mixed with the different centering and axisymmetry measures used in the original September PN investigation. [4,13]
Wave-2 amplitude exceeds wave-1 amplitude by 164 meters, or about 42.7%. This refers to the amplitudes of zonal harmonics of the height field at 60°N. It does not mean wave 2 supplies 42.7% more total atmospheric energy or momentum forcing. Wave 1 often favors displacement, while wave 2 is associated with elongation and splitting, but event geometry depends on the full evolving field. [4,18]
The next spatial test is whether deformation produces two persistent, separately identifiable vortex lobes under a stated method. An aspect ratio above two, or even above a method-specific historical threshold, cannot by itself certify that outcome. The current evidence supports strong deformation and elevated split risk within the developing disturbance.
10 · POLAR VORTEX RESEARCH
The wave forcing provides a direct dynamical mechanism
The ECMWF-based monitor reports 100-hPa poleward eddy heat flux of 25.0 K·m/s, averaged across 45–75°N. Its trailing ten-day mean is 18.8 K·m/s and is described in the briefing as above the date-matched 95th percentile. The forecast daily flux peaks at 26.8 K·m/s on November 2. [4]
Eddy heat flux is based on the covariance of meridional wind and temperature departures from their zonal means: the zonal mean of v′T′, followed by the specified latitude and time averaging. In Northern Hemisphere winter diagnostics, positive poleward heat flux is widely used as a proxy for upward planetary-wave activity entering the stratosphere. The unit K·m/s is not a surface heat flux in watts per square meter. [4,16]
As planetary waves propagate upward and interact with the background flow, they can decelerate the stratospheric westerlies and alter the residual circulation. Downward motion over the polar region contributes to adiabatic warming. The coupled wind and temperature response explains why a warming can accompany the breakdown of the winter circulation. The measured heat-flux proxy supports this dynamical interpretation; it is not itself a direct measurement of the local momentum tendency at every height. [16,17]
The averaging window also matters. The monitor’s daily flux, ten-day mean, and NASA’s separately available 45-day averaged flux are different diagnostics. They should not be placed on the same time-series line as interchangeable observations. A stronger short pulse can coexist with a moderate longer average, while a sustained burst can change both.
The most informative next measurements are the duration of the upward-wave pulse, its zonal-wave contributions, the evolution of the lower-stratospheric background flow, and the persistence of the resulting height anomalies. A peak forecast on November 2 becomes evidence of the forcing sequence only when it is replaced by an analyzed value.
11 · POLAR VORTEX RESEARCH
The polar-cap height section shows a strong upper signal and a different surface state
The independent monitor provides a pressure–time section of standardized polar-cap height anomalies. Its displayed current labels show approximately +2.6 standard deviations at 10 hPa and −0.9 at 1000 hPa. High polar-cap heights correspond to a weaker stratospheric circulation; at the surface, the sign is related to the opposite sign of the Arctic Oscillation. [4]
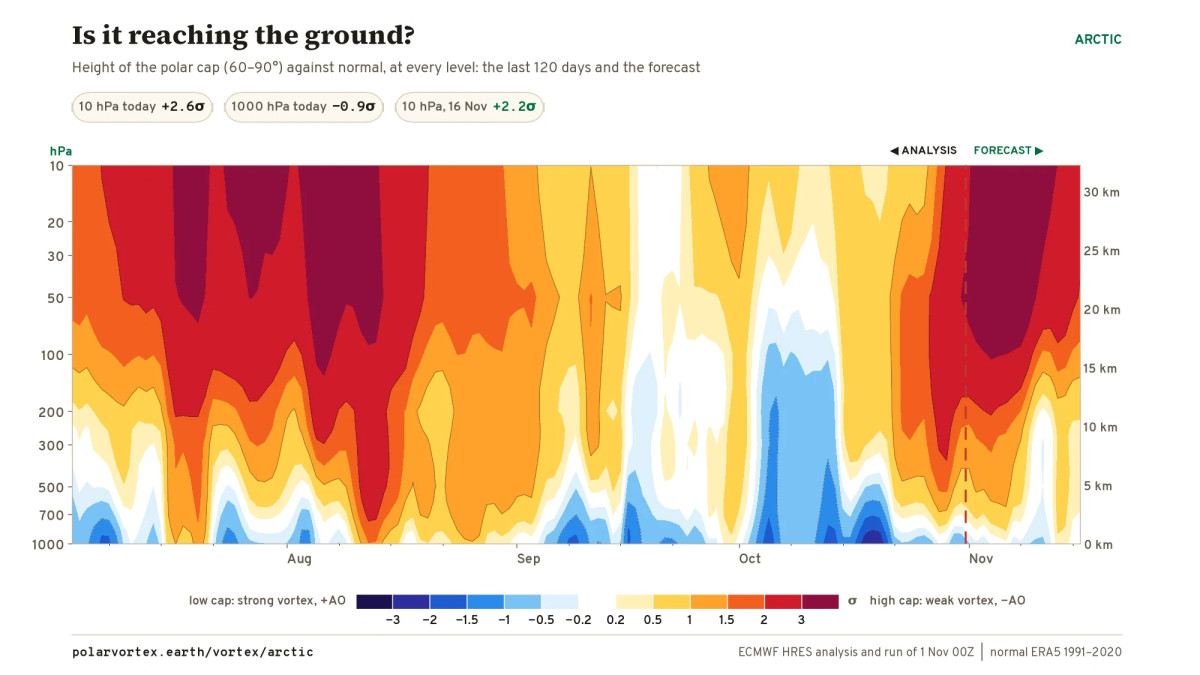
The contrast is useful. A large positive upper-level height anomaly can coexist with a negative near-surface height anomaly. The atmosphere does not have to move as one vertically uniform column. The image therefore provides more information than the general statement that a weak vortex may affect winter weather.
The panel also contains a forecast section, separated from the analysis by its marked boundary. Colors on the forecast side are prospective fields. They cannot establish that downward coupling has already occurred. I inspected the published image; I did not independently reconstruct its underlying gridded height anomalies, normalization, or a numerical descent rate.
Research supports a relationship between some stratospheric disturbances and subsequent circulation changes, but individual responses differ. Lu and Rao’s classification explicitly separates events with impacts concentrated over Eurasia, North America, both, or neither. Those categories explain why a hemispheric reversal signal cannot be converted directly into a cold-outbreak probability for one continent or city. [17,18]
For this event, confirmation would involve persistent lower-stratospheric anomalies followed by a compatible tropospheric circulation response across successive analyses and forecasts. A single same-sign patch, a front, or one cold station reading is insufficient to identify that causal sequence. The test follows what changes, at which height, in what order, and with what competing weather drivers.
12 · POLAR VORTEX RESEARCH
NOAA still favors U.S. warmth during the first reversal window
CPC’s October 31 outlook is valid for November 6–10 and November 8–14. In the first period, it favors above-normal temperatures throughout the contiguous United States, with probabilities exceeding 80% over the northernmost Great Plains. In week two, above-normal temperatures remain favored across most of the country, with greater than 70% probabilities in the north-central United States and a more uncertain near- or below-normal signal in parts of the Southeast. [10]
These are probabilities for the temperature category over a multi-day period. They do not mean every afternoon is warm or that a cold front cannot pass through. They do show that the current operational surface outlook is not forecasting a widespread immediate Arctic outbreak across the northern United States.
The 500-hPa discussion describes substantial ridging over Canada and the adjacent northern United States, a strong North Pacific trough, and a more progressive southern-tier pattern. The arrangement of those ridges and troughs governs where lower-tropospheric cold can travel. A stratospheric reversal can alter the later background circulation without erasing that near-term pattern on the day the wind turns easterly. [10]
WPC’s November 1 snow discussion identifies a separate western mountain storm. The San Juans, Uintas, Wind River Range, and Colorado Elk Mountains have greater than 50% probabilities of at least twelve inches, with locally two feet of storm-total snow possible. Significant accumulations are concentrated mainly above 9,000 feet, with notable accumulations below 6,000 feet not expected in that discussion. [11]
The storm has an immediate Pacific trough and moisture-transport explanation. It should not be attributed to a future stratospheric reversal. For the Midwest and Great Lakes, an eventual cold-delivery assessment would need western Canadian or Alaskan blocking, a compatible downstream trough, and lower-tropospheric transport into the region. Those are conditions to monitor, rather than outcomes established by the present wind forecast.
13 · POLAR VORTEX RESEARCH
The September record sequence survives the new data check
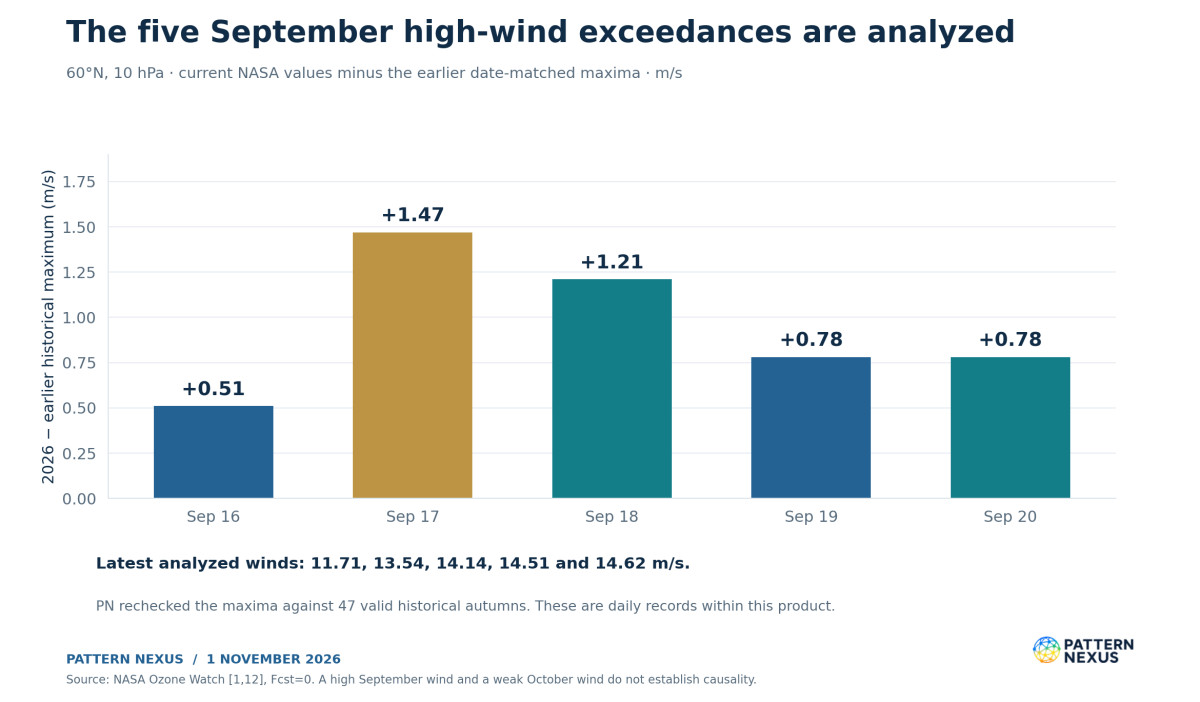
The earlier PN reporting documented the developing strong-vortex episode while some later dates were still forecasts. The current NASA file now supplies analyzed values for the entire September 16–20 sequence. Each exceeds its earlier calendar-day maximum. [1,14]
| Date | Current analyzed wind | Earlier historical maximum | Exceedance |
|---|---|---|---|
| September 16 | 11.71 | 11.20 | +0.51 |
| September 17 | 13.54 | 12.07 | +1.47 |
| September 18 | 14.14 | 12.93 | +1.21 |
| September 19 | 14.51 | 13.73 | +0.78 |
| September 20 | 14.62 | 13.84 | +0.78 |
All values are m/s and all five current rows have Fcst=0. The historical maxima were independently checked against the Data columns of the 47 valid autumn files. [1,12]
The old article’s forecast values should remain attached to that old publication date. The updated analyzed values belong in the present verification table. This preserves the research trail: an earlier prediction can be tested against later data without rewriting the forecast as though the final value had been known at the time.
The combination of September high-wind exceedances and an early-November low-wind forecast is a strong description of the seasonal reversal in anomalies. It does not establish that the high September winds caused the later disruption, nor does it independently validate every proposed solar or seasonal mechanism in the earlier framework. Those propositions need their own tests.
14 · POLAR VORTEX RESEARCH
The G2 geomagnetic storm is verified; the vortex attribution remains open
NOAA’s November 1, 12:30 UTC discussion confirms G1–G2 geomagnetic storming associated with a positive-polarity coronal-hole high-speed stream and its preceding corotating interaction region. Solar-wind speed increased to roughly 615 km/s near October 31 at 22:00 UTC, while the magnetic field’s Bz component reached approximately −11 nT during southward intervals. [7]
The retrieved three-hour planetary Kp series reaches 6.00 at the October 31, 18:00 UTC timestamp, representing the interval beginning then. NOAA’s scale associates Kp 6 with G2 moderate storming. The newest retrieved interval, beginning November 1 at 15:00 UTC, is 2.33. These are a peak and a subsequent reading, not contradictory descriptions of one instant. [8,9]
NOAA did not identify a new Earth-directed CME in the available imagery, and its greater-than-10-MeV proton flux remained near background. The operational mechanism for the geomagnetic event is therefore the stream interaction described by NOAA. It should not be relabeled a confirmed CME impact or an energetic-proton storm. [7]
The solar branch belongs in the record because the earlier PN hypothesis included solar–atmosphere connections. It remains a hypothesis at the event-attribution level. Kp measures geomagnetic disturbance; it is not a measurement of stratospheric heating, ozone change, or planetary-wave momentum deposition. The G2 observation and the vortex deformation do not by themselves determine the direction or strength of a causal link.
An attribution test would need the relevant particle or radiative forcing, an observed chemical or dynamical response at the expected heights, a plausible lag, and comparisons that account for tropospheric wave forcing and the evolving seasonal background. The available event-specific evidence is stronger for the planetary-wave mechanism. It still leaves room to investigate solar modulation without treating coincidence as proof or deleting the solar record from the watch.
15 · POLAR VORTEX RESEARCH
Three pathways remain physically testable
The evidence supports a highly disturbed stratosphere and a credible early-reversal forecast. It does not yet identify a unique regional winter outcome. I would follow three conditional pathways rather than manufacture event probabilities from ensemble counts that answer a different question.
| Pathway | Evidence that would strengthen it | Expected implication | Evidence that would weaken it |
|---|---|---|---|
| Reversal verifies; limited surface coupling | Brief easterlies, upper-level disturbance, recovery below or near 100 hPa, persistent Canadian ridging | Historical upper-level event with surface weather dominated by existing tropospheric patterns | Persistent lower-stratospheric anomalies and a coherent surface circulation response |
| Persistent disturbance; North American cold corridor develops | Continued lower-stratospheric weakness, high-latitude blocking in a favorable position, downstream North American trough, 850-hPa cold transport | Higher risk of episodic Arctic delivery to affected North American regions later in November or beyond | Rapid vortex recovery, unfavorable blocking position, repeated loss of the downstream trough |
| Persistent disturbance; impacts favor Eurasia or another sector | Compatible blocking and tropospheric jet changes favor Eurasian cold while North American ridging persists | A major hemispheric disturbance with an uneven regional response | A sustained shift in North American height and transport forecasts |
These are PN scenarios, not calibrated forecasts. The uncertainty is about both transmission and geography. A disturbance can reach the troposphere while the principal cold response misses the United States. Conversely, a North American cold outbreak can occur through tropospheric processes without a preceding major warming. [17,18]
For an early-November onset, the latter part of November and subsequent weeks provide a sensible monitoring window for possible persistent circulation changes. That is an observation window derived from the event sequence and the literature’s weeks-long response times, not a promise of a cold wave on a specific date. Earlier compatible changes are possible, and some events do not produce an identifiable downward response.
The earliest event on the calendar would not automatically produce the most severe surface weather. Seasonal background conditions, disturbance duration, the location of blocking, snow cover, ocean influences, and the pre-existing jet all affect the regional response. Historical timing is one dimension of the event, not a substitute for forecasting its consequences.
16 · POLAR VORTEX RESEARCH
The next observations decide which claims can be upgraded
The immediate sequence can be tested without waiting until winter ends. First, watch whether the forecast below-minimum daily winds are replaced by Fcst=0 analyses. Second, establish the first negative analyzed daily mean, if any. Third, apply a named event rule. Fourth, follow the lower-stratospheric persistence and the regional circulation. These tests need separate status fields.
| Claim or diagnostic | Status at this research cutoff | Next verification step |
|---|---|---|
| September 16–20 daily high-wind exceedances | Verified in the retrieved NASA product | Retain revised values if later reanalysis changes them |
| October 30 below-10th-percentile wind | Verified analysis | Follow the next analyzed daily rows |
| New November date-matched wind minimum | Forecast | Analyzed wind below that date’s historical minimum |
| Early-November wind reversal | Forecast | Negative daily 60°N, 10-hPa analyzed wind |
| Major SSW classification | Not established by current analyses | Apply the selected rule to verified event evolution |
| Persistent vortex split | Not established | Gridded vortex-boundary and lobe-persistence analysis |
| Downward coupling | Not established by this review | Persistent lower-stratospheric and tropospheric anomaly sequence |
| Widespread U.S. Arctic outbreak | Unsupported by the cited near-term CPC outlook | Regional height, transport, and surface-temperature forecasts change |
| October 31 G2 storm | Confirmed by NOAA | Follow subsequent space-weather observations separately |
I would also preserve each new forecast cycle before it is overwritten. A reversal moving from November 5 to November 9 is not necessarily failure of the disturbance forecast, but it is a timing change that should remain visible. A disappearing reversal, a rapid recovery, or a substantially weaker warming would change the assessment more materially.
The present signal earns close attention because multiple diagnostics support a developing disturbance and the projected timing lies outside the cited early-season benchmarks. The verification process is what turns that signal into a durable record. It is also what allows the PN watch to assess its own forecasts after the event.
17 · POLAR VORTEX RESEARCH
PN Lens: a circulation sequence with separate thresholds
The system view is a sequence of interacting states: seasonal radiative cooling, background wind, planetary-wave propagation, vortex deformation, thermal adjustment, and the lower atmosphere’s response. A change in one part can affect the others, while different timescales prevent them from moving in lockstep.
The September record and the November reversal forecast fit inside that sequence. The circulation moved from unusually strong early-season westerlies to a large negative seasonal anomaly. The current wave-2 deformation and heat-flux signal provide a physical route toward further weakening. The forecast warming and wind reversal describe the next projected state. The surface response remains a later, geographically conditional test.
My assessment is that this deserves to be treated as a potential historical atmospheric event. The strongest claim already established is the rapid transition in the seasonal anomaly, supported by the analyzed September and October data. The strongest outstanding forecast is an early-November reversal that would precede both the November 19 and November 28 catalogue benchmarks.
The cold-delivery branch needs its own evidence. If the reversal verifies and the lower-stratospheric disturbance persists, later North American and Eurasian circulation forecasts deserve increased scrutiny. If the upper circulation recovers while Canadian ridging remains in place, the historical wind event may still be real while the anticipated U.S. cold response fails to develop. Each outcome remains measurable.
18 · POLAR VORTEX RESEARCH
Frequently asked questions
Has the November record already happened?
No. The latest analyzed NASA wind in this snapshot is October 30 at +13.67 m/s, above its historical minimum. November 1–9 values are forecast-labelled. The September 16–20 high-wind exceedances are already analyzed.
Can a daily wind record occur before the wind reverses?
Yes. November 1 is forecast at +9.03 m/s against an earlier minimum of +11.43 m/s. A verified positive value below the earlier minimum would establish a new daily low while the mean flow remained westerly.
Would this be the earliest major warming ever?
A qualifying early-November event would precede the cited ERA5 catalogue benchmarks. The monitor starting in 1959 uses November 28, while a longer ERA5 study includes November 19, 1952. The defensible wording names the catalogue, event rule, and verified date rather than claiming an unlimited historical record.
Does 50/50 mean a 100% real-world probability?
It means all 50 conventional ensemble members counted by the monitor reverse at least once by the target date. It is a raw cumulative fraction from one model family and cycle. The AI ensemble disagrees, and calibration has not been supplied.
Does the GFS screenshot prove the vortex has split?
It documents a highly distorted modeled wind field. A confirmed persistent split requires an explicit vortex-identification method applied to gridded fields. The separate ECMWF-based aspect ratio supports elongation, without completing that split test.
Why is the United States still forecast to be warm?
The near-term tropospheric pattern includes substantial Canadian and northern U.S. ridging. A developing stratospheric disturbance does not dictate immediate surface conditions. Any later regional response depends on persistence, coupling, and the location of ridges and troughs.
Did the G2 storm cause the disturbance?
NOAA confirms the geomagnetic storm and its coronal-hole-stream mechanism. This review has not established the particle, chemistry, heating, or dynamical sequence needed to attribute the vortex change to that event. Strong planetary-wave forcing supplies a more directly supported mechanism for the atmospheric disturbance.
Are NASA and ERA5 supposed to give identical reversal dates?
No. Different analyses, temporal averaging, and near-zero winds can produce different threshold dates. The 2025 example is explicit: +0.27 m/s in the retrieved NASA series versus −0.02 m/s in the independent ERA5 catalogue. A record needs its product and rule attached.
What would materially reduce the concern?
Repeated forecast cycles losing the reversal, analyzed winds remaining above the projected daily minima, a short disturbance followed by rapid lower-stratospheric recovery, and continued regional circulation forecasts unfavorable to Arctic delivery. These would affect different parts of the watch and should be recorded separately.
19 · POLAR VORTEX RESEARCH
Method, source dates, and reproducibility
This update uses November 1, 2026 source snapshots. NASA’s latest wind and polar-cap temperature analyses in the retrieved files end October 30. Later rows retain their original forecast flags. The ECMWF-based monitor uses the November 1 00Z run and labels its current daily panels October 31. CPC’s cited discussion was issued October 31; the WPC snow discussion and NOAA SWPC discussion were issued November 1. Publication date and observation date are not interchangeable.
I retrieved the NASA 1978–2025 seasonal wind files and used their Data columns for the historical check. The relevant 1978 autumn values are missing, leaving 47 valid autumns, 1979–2025. Missing values of −9999 are excluded. For September 1–November 9, the recomputed daily minima and maxima match the current file’s published benchmark columns to the displayed precision; recomputed means agree within approximately 0.01 m/s after rounding. NASA’s published benchmark columns remain the article’s reporting reference.
The historical check finds no negative November daily winds in those 47 NASA autumns. It is a bounded empirical result. It does not make the event impossible, establish an infinite return period, or override ERA5 event identification. The near-zero 2025 cross-product difference is reported explicitly.
Wind anomaly equals the dated wind minus the dated historical mean. The historical-minimum gap equals the dated wind minus the dated minimum. Percentage weakness uses the positive historical mean as its denominator. Temperature anomalies use the corresponding temperature mean. No z-scores are inferred from percentile bands, and no invented regional cold probabilities are attached to reversal fractions.
The contemporary NASA rows use GEOS FP, as stated in their headers; historical files are MERRA-2. These are operational analysis-to-reanalysis comparisons and may change when finalized data arrive. The NASA climatology label is 1978/1979–2025/2026. The independent ECMWF monitor uses ERA5 1991–2020 for its normals. Neither baseline is substituted for the other.
The 500-hPa circulation assessment comes from CPC’s forecast discussion. A separate numerical 250-hPa jet diagnostic was not retrieved for this update; the three-level NASA comparison should not be read as a complete profile from the surface through the stratosphere.
Nine original PN figures are rendered from numeric data or explicitly identified historical dates. The original GFS screenshot is preserved unchanged in the article. The polar-cap height section is an attributed monitor image, inspected qualitatively; its grid has not been independently reprocessed. The package includes numeric CSVs, original NASA text files, historical inputs, source URLs, the calculation script, and a source audit. The article remains public and free.
SOURCES
Sources and prior Pattern Nexus research
Research cutoff: November 1, 2026. Source dates, baselines and forecast status are retained below. Numeric references in the article point to this list; external links appear only here.
- NASA Ozone Watch. 2026/27 daily 60°N zonal-mean zonal wind, 10 hPa. Retrieved November 1. Analysis through October 30; later forecast flags preserved. Current GEOS FP, historical MERRA-2.
- NASA Ozone Watch. 2026/27 daily 60°N wind, 70 hPa. Same snapshot and analysis cutoff; lower-stratospheric wind comparison.
- NASA Ozone Watch. 2026/27 daily 60°N wind, 100 hPa. Same snapshot and analysis cutoff; lower-stratospheric wind comparison.
- polarvortex.earth. Arctic vortex diagnostics and ECMWF ensemble table. Independent processing, not an official ECMWF event declaration. November 1 00Z run; current panels dated October 31. ERA5 1991–2020 normals. Geometry, waves, heat flux, temperature and cumulative ensemble counts; coupling image credited to this source.
- NOAA Chemical Sciences Laboratory. SSW Compendium: table of major mid-winter warmings. Historical reanalysis dates and Charlton–Polvani separation/recovery rules. The 1968 event ranges November 27–29 across products; ERA5 places it on November 28.
- polarvortex.earth. ERA5-derived catalogue of sudden warmings since 1959. Independent catalogue, not an official NOAA list. November 28, 1968 and 2025 are its earliest entries. The 2025 minimum is −0.02 m/s; dataset and rule must remain attached.
- NOAA SWPC. Forecast Discussion, November 1, 2026, 12:30 UTC. Operational confirmation of G1–G2 activity, CIR / positive-polarity coronal-hole stream, approximately 615 km/s peak speed and −11 nT Bz. Rolling product; archived text is supplied.
- NOAA SWPC. Three-hour planetary Kp feed. Snapshot includes Kp 6.00 for October 31 at 18:00 UTC and later intervals through November 1 at 15:00 UTC. Timestamps mark interval starts.
- NOAA SWPC. NOAA Space Weather Scales. G2 moderate geomagnetic storm corresponds to Kp 6; geomagnetic and solar-radiation scales describe different measurements.
- NOAA Climate Prediction Center. 6–10 and 8–14 day prognostic discussion, issued October 31. Valid November 6–10 and November 8–14. Probabilities describe period-mean temperature categories, with continued north-central U.S. warmth favored.
- NOAA Weather Prediction Center. Heavy Snow and Icing Discussion, November 1, 02:22 EST. Valid November 1–4. Western high-elevation snowfall associated with a Pacific trough and moisture transport. Snowfall values are forecasts.
- NASA Ozone Watch. Wind archive and historical seasonal text files. PN retrieved 48 seasonal files, 1978–2025. The 1978 autumn is missing, leaving 47 valid autumns. Exact annual URLs are in the source audit; Data columns supply the empirical comparison.
- Pattern Nexus / Christopher Grenke. Polar Vortex Watch 2026–27: The Early Organization Signal, Measured. September 1 investigation and subsequent September 5 update. Prior research separates wind strength from exploratory spatial geometry; that geometry method differs from the present monitor’s moment method.
- Pattern Nexus / Christopher Grenke. Polar Vortex Watch: Solar Quieting, a 10 hPa Record, and the Next Test. September 18 update. Original forecast status is retained in that earlier publication; the current article supplies later analyzed verification.
- NASA Ozone Watch. 60–90°N polar-cap mean temperature, 10 hPa. Analysis through October 30: 211.63 K, mean 211.11 K. November 5 forecast 216.48 K, mean 209.62 K. A cap mean is not a meridional temperature-gradient test.
- NASA Ozone Watch. Arctic heat-flux diagnostics and data description. Defines meridional eddy heat flux and the 45-day diagnostic. The article does not substitute that average for the monitor’s daily or ten-day values.
- Baldwin et al.. Sudden Stratospheric Warmings, Reviews of Geophysics (2021). Peer-reviewed review of mechanisms and event-dependent surface effects. General context, not a calibrated forecast for November 2026.
- Lu and Rao. Sorting sudden stratospheric warmings with the downward tropospheric influence using ERA5 and CESM2-WACCM (2026). Published March 16, 2026. Table 1 covers ERA5 events from 1940–2022 and includes November 19, 1952. Provides regional/downward-response classifications. No sample fraction is used as this event’s probability.
- Butler, Sjoberg, Seidel and Rosenlof. A sudden stratospheric warming compendium (2017). Primary documentation of the compendium, reanalysis differences and reproducible event comparisons.
- Butler et al.. Defining Sudden Stratospheric Warmings (2015). Primary discussion of differing warming definitions. Wind-threshold detection and older temperature-gradient formulations should be named explicitly.
Pattern Nexus Research · Christopher Grenke. Public/free article. Analyzed values, forecast values, historical comparisons and PN scenarios retain separate status throughout. Prepared November 1, 2026.
Article overview
Five September wind records have given way to an exceptionally weak Arctic circulation. PN checks 47 NASA autumns, the 1952 and 1968 warming benchmarks, ECMWF model disagreement, and the separate test of surface cold delivery.
What's Your Reaction?
 Like
0
 Dislike
0
 Love
0
 Funny
0
 Wow
0
 Sad
0
 Angry
0

Nexus (Christopher)
Founder of Pattern Nexus. I research markets, macro, geopolitics, AI, history, ancient systems, and the patterns most people overlook. I’m also building Market Radar, a trading scanner designed to read pressure, risk, confirmation, and setup quality before ch…
Related research
The Polar Vortex Is Stretching: A Historic November Forecast, and the Cold Outbreak That Hasn't Happened
polar vortex, November 2026, Arctic polar vortex, sudden stratospheric warming, NASA Ozone Watch, ECMWF, vortex collapse, planetary waves, …
10 shared topics, same research avenue.
The Polar Vortex Test: Winter 2026–27, El Niño, the QBO and the Limits of Prediction
Five record-setting September polar-vortex wind days, an October shift below normal and a potentially historic El Niño set the stage for No…
6 shared topics, same research avenue.
Polar Vortex Watch 2026–27: The Sun Quieted, the Vortex Hit a Record — Now the Real Test Begins
The early-season Arctic vortex has now crossed from unusual into a verified date-matched record at 10 hPa. At the same time, NOAA reports v…
6 shared topics, same research avenue.
Polar Vortex Watch 2026–27: Early Arctic Organization Is Now Pressing Historical Extremes
What started as an unusual late-August structural signal is becoming something much harder to dismiss. The 10-hPa Arctic winds have moved a…
7 shared topics, same research avenue.
Polar Vortex Watch 2026–27: The Early Organization Signal, Measured
The wind-speed test and the geometry test give different answers. Pattern Nexus compares 48 autumn wind series and 744 historical height fi…
6 shared topics, same research avenue.
The Vacuum Program: Zero-Point Energy, UAP Disclosure, and the Physics Hiding in Plain Sight
NASA studied quantum-vacuum propulsion. DIA commissioned papers on vacuum-energy extraction, negative energy, wormholes, and spacetime engi…
4 shared topics, same research avenue.
Sunset on Mars: The Blue Hour That Shows What Happened to a World
A sunset on Mars is not just a beautiful image from another planet. It is a physics lesson, an atmospheric fossil, and a reminder that Mars…
2 shared topics, 1 shared asset, same research avenue.
The World I’ve Been Mapping Is Taking Shape
I connect the developments now taking shape across AI infrastructure, private power, critical minerals, the Iran energy shock, digital doll…
2 shared topics, 1 shared asset.
Comments (0)
Security Check
Please complete the captcha to verify you are human.