

The Polar Vortex Is Stretching: A Historic November Forecast, and the Cold Outbreak That Hasn't Happened
polar vortex, November 2026, Arctic polar vortex, sudden stratospheric warming, NASA Ozone Watch, ECMWF, vortex collapse, planetary waves, wave-2, stratospheric warming, 10 hPa, 60N zonal wind, winter 2026-2027, Arctic Oscillation, QBO, El Niño, North American winter, cold outbreaks, stratosphere, Pattern Nexus
polar vortex, November 2026, Arctic polar vortex, sudden stratospheric warming, NASA Ozone Watch, ECMWF, vortex collapse, planetary waves, wave-2, stratospheric warming, 10 hPa, 60N zonal wind, winter 2026-2027, Arctic Oscillation, QBO, El Niño, North American winter, cold outbreaks, stratosphere, Pattern Nexus
Jump to a section
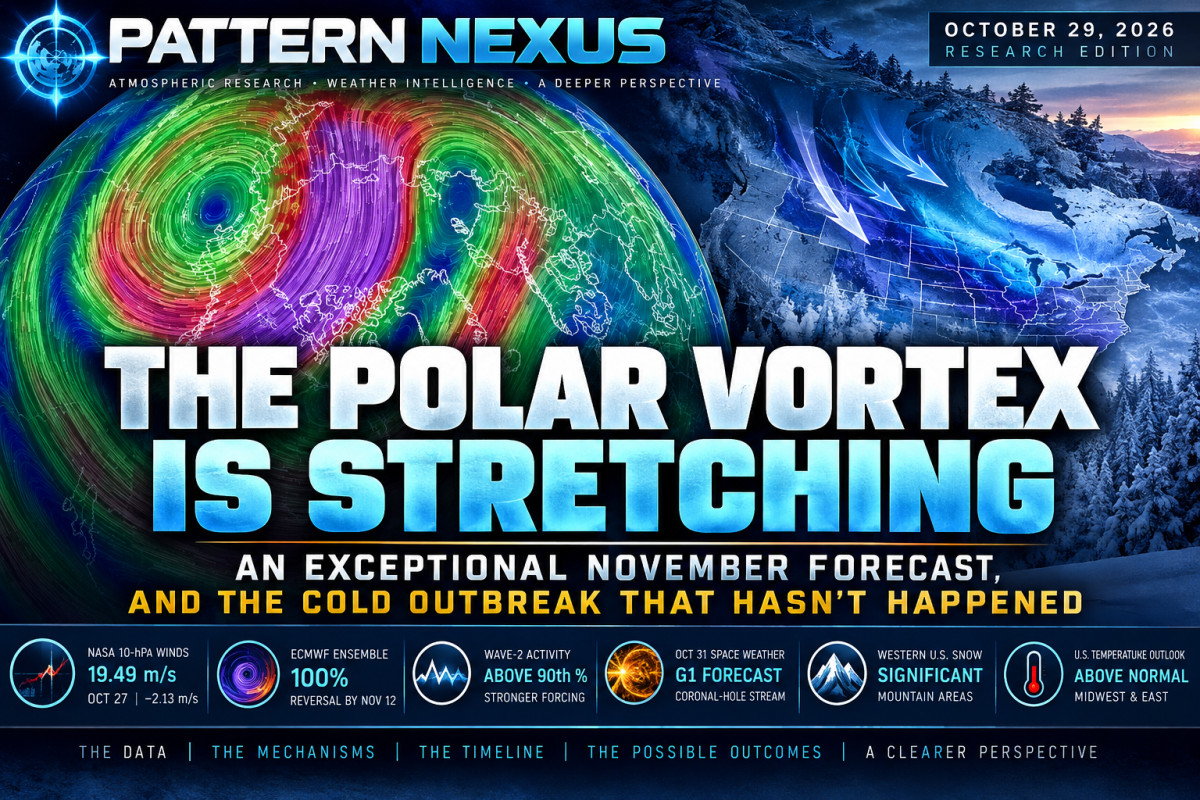
The Polar Vortex Is Stretching: An Exceptional November Forecast, and the Cold Outbreak That Hasn't Happened
The early-November 2026 Arctic stratospheric forecast has escalated sharply. Observed winds are weakening, planetary-wave forcing is increasing, and ECMWF ensembles now strongly favor an unusually early wind reversal. The North American cold-weather headlines are moving faster than the surface evidence.
1. The story has moved beyond one forecast graph
Over the past several days, coverage of the Arctic polar vortex has shifted from a relatively specialized atmospheric discussion into national headlines warning of a historic collapse and bitter cold across the United States. The headlines are drawing on a genuine development: an unusually strong model signal for early-November weakening of the Northern Hemisphere stratospheric polar vortex. The cold-outbreak claims are a separate proposition, and the current evidence does not yet support treating them as the same event.
We have been following the progression through NASA's daily 60°N zonal-mean wind measurements, date-matched historical records, ECMWF vortex geometry and planetary-wave diagnostics, NOAA space-weather observations, and the tropospheric forecasts from the Weather Prediction Center and Climate Prediction Center. The sequence matters because the atmosphere is a vertically coupled system, but changes at 30 kilometers do not instantly determine temperatures at ground level.
During September 16–20, NASA's series registered five consecutive date-matched historical maximum exceedances in 10-hPa winds. Those early-season westerlies were unusually strong for their calendar dates. Six weeks later, the circulation has become weaker and increasingly distorted, and models are forecasting a potential reversal earlier than any confirmed major warming in the historical catalog used by the ECMWF-based monitor. Neither phase should be reduced to a single photograph of a snowstorm.

2. What NASA actually measures
The reference series is the zonal-mean zonal wind at 60°N and 10 hPa. The pressure level corresponds to roughly 30–32 kilometers, or 19–20 miles, above the surface, depending on atmospheric conditions. Sixty degrees north is a latitude circle approximately 20,000 kilometers in circumference, not a 100-by-100-mile sample or a location centered on one longitude. The metric averages the east–west wind component around that full circle.
This is the standard dynamical diagnostic for Northern Hemisphere stratospheric vortex strength and the wind-reversal criterion used in identifying major sudden stratospheric warmings. It does not measure the entire vortex's area, centroid, geometry, temperature, or surface weather. A vortex can become elongated or displaced even when the zonal-mean wind remains positive. We therefore use the wind series together with geopotential-height structure, planetary-wave harmonics, heat flux and polar-cap temperatures.
NASA labels the data source MERRA2 but specifies that data beginning August 1, 2026 are supplied by GEOS FP. Its date-matched reference climatology spans 1978/79–2025/26. Rows labelled Fcst=0 are analyzed values; positive Fcst labels identify forecast lead times, not additional observations.
Latest analyzed NASA wind
| October 27, 2026 · Fcst=0 | Value |
|---|---|
| 60°N, 10-hPa wind | 19.49 m/s |
| October 26 analyzed wind | 21.62 m/s |
| Day-over-day change | −2.13 m/s |
| Date-matched historical mean | 22.21 m/s |
| Departure from mean | −2.72 m/s (−12.2%) |
| Historical 90th percentile | 29.05 m/s |
| Departure from 90th percentile | −9.56 m/s |
| Historical maximum | 31.20 m/s |
| Departure from maximum | −11.71 m/s |
The decline is material over one day, but 19.49 m/s remains a positive westerly wind. The latest analyzed observation is below normal, not an observed reversal, and it is not a new low-wind record.
The forecast is much more extreme
| Target date | NASA Fcst lead | Forecast wind | Mean anomaly |
|---|---|---|---|
| Oct 28 | 6 h | 15.85 m/s | −7.07 |
| Oct 29 | 12 h | 13.73 | −9.61 |
| Oct 31 | 60 h | 12.23 | −12.02 |
| Nov 1 | 84 h | 8.90 | −15.96 |
| Nov 2 | 108 h | 5.21 | −20.41 |
| Nov 4 | 156 h | 0.96 | −25.00 |
| Nov 6 | 228 h | 3.26 | −23.03 |
All winds and mean anomalies are in m/s. Forecast rows are model output, not historical observations. NASA forecast issuance and lead labels can change with each update.
For November 4, the projected 0.96 m/s would be 12.68 m/s below the date-matched historical minimum in NASA's reference series. That is a potentially exceptional forecast departure. It is not a new record until a corresponding analyzed value is observed. NASA's deterministic forecast remains just above zero; it does not independently predict a reversal within this horizon.

3. The ECMWF forecast has escalated
The independent polarvortex.earth monitor, using the October 29 00Z ECMWF cycle, reports 50 of 50 conventional ensemble members reversing the 10-hPa 60°N wind by November 12. Forty-eight members reverse by November 7. The AI-based AIFS ensemble is less aggressive: 22 of 50 reverse by November 7 and 39 of 50 by November 12. The deterministic high-resolution run projects easterly flow around November 9, reaching approximately −4.9 m/s.
These numbers deserve attention, but the ensemble percentages are raw member fractions, not independently calibrated event probabilities. The conventional and AI ensembles disagree about the timing and likelihood of the earlier reversal window. They should not be averaged or represented as absolute certainty. A model run can also change substantially as the target date approaches.
| Reversal by date | ECMWF conventional ENS | ECMWF AI ENS |
|---|---|---|
| November 2 | 0/50 (0%) | 0/50 (0%) |
| November 7 | 48/50 (96%) | 22/50 (44%) |
| November 12 | 50/50 (100%) | 39/50 (78%) |

According to the monitor's historical catalog, no Northern Hemisphere major warming has occurred before November 28 since 1959, with 1968 and 2025 cited as the earliest. A verified early-November major event would therefore be exceptional in that record. Formal event classification requires examining the thermal evolution and accepted dynamical criteria, not simply declaring a warming from one forecast line crossing zero.
4. The physical mechanism: planetary waves are pushing upward
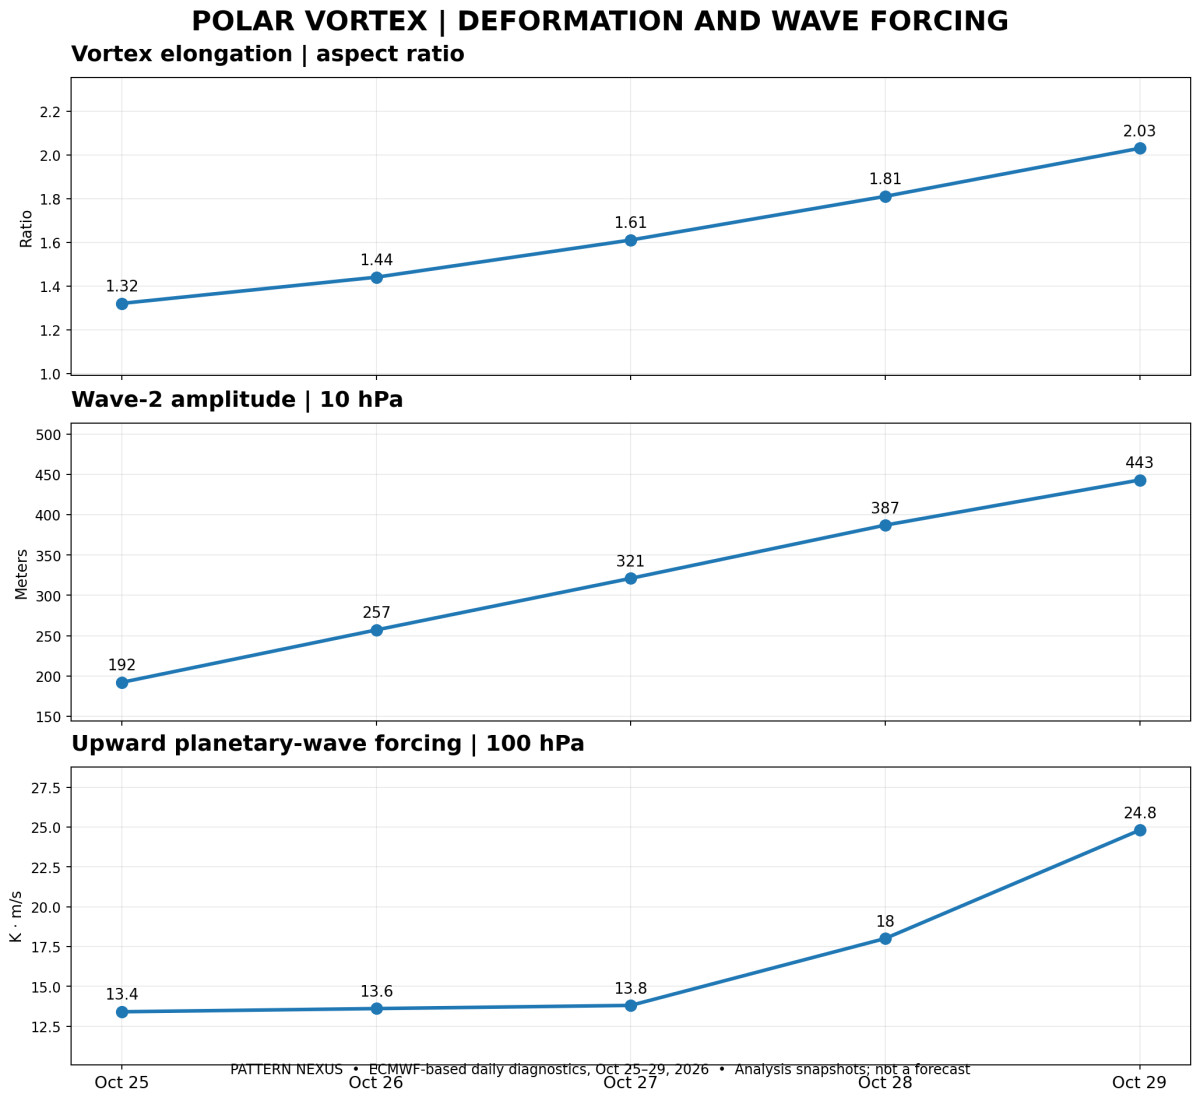
The observed changes are not limited to the wind-speed average. ECMWF-based spatial diagnostics show the vortex becoming increasingly elongated while the centroid remains relatively close to the geographic pole. The October 29 aspect ratio is approximately 2.03, compared with 1.81 the previous day. A projected ratio near 2.97 around November 1 would indicate an exceptionally stretched vortex for the date.
Wave-1 and wave-2 are the first two longitudinal harmonics of the stratospheric geopotential-height field. Wave-1 is commonly associated with shifting the vortex away from the pole; wave-2 can deform it into two lobes and, in sufficiently strong events, contribute to a split. Neither wave amplitude alone proves a split. Today's diagnostics report wave-1 near 335 meters and wave-2 near 443 meters, with the latter above its date-matched 90th percentile.
At 100 hPa, the poleward eddy heat-flux diagnostic over 45–75°N has increased to approximately 24.8 K·m/s, with a ten-day mean of 14.1 K·m/s. This quantity is used as a proxy for upward planetary-wave activity entering the stratosphere; it is not a direct measurement of surface heat being transported to the pole. The forecast peaks near 29.1 K·m/s around November 1.
Planetary waves generated and amplified within the tropospheric circulation can propagate upward, deposit momentum and decelerate the stratospheric westerlies. That is a physically established mechanism. The observed increase in wave-2 amplitude, vortex elongation and 100-hPa heat flux is consistent with this process, although the eventual magnitude of the response remains forecast-dependent.
5. The atmosphere has several layers, and the cold is not at the surface yet
The latest analyzed NASA winds also weakened at 70 and 100 hPa. On October 27, the 70-hPa wind was approximately 9.07 m/s, down 1.74 m/s in a day and 3.49 m/s below its date-matched mean. The 100-hPa wind was approximately 9.59 m/s, down 2.24 m/s and 3.31 m/s below its mean. Both were below their respective historical 10th percentiles for the date.
That shows anomalously weak circulation at multiple stratospheric levels. It does not by itself prove downward propagation. To establish coupling, we need time-height fields of polar-cap geopotential height, temperature, potential vorticity and wind anomalies, followed by a consistent tropospheric response. A 250-hPa hemispheric field was not quantitatively verified in this review. The 500-hPa evidence is available through NOAA CPC's forecast-height patterns, which currently show substantial Canadian ridging rather than a broad eastern U.S. Arctic trough.
ECMWF's current 10-hPa polar-cap mean temperature is approximately 211 K, near its date-matched normal of 211 K. The vortex is deforming and the winds are weakening, but the available analyzed polar-cap temperature does not yet demonstrate an exceptional warming. Wind, temperature and circulation structure must be evaluated together.
6. Why the surface-cold headlines are ahead of the evidence
National headlines are now describing a historic polar-vortex collapse threatening bitter cold in parts of the United States. The first half of that statement refers to a potentially historic forecast in the stratosphere. The second half assumes a subsequent surface-weather response that NOAA's current medium-range forecast does not show.
NOAA CPC's October 28 outlook for November 3–7 favors above-normal temperatures across much of the central and eastern United States. The probability of above-normal temperatures exceeds 70% from portions of the Mid-Atlantic toward the Great Lakes. For November 5–11, the outlook continues to favor above-normal temperatures over the contiguous United States, with regional differences in confidence. The projected 500-hPa pattern includes an expansive ridge over west-central Canada and an eastern Pacific trough.
At shorter range, NOAA WPC describes Pacific systems, a front progressing from the Upper Great Lakes toward the East Coast, and western mountain snowfall. Its October 29 heavy-snow guidance highlights high-elevation Sierra Nevada and Intermountain West snowfall associated with a deep western trough, including 40–70% probabilities of exceeding six inches in favored terrain. Those probabilities are for mountainous areas and are not confirmation of unusual low-elevation snow or national cold records.
Cold outbreaks can occur without a major sudden stratospheric warming, and a major warming can occur without producing a major U.S. cold outbreak. If the forecast stratospheric event verifies, a possible surface response would generally be evaluated over subsequent weeks, with the location and timing influenced by the tropospheric circulation, blocking patterns, ENSO and other variability. There is no direct path from a November 9 stratospheric wind reversal to guaranteed bitter cold in a particular U.S. state on November 10.
7. Solar activity is being monitored separately
The solar and geomagnetic timeline remains relevant to the broader Pattern Nexus research program, but it must be kept separate from the established dynamical evidence. NOAA associated the October 21–23 geomagnetic disturbance with coronal-hole high-speed-stream influences. Conditions subsequently eased. On October 29, the latest three-day SWPC forecast reported a maximum observed three-hour Kp of 2 in the preceding 24 hours and predicted G1 geomagnetic conditions October 31 from an anticipated recurrent positive-polarity coronal-hole high-speed stream.
The expected October 31 disturbance had not been verified as an arrival at the time of this update. SWPC reported no S1-level proton radiation storm over the preceding 24 hours and assigned a 1% daily S1-or-greater probability through October 31. No significant new Earth-directed CME impact was confirmed in the operational evidence reviewed.
Solar-wind coupling to the magnetosphere depends on plasma speed, density and the orientation of the interplanetary magnetic field, especially sustained southward Bz. A coronal-hole stream, a CME impact and energetic-particle precipitation are different physical processes and cannot be used interchangeably. The proposed pathway through particle precipitation, NOx/HOx chemistry and ozone changes requires independent atmospheric measurements before a contribution to this vortex event can be assessed.
At present, the observed planetary-wave forcing is the more directly supported explanation for the evolving stratospheric dynamics. Temporal overlap with solar activity is a research question, not proof of causation.
8. The September records and the October transition
| Date | Observed 10-hPa wind | Historical maximum | Exceedance |
|---|---|---|---|
| September 16 | 11.71 | 11.20 | +0.51 |
| September 17 | 13.54 | 12.07 | +1.47 |
| September 18 | 14.14 | 12.93 | +1.21 |
| September 19 | 14.51 | 13.73 | +0.78 |
| September 20 | 14.62 | 13.84 | +0.78 |

Wind values in m/s, compared with the date-matched NASA historical reference series.
The September sequence recorded five consecutive historical maximum exceedances for those specific calendar dates. The current October circulation is almost the opposite of that early-season pattern: below-average winds, increasing vortex deformation and a strong forecast of further deceleration. The September records do not prove that a November reversal must occur. They provide a measurable baseline for how rapidly the seasonal circulation has changed.
There is an additional geographic point in the October analysis. The vortex centroid has moved closer to the pole while its aspect ratio has increased. Describing the entire event as simply a displaced vortex would miss the stronger evidence for elongation and wave-2 deformation. The supplied 10-hPa wind map is a useful spatial illustration, but the streamlines alone do not diagnose a confirmed split or provide surface temperatures.
9. What would confirm the next stage?
The immediate sequence to verify is straightforward. First, the forecast wave-forcing maximum near November 1 needs to appear in analyzed 100-hPa data. Second, the forecast vortex stretching and deceleration must persist as model lead time shortens. Third, the NASA analyzed 60°N wind needs to approach or cross zero, rather than merely showing increasingly extreme forecast anomalies. A formally classified major warming also requires appropriate thermal and dynamical confirmation.
After that, the lower-stratospheric and tropospheric circulation must be monitored for a sustained descending signal. A negative Arctic Oscillation, altered North Atlantic blocking or an amplified North American trough could increase cold-delivery risk in some regions, but their presence, timing and location cannot be inferred from the 10-hPa wind alone. The surface forecasts and observed temperature anomalies will ultimately determine whether any specific cold-weather claim was correct.
10. Pattern Nexus documented the signal before the national headlines
There is a dated public record for the research, and it is more specific than claiming that we forecast the exact November outcome months ago. In early September, Pattern Nexus was already documenting the unusually rapid organization of the autumn stratospheric vortex. The September 4 analysis registered 5.48 m/s at 10 hPa, only 0.07 m/s below the date-matched historical maximum. The article explicitly separated analyzed values from projected records, then continued updating the comparison as each new analyzed day arrived.
By September 18, our published watch had confirmed the September 16 record exceedance and examined the projected transition from exceptional positive wind anomalies toward weakening later in September. We also identified an emerging planetary-wave heat-flux forecast as a competing explanation for subsequent deceleration. Those September publications preceded the late-October mainstream coverage of an early-November reversal by several weeks.
The broader winter regression report published in October documented the full five-day September 16–20 record sequence, the subsequent below-normal October wind anomaly, the role of El Niño and the westerly QBO, and the need to test the wave-1/wave-2 structure and vertical coupling before issuing surface-weather conclusions. It specifically identified late-October and early-November stretching and weakening as a forecast risk. That was the established research trajectory before the October 27–29 news cycle.
That is a stronger and more defensible claim than saying we predicted a collapse months in advance. The earlier work identified the measurements, preserved the historical baselines and established tests that the late-October forecasts can now be judged against. The outcome remains open.
Published Pattern Nexus research
- Early Arctic Organization and Historical Extremes — September watch
- Solar Quieting, a 10-hPa Record, and the Next Test — September 18 update
- Winter 2026–27 Polar Vortex, El Niño, QBO and Regression — October research
11. Where the circulation can go from here
Scenario A — Early reversal, limited surface coupling
The conventional ECMWF ensemble verifies, the 60°N winds reverse in the first half of November, and the stratosphere experiences a historically early disruption. The lower-stratospheric anomaly either dissipates or fails to organize a sustained tropospheric response. The North American temperature distribution remains governed mainly by the Pacific jet, existing ridges and troughs, and synoptic-scale weather. This would be a major stratospheric event without an equally exceptional U.S. cold outbreak. It is physically plausible and consistent with the current warm CPC outlook.
Scenario B — Reversal followed by delayed North American cold
The upper-stratospheric reversal verifies and the circulation anomaly extends downward through 70 and 100 hPa over subsequent weeks. If the troposphere responds with persistent high-latitude blocking and a favorable trough configuration, Arctic air could move into selected parts of North America later in November or December. The specific cold corridor would depend on where the blocking and jet-stream anomalies develop: western Canada and the northern Plains, the Great Lakes and eastern U.S., or elsewhere. A cold outbreak would require its own verifying surface-temperature and 500-hPa evidence; a stratospheric reversal alone cannot determine its location.
Scenario C — Strong deformation, no major wind reversal
Wave forcing increases and the vortex stretches substantially, but the 10-hPa 60°N zonal-mean wind stays positive. This would still be a significant early-season circulation disturbance, potentially followed by recovery or repeated wave events later in winter. The distinction between a stretched vortex, displaced vortex and actual split must be preserved in the spatial potential-vorticity fields. The most dramatic reversal headlines would not verify under this scenario.
Scenario D — Multiple disruptions and a volatile winter pattern
An initial November disturbance changes the background stratospheric circulation, followed by renewed wave forcing and additional weakening later in winter. The tropospheric response could alternate between warm and cold regimes rather than deliver one prolonged freeze. The very strong El Niño background, QBO phase and evolving Pacific/North Atlantic patterns could modify the preferred pathways. A single November ensemble forecast cannot resolve a December–February seasonal distribution, but the recurrence of blocking and wave events would become an important research variable.
12. What the next two weeks need to verify
October 30–November 2: Monitor the analyzed 100-hPa heat flux and 10-hPa wave-2 amplitude against the projected peaks; compare successive ECMWF conventional and AI ensembles for run-to-run stability. Confirm whether the October 31 coronal-hole stream arrives, using measured plasma speed, density, IMF Bz and Kp rather than forecast dates alone.
November 3–7: Track the NASA Fcst=0 wind against the projected approach to zero. A forecast low below the historical minimum is not an observed record. Examine 10-, 30-, 50-, 70- and 100-hPa polar-cap temperature and geopotential-height anomalies, together with the vortex centroid and contour topology.
November 8–12: Test whether the ensemble-predicted reversal actually occurs, its duration and its classification. Monitor whether the conventional/AI discrepancy narrows or widens. Reversal at 10 hPa is an atmospheric event, not a surface forecast.
Mid-November onward: Look for coherent descending height anomalies, AO/NAO shifts, sustained blocking and changes in North American 500-hPa trough/ridge patterns. Compare these against official CPC and WPC guidance and observed regional temperature anomalies. Do not attribute surface cold to the stratosphere until the spatial and temporal sequence supports that interpretation.
Pattern Nexus View
We've followed this circulation through its September records, October displacement and deformation, the changing solar environment, and the transition into the current early-November forecast. The data now support a significant stratospheric event watch. The strongest observed signals are the weakening winds at multiple pressure levels, the increase in upward planetary-wave forcing, and the increasingly elongated vortex geometry.
The ECMWF ensemble is projecting an exceptionally early reversal, with meaningful disagreement remaining between the conventional and AI systems. NASA's forecast independently projects near-zero winds but has not yet crossed into easterlies. Those are model outcomes awaiting verification, not events already recorded in the atmosphere.
For North America, the operational forecasts still show a relatively warm central and eastern United States during the first part of November. The current western trough and mountain snow are real weather features, but they are not evidence of a future stratospheric reversal reaching the surface. If a major disruption occurs, the subsequent weeks will determine whether the atmospheric signal propagates downward and which regions, if any, experience a sustained cold response.
The vortex forecast is extraordinary. The bitter-cold forecast is not yet established.
Sources and operational data
- NASA Ozone Watch — 2026 60°N zonal-mean 10-hPa wind and historical climatology
- Polarvortex.earth — ECMWF 00Z Arctic vortex, ensembles, geometry, heat flux and polar temperature (independent ECMWF-based analysis, not an official forecast)
- Polarvortex.earth — October 29 briefing and historical context
- NOAA CPC — 6–10-day and 8–14-day temperature, precipitation and 500-hPa outlook discussion
- NOAA WPC — probabilistic winter-weather and short-range forecast discussions
- NOAA SWPC — October 29 three-day geomagnetic and solar-radiation forecast
- NOAA SWPC — daily geomagnetic indices
- The Weather Channel — October 27–28 coverage of early-November stretching and El Niño
- Boston Globe, October 28 — Judah Cohen and the unusually early forecast
- Gizmodo, October 28 — ECMWF reversal coverage and Judah Cohen interview
- Pattern Nexus — early September vortex watch
- Pattern Nexus — September 18 wave-forcing and record update
- Pattern Nexus — October winter regression
What's Your Reaction?
 Like
0
 Dislike
0
 Love
0
 Funny
0
 Wow
0
 Sad
0
 Angry
0

Nexus (Christopher)
Founder of Pattern Nexus. I research markets, macro, geopolitics, AI, history, ancient systems, and the patterns most people overlook. I’m also building Market Radar, a trading scanner designed to read pressure, risk, confirmation, and setup quality before ch…
Related research
The Vacuum Program: Zero-Point Energy, UAP Disclosure, and the Physics Hiding in Plain Sight
NASA studied quantum-vacuum propulsion. DIA commissioned papers on vacuum-energy extraction, negative energy, wormholes, and spacetime engi…
Polar Vortex Watch 2026–27: The Early Organization Signal, Measured
The wind-speed test and the geometry test give different answers. Pattern Nexus compares 48 autumn wind series and 744 historical height fi…
The Polar Vortex Test: Winter 2026–27, El Niño, the QBO and the Limits of Prediction
Five record-setting September polar-vortex wind days, an October shift below normal and a potentially historic El Niño set the stage for No…
⚛️ Big Tech’s Fusion Bet: How AI’s Energy Demand Is Rewriting Physics
The AI revolution isn’t just changing software — it’s rewriting the energy equation of civilization. As machine intelligence accelerates, B…
Comments (0)
Security Check
Please complete the captcha to verify you are human.