

The Polar Vortex Is Breaking Down in November — What the Actual Data Show
Eight consecutive record-low Arctic wind days, an exceptionally warm polar stratosphere and an early-November reversal forecast. What the measurements mean for winter weather.
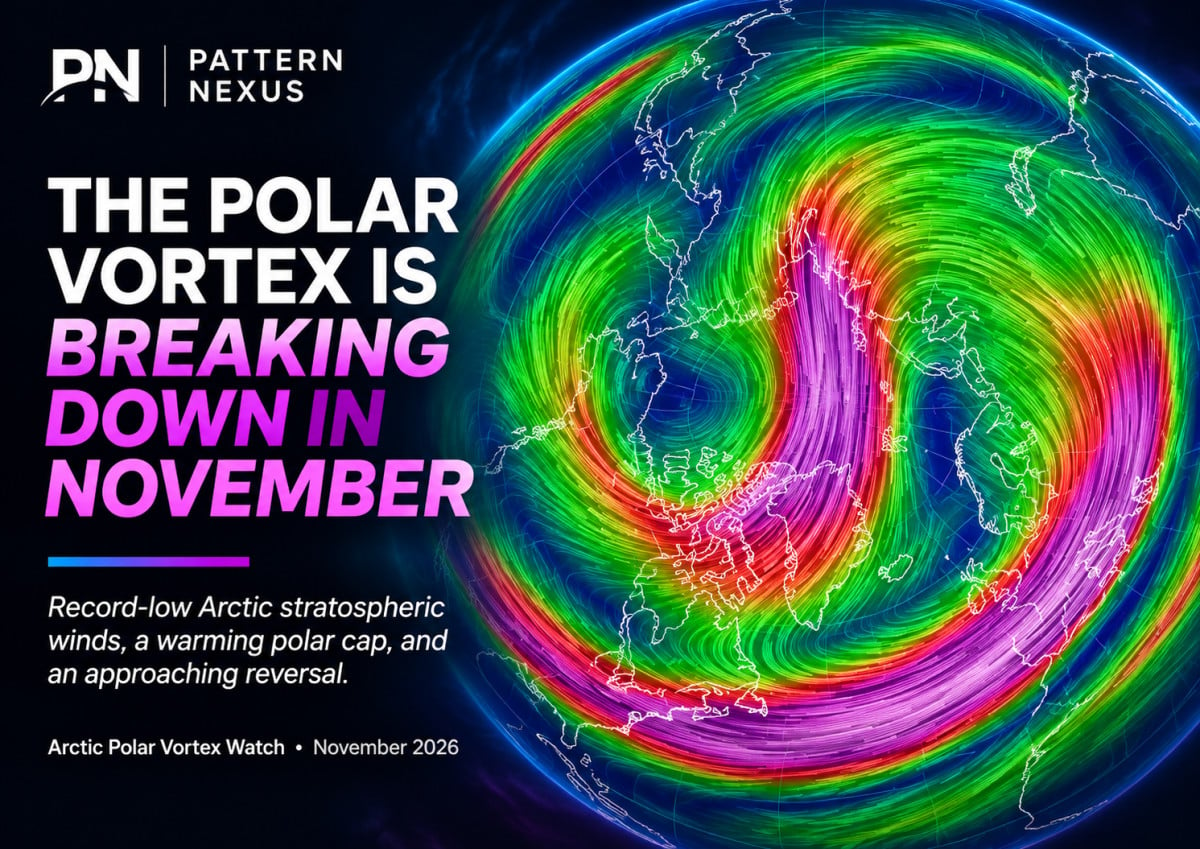
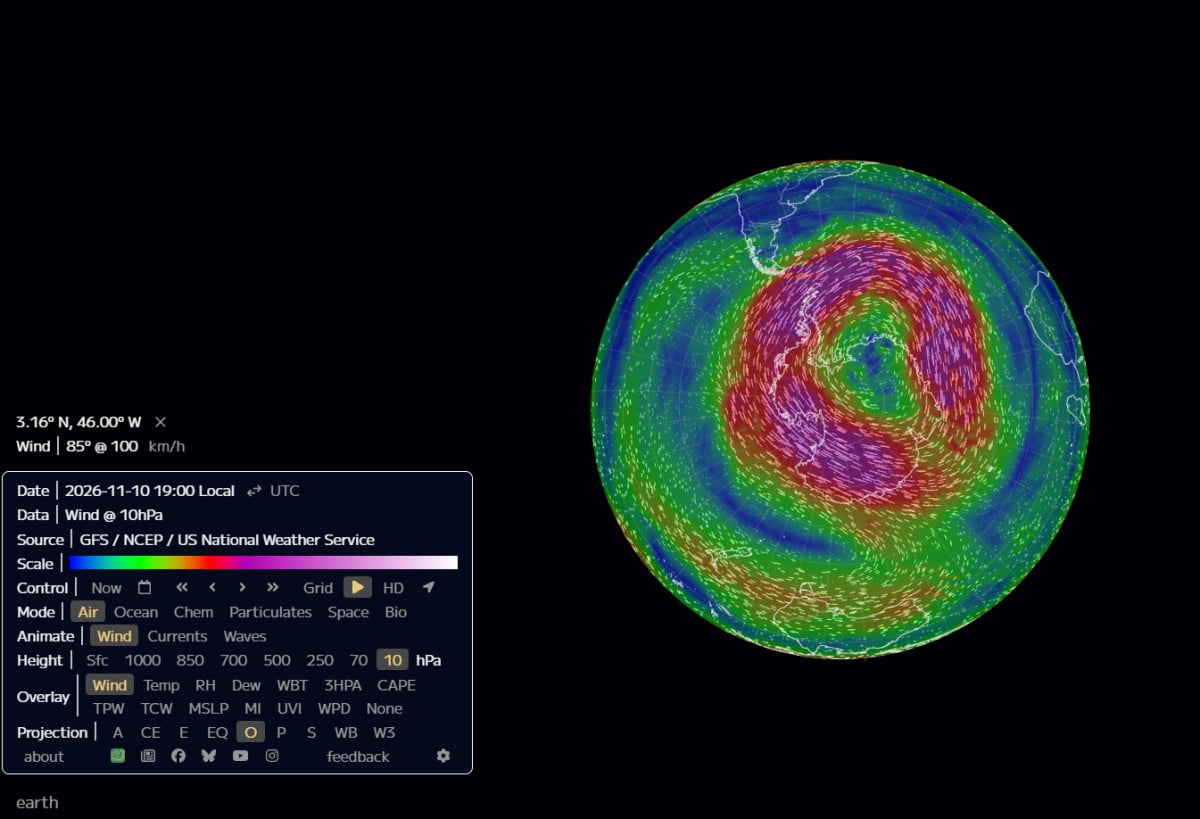
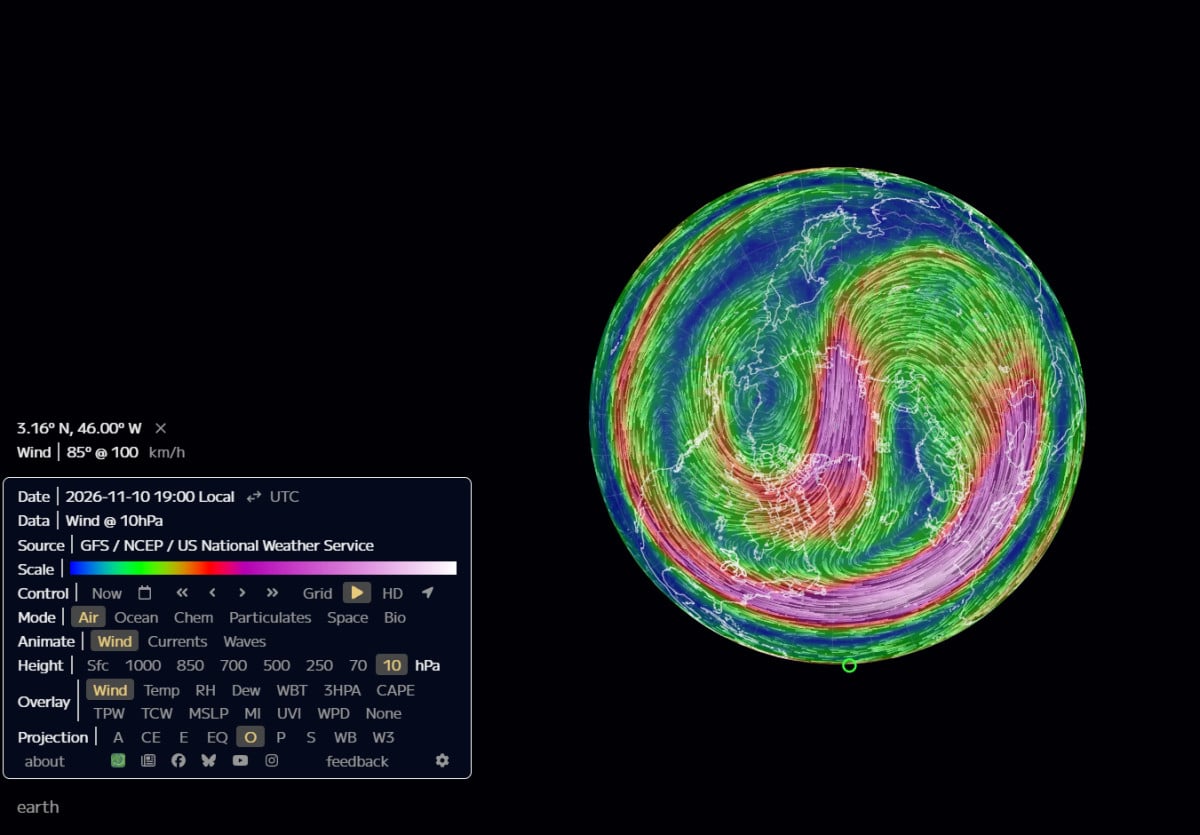
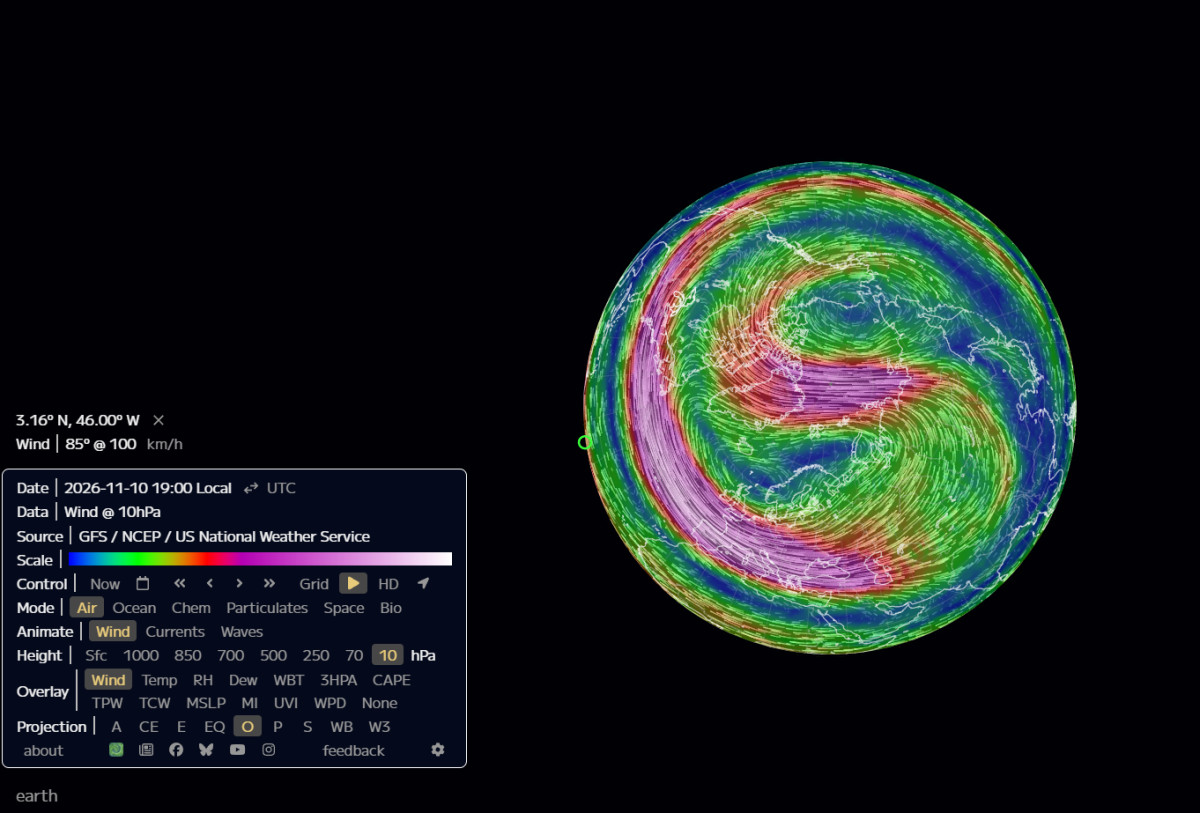
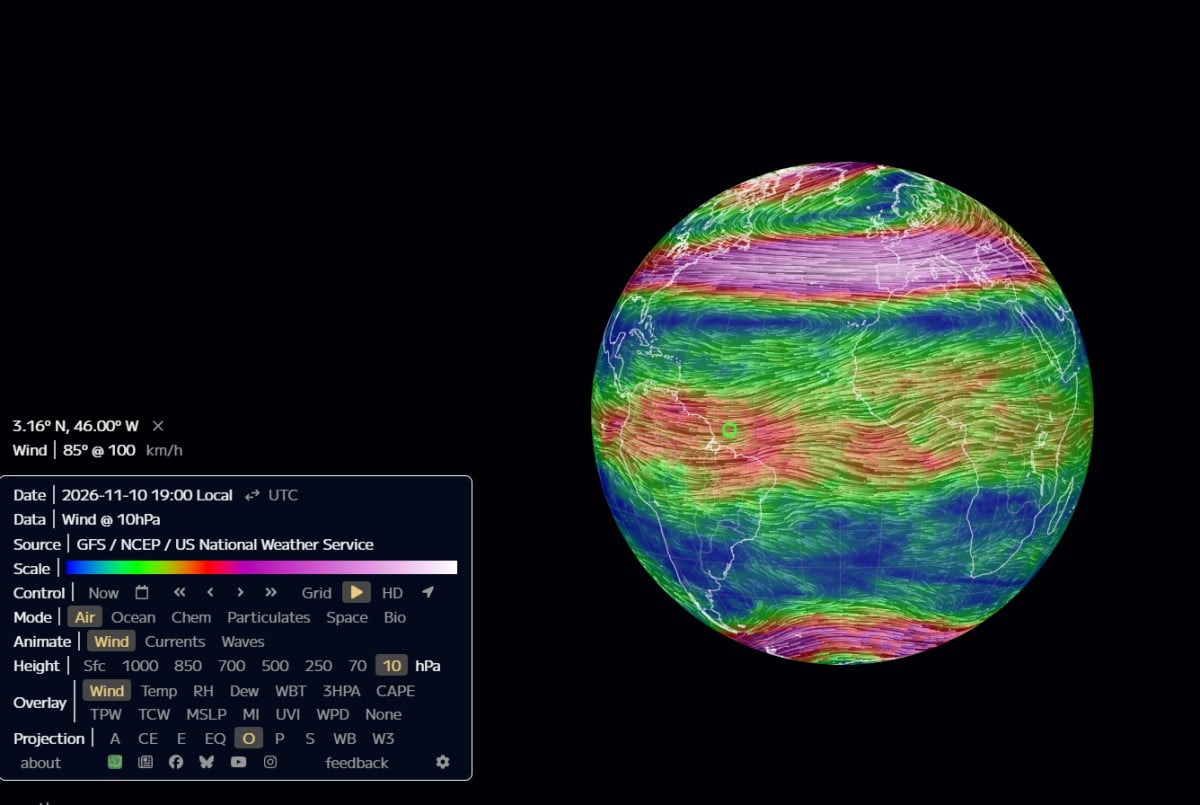
Eight consecutive Arctic wind records, a record-warm polar stratosphere, and an approaching reversal. The upper atmosphere is undergoing an extraordinary early-season disruption. The surface-weather outcome is still being determined.
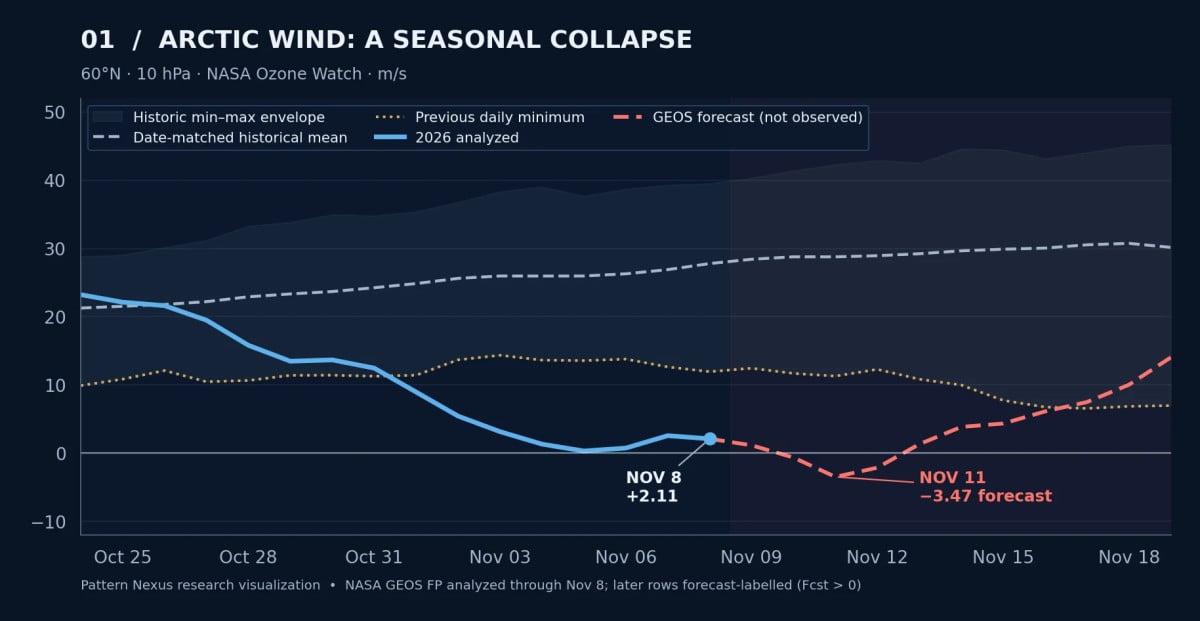
- Record-low winds. The 60°N, 10-hPa Arctic index registered eight consecutive same-date record lows from November 1–8.
- Observed versus forecast. The latest NASA analyzed wind in this report is +2.11 m/s on November 8. A transition to easterly winds remains a November 10–12 model projection.
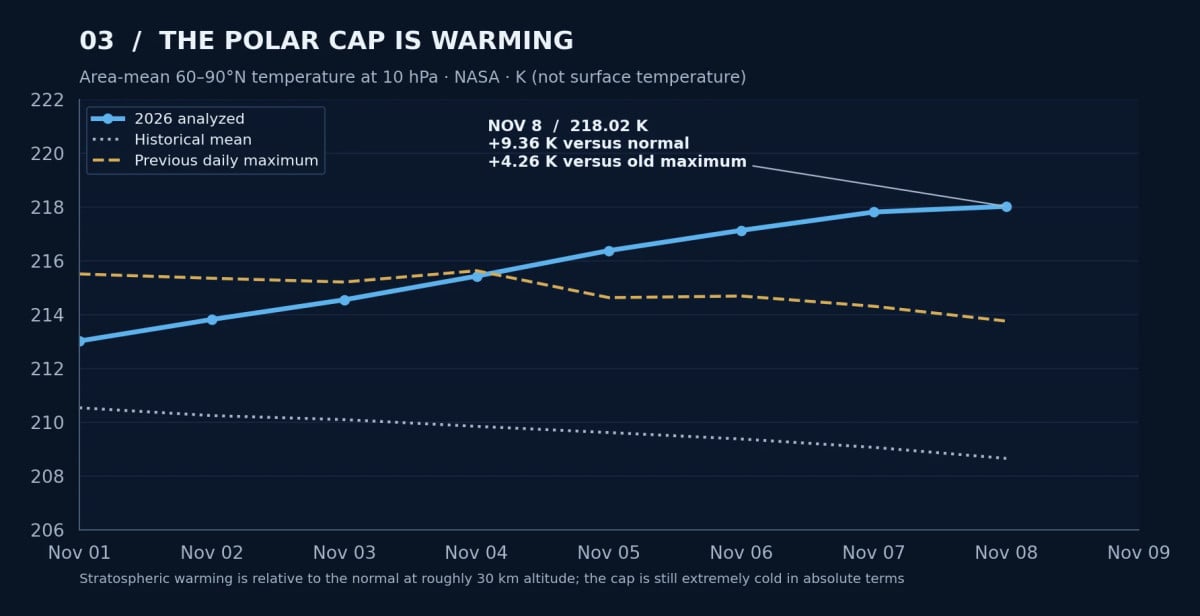
- The polar cap is unusually warm. NASA measured 218.02 K on November 8, 9.36 K above that day’s historical mean.
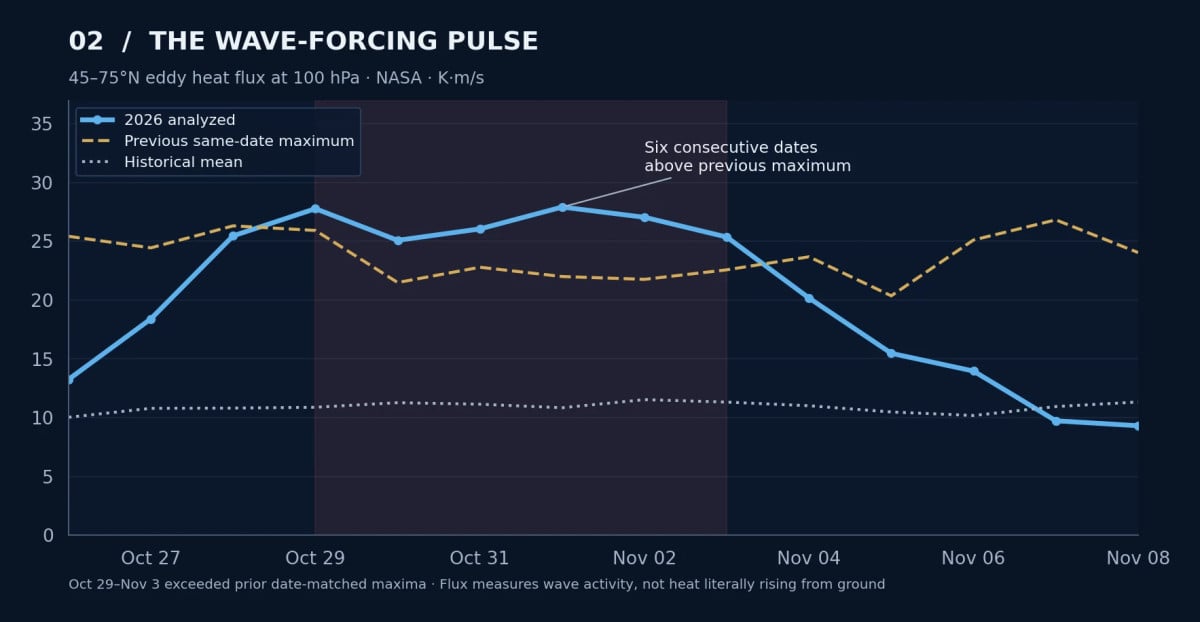
- A wave pulse preceded the slowdown. The 100-hPa eddy heat-flux index exceeded its same-date historical maximum six days in a row, October 29–November 3.
- The disruption is vertically structured. Weakening is present from 10 to 100 hPa, but the strongest negative departure is at 10 hPa.
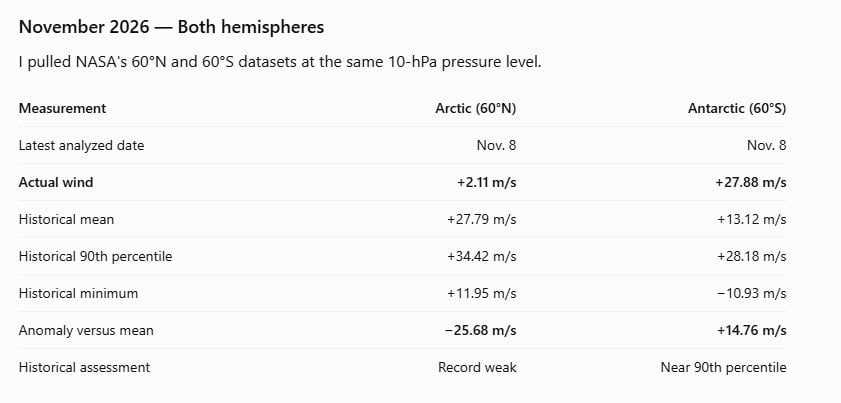
- Both hemispheres look different. The southern vortex is still unusually strong for the date; the global wind map does not show one combined pole-to-pole vortex.
- Surface impacts remain conditional. A reversal can affect blocking and cold-delivery odds over subsequent weeks; it does not guarantee an immediate U.S. cold outbreak.
Analysis snapshot: November 10, 2026. NASA GEOS FP analyzed through November 8; ECMWF monitoring through its November 10 model cycle; NOAA CPC outlook issued November 10.
WIND — RECORD LOW
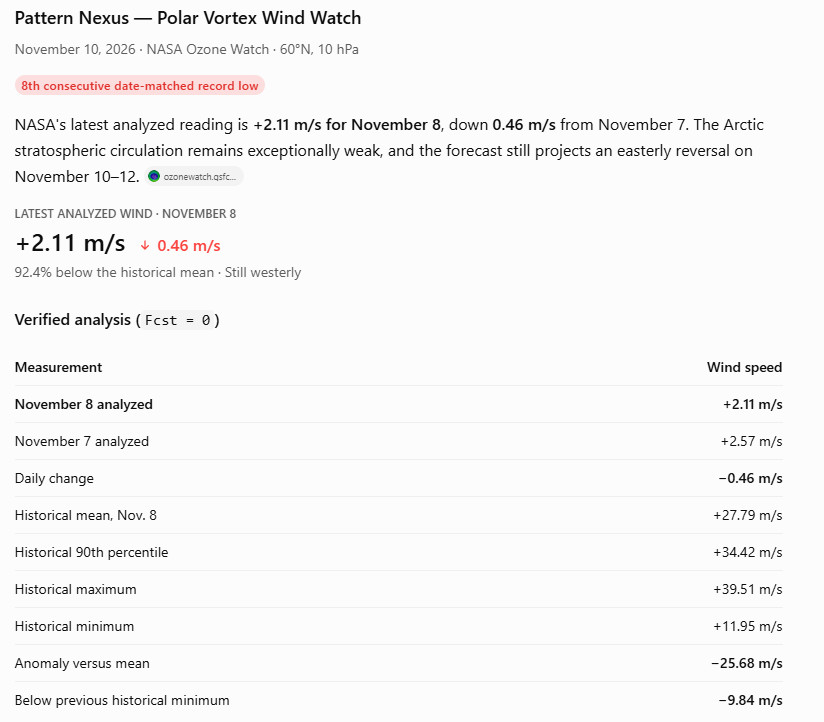
+2.11 m/s analyzed versus +27.79 m/s historical mean, November 8.
TEMPERATURE — RECORD HIGH
218.02 K polar-cap temperature versus 208.66 K historical mean, November 8.
UPWARD WAVES — RECORD PULSE
100-hPa heat flux exceeded previous date-matched maxima October 29–November 3.
WEATHER — NOT YET DETERMINED
Downward coupling, blocking and regional cold delivery still need to be evaluated.
01 · CURRENT STATE
The circulation has moved beyond an unusual-looking image
I've been tracking this vortex since late August, when its organization was already unusual for that point in the season. September brought five date-matched wind records on the strong side of the historical distribution. October brought weakening, displacement, and an increasingly powerful burst of planetary-wave activity. Now, in early November, the circulation has moved to the opposite extreme.
From November 1 through November 8, the Arctic 60°N, 10-hPa zonal wind set eight consecutive date-matched record lows in NASA's historical comparison. The polar stratosphere is also warmer than any previous November 8 in that same series. Multiple numerical weather models project the high-altitude winds turning easterly around November 10–12.
This is occurring roughly 30 kilometers above the surface. It is a major development in the atmosphere, but it is not itself a forecast for snow or freezing temperatures in any particular city. We have to follow the circulation all the way down before making that leap.
Current status · November 10: Eight analyzed daily wind records through November 8. Analyzed Arctic wind still westerly at +2.11 m/s, compared with a +27.79 m/s historical average. NASA projects negative winds on November 10–12; ECMWF also projects a reversal around November 11. The reversal is in the models; NASA's latest daily analyzed value has not crossed zero. [1][2]
02 · ARCTIC WIND RECORD
Eight consecutive records, and the vortex is nearly stationary in the zonal average
At 60°N and 10 hPa, NASA measures the average east–west wind all the way around the latitude circle. A positive number means the mean flow is westerly. A negative number means it has reversed to easterly. This is a standard diagnostic of the stratospheric polar vortex, not a measurement of the fastest regional jet on a wind map.
| NASA 60°N, 10 hPa — analyzed November 8 | Value |
|---|---|
| 2026 wind | +2.11 m/s |
| Historical mean | +27.79 m/s |
| Historical 90th percentile | +34.42 m/s |
| Previous same-date minimum | +11.95 m/s |
| Historical maximum | +39.51 m/s |
| Departure from mean | −25.68 m/s |
| Below previous daily minimum | 9.84 m/s |
The mean circulation is 92.4% weaker than the date-matched historical average in this single diagnostic. That does not mean 92.4% of the vortex's mass, energy, or area has disappeared. It measures the decline in one specific east–west wind index.
The sequence is also measurable. The wind fell from +23.23 m/s on October 24 to just +0.32 m/s on November 5. It briefly recovered to +2.57 m/s on November 7, then decreased to +2.11 m/s on November 8. Every day from November 1 through November 8 remained below the previous minimum for its calendar date. [1]
03 · POLAR CAP TEMPERATURE
The temperature record supports the dynamical signal
A vortex can look stretched on a globe without necessarily undergoing a significant warming. That is why I don't rely on the wind visualization alone.
NASA's analyzed temperature for the 60–90°N polar cap at 10 hPa reached 218.02 kelvin on November 8. The historical mean for that date is 208.66 K, and the previous maximum is 213.76 K. The Arctic polar cap is therefore 9.36 K warmer than average and 4.26 K above the previous same-date maximum. [3]
That is not warm air in the everyday sense: 218 K is approximately −55°C. It is an exceptional warming relative to the normal stratospheric state at that altitude and time of year. The weakening winds and increasing polar temperature are happening together, which is precisely the combination scientists monitor during a stratospheric-warming event.
04 · PLANETARY-WAVE FORCING
What is driving the disruption? The wave pulse came first
The clearest measured dynamical pathway in this event is planetary-wave activity propagating upward from the lower atmosphere. These are enormous atmospheric disturbances generated by the interaction of weather patterns, land–sea temperature contrasts and topography with the prevailing circulation. Under suitable wind conditions, their energy propagates into the stratosphere, where wave breaking and momentum exchange can slow, stretch and displace the polar vortex.
NASA measures part of this process using the 100-hPa eddy heat-flux diagnostic over 45–75°N. On October 29 it reached 27.77 K·m/s, compared with a historical mean of 10.88 and a previous same-date maximum of 25.92. From October 29 through November 3, it exceeded the previous date-matched maximum six days in a row. By November 8, the daily flux had fallen to 9.31 K·m/s, below that day's mean of 11.33. [4]
The chronology is striking: the unusually strong upward wave pulse developed first, followed by an extended collapse in the upper-stratospheric westerlies and a sharp increase in polar-cap temperature. That timing is physically consistent with wave-driven deceleration and warming. The heat-flux series is not, by itself, a complete momentum or energy budget; it cannot assign every part of the event to one cause.
05 · VERTICAL STRUCTURE
The disruption is not confined to one pressure level
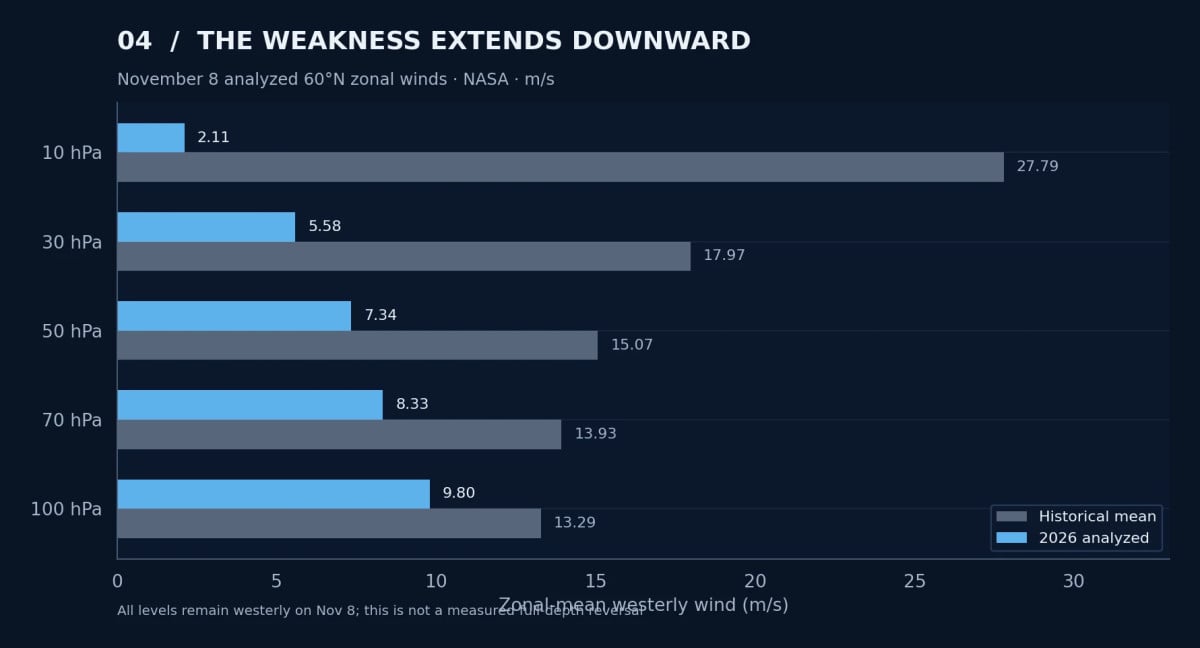
I've also checked the lower stratosphere rather than assuming that everything shown at 10 hPa must already be happening closer to the ground. The November 8 NASA analysis gives the following 60°N westerly winds:
| Pressure level | 2026 analyzed | Historical mean |
|---|---|---|
| 10 hPa | +2.11 m/s | +27.79 m/s |
| 30 hPa | +5.58 m/s | +17.97 m/s |
| 50 hPa | +7.34 m/s | +15.07 m/s |
| 70 hPa | +8.33 m/s | +13.93 m/s |
| 100 hPa | +9.80 m/s | +13.29 m/s |
The anomaly is present at all five levels, but it is most extreme at 10 hPa. All five levels still show positive westerly winds in that analyzed snapshot. The 30- and 50-hPa values are also below their respective historical same-date minima, while 70 and 100 hPa remain above their historical minima. [1][5]
06 · GLOBAL WINDS
The entire planet is showing strong wind bands. Is that one giant polar vortex?
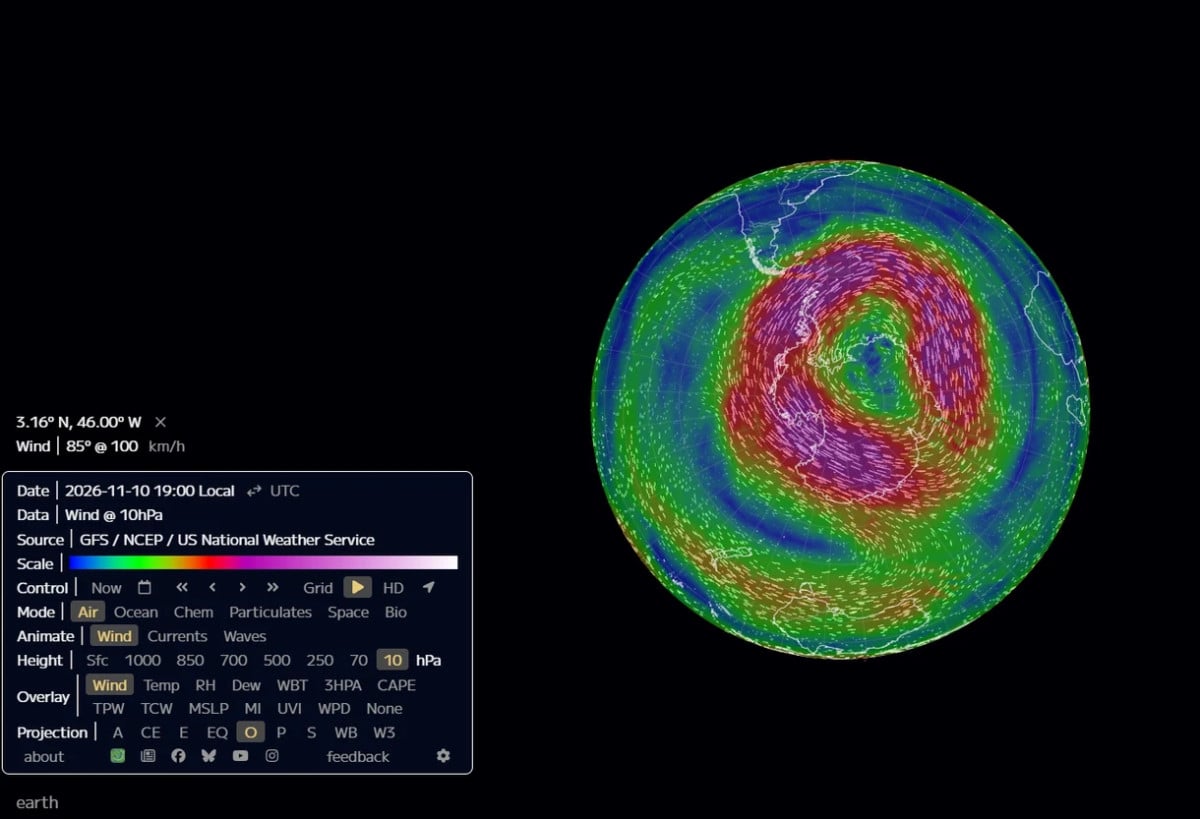
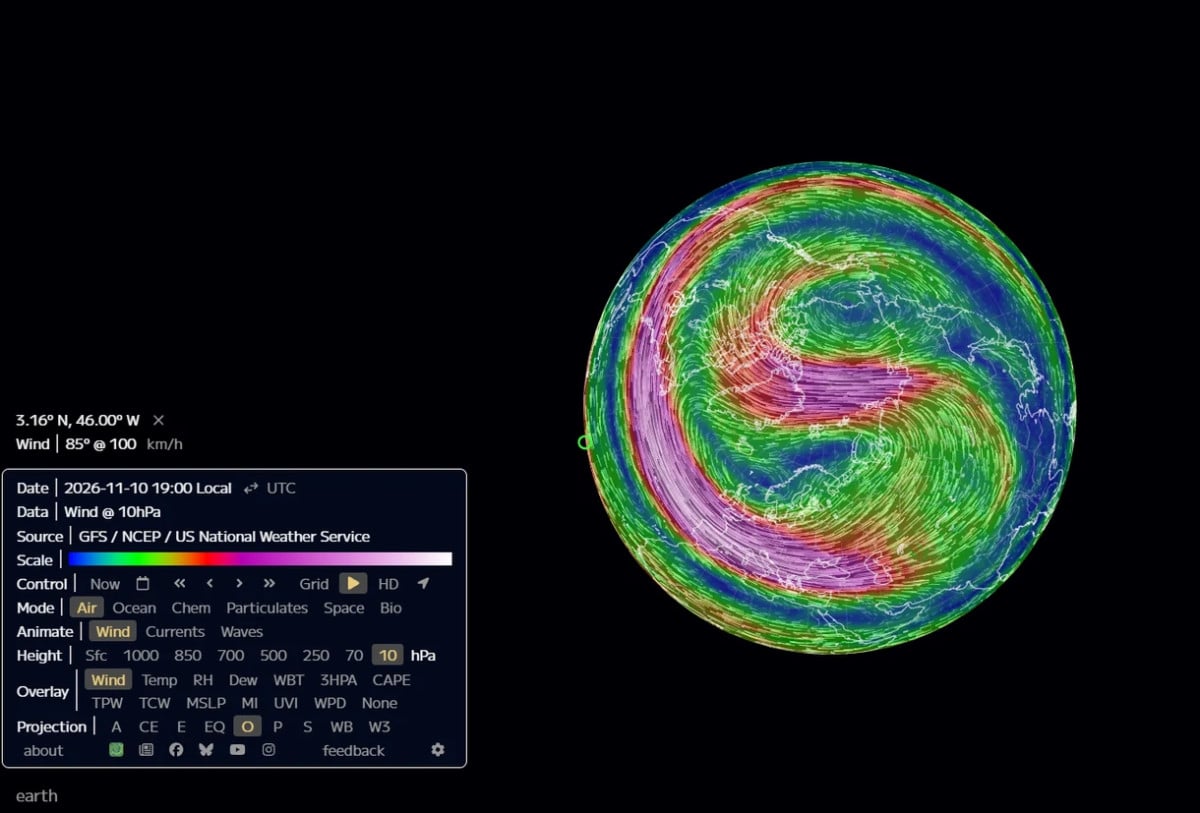
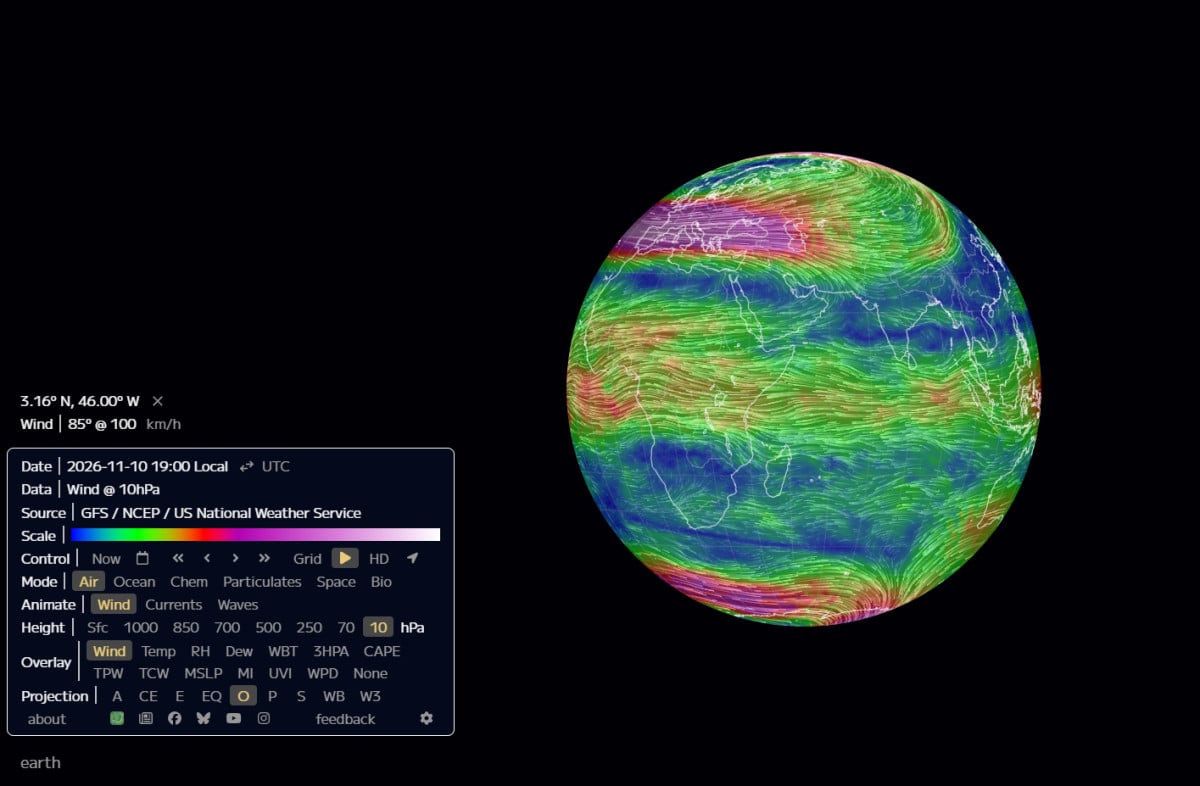
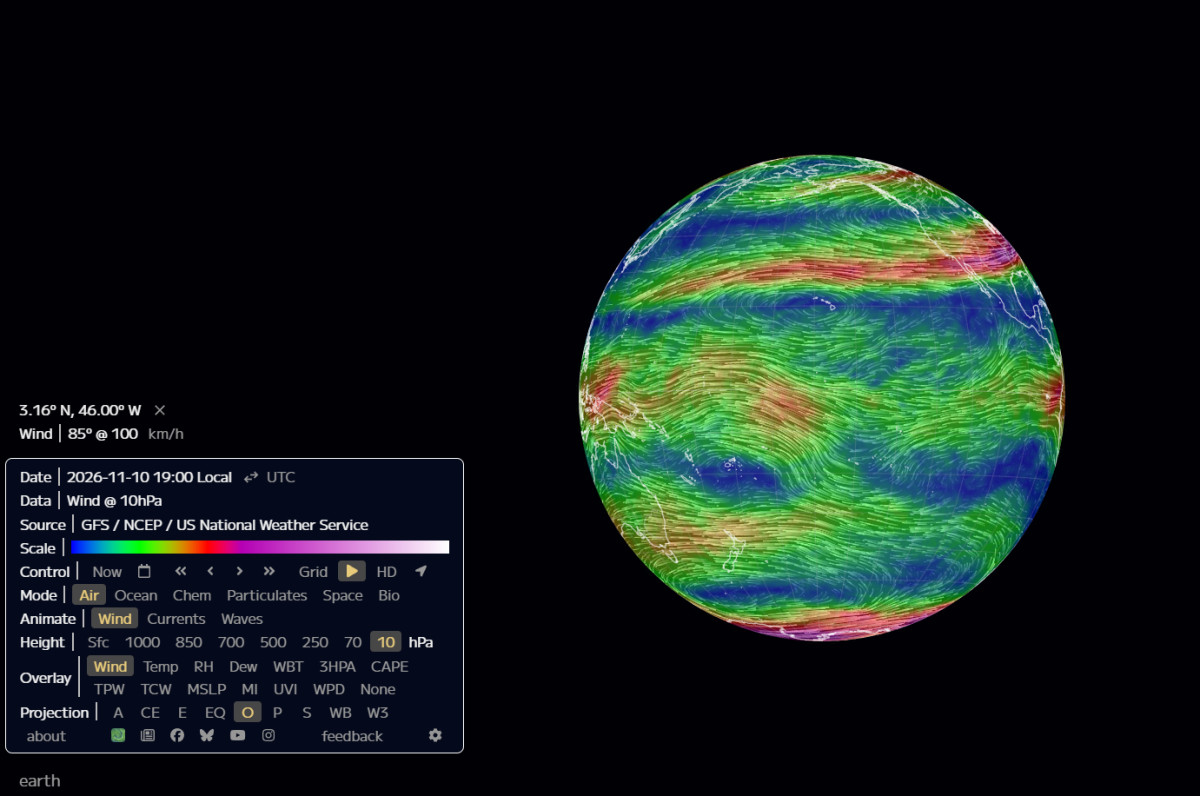
The November 10 GFS 10-hPa globe images look almost impossible at first: enormous wind bands sweeping across continents, distorted circulation centers and powerful jets appearing in both hemispheres at the same time. All the screenshots are different viewing angles of one November 10 model field, not a time-lapse of the circulation changing through six stages.
The visualization displays winds everywhere at 10 hPa, not just the air that belongs to a polar vortex. There are normally two distinct seasonal stratospheric polar vortices, one in each hemisphere, alongside subtropical and tropical stratospheric circulation. Their seasonal lifetimes can overlap in November: the Arctic vortex is developing for winter while the Antarctic vortex approaches its springtime breakdown. A global ribbon of fast winds does not establish that the two vortices have merged or that one vortex wraps around the entire planet.
What is unusual is the contrast between them. NASA's November 8 analysis places the Arctic at +2.11 m/s versus +27.79 normal, while the Antarctic 60°S index stands at +27.88 m/s versus +13.12 normal. The southern value is close to its November 8 90th percentile of +28.18 m/s, but it is not a southern record. [1][6]
That contrast has a real seasonal context. NOAA and NASA report that the Antarctic ozone hole was the seventh-largest seasonal average in 48 years of monitoring, associated in part with a powerful southern vortex and unusually weak planetary-wave activity during August and September. The global stratospheric circulation is therefore showing two very different hemispheric regimes, not one simple pole-to-pole vortex. [7]
07 · REVERSAL MONITOR
Has the vortex reversed, and what would a reversal mean?
On the latest NASA daily analyzed file, the answer is not yet: November 8 remains positive at +2.11 m/s. On the newer ECMWF monitor, the November 9 analyzed index is approximately +1 m/s, also still westerly. These daily summaries lag the real-time evolution of the atmosphere. The November 10 GFS images depict modeled circulation at their stated valid time, but they do not provide a calculated 60°N average that independently demonstrates a negative sign. [1][2]
The forecast is different. NASA GEOS FP projects −0.64 m/s on November 10, −3.47 m/s on November 11, and −2.12 m/s on November 12, followed by a return to positive flow. ECMWF's November 10 cycle also shows a reversal around November 11. Its 50-member ensemble favors at least one easterly day within the ensuing forecast window; that is a fraction of model members, not a calibrated 100% real-world probability. [1][2]
The 60°N, 10-hPa westerly-to-easterly transition is the familiar dynamical threshold associated with a major sudden stratospheric warming during Northern Hemisphere winter. A formal event assessment also examines the surrounding temperature evolution, dates and other accepted classification criteria. If this early-November reversal verifies as a major event, it would be exceptionally early: the ECMWF-based historical catalogue finds no Northern Hemisphere major warming before November 28 since 1959. [2]
A reversal does not require every streamline on the globe to change direction. Powerful regional jets can exist at the same time that the latitude-circle average is near zero or negative.
08 · SURFACE-WEATHER OUTLOOK
What could this mean for our weather?
The stratospheric vortex and the lower-atmosphere jet stream are connected, but not mechanically locked together. A major upper-level disruption can change the odds of subsequent high-latitude blocking, Arctic Oscillation patterns, jet-stream displacement and regional cold-air outbreaks. Sometimes the circulation response propagates downward over the following weeks; sometimes the coupling is incomplete, short-lived or directed toward another region. [8]
So there are several possible outcomes, and they have different tests:
- Upper-level reversal, limited surface response. The 10-hPa wind turns easterly, but the lower stratosphere and troposphere retain a pattern that limits sustained cold delivery.
- Downward coupling and regional blocking. Height and wind anomalies propagate toward 100 hPa and then influence 500-hPa circulation and surface pressure. This can open pathways for colder Arctic air into parts of North America, Europe or Asia—depending on the location of the blocking and troughs.
- A temporary reversal followed by vortex recovery. The wind index turns negative briefly and then strengthens. The surface response could be muted or delayed, particularly if other background circulation factors dominate.
There is already a concrete near-term check. NOAA's November 10 Climate Prediction Center outlook favors above-normal temperatures over much of the central and eastern United States for November 16–20, with particularly high odds around the Northern Plains and Upper Mississippi Valley. That's the actual U.S. temperature forecast during the period immediately following the projected stratospheric reversal. It does not support declaring an imminent nationwide Arctic outbreak. [9]
A colder front or a snowstorm can still occur independently of this high-altitude event. To attribute a particular outbreak to stratospheric dynamics, I would need to see the downward circulation response and the regional weather pattern align in space and time. A few cold days after a warming would not establish causation on their own.
09 · SOLAR / ENSO / QBO
What about the Sun, El Niño and the QBO?
The stratosphere responds to more than one forcing pathway. Solar ultraviolet radiation affects ozone heating. Geomagnetic activity and energetic-particle precipitation can influence polar atmospheric chemistry, including NOx, HOx and ozone. El Niño and the quasi-biennial oscillation change the atmospheric background through which planetary waves propagate.
Those processes belong in the larger Pattern Nexus research model, and I've examined them in the earlier reports. But the directly documented event sequence right now is the exceptionally large upward-wave pulse, collapsing westerly winds and record-warm Arctic polar cap. No event-specific particle-to-ozone-to-wind causal attribution has been established from the datasets shown here. Likewise, El Niño or the QBO cannot be used as a stand-alone explanation for the exact November timing. [4][10]
My October regression work tested seasonal precursors against historical winters. The simpler ENSO/QBO combinations did not consistently improve out-of-sample skill over climatology. It would be inconsistent with that result to turn today's extraordinary stratospheric anomaly into a deterministic winter forecast. [10]
FAQ
Frequently Asked Questions
Is the polar vortex actually breaking apart?
The measured index says the Arctic's circumpolar mean flow has nearly collapsed relative to normal. The global model imagery shows pronounced stretching and distortion. Neither alone proves a formal split into two separate potential-vorticity lobes. That requires spatial boundary diagnostics.
Are we looking at one polar vortex covering both poles?
No. The global map displays the entire 10-hPa circulation. The Antarctic and Arctic polar vortices are distinct seasonal structures, and their winds can both be present in November. The unusual feature this year is the magnitude of the opposite Northern and Southern Hemisphere anomalies.
If the wind reverses, does that mean the cold Arctic air immediately drops into the U.S.?
No. The 10-hPa reversal takes place high above the weather layer. It changes conditions that can alter circulation below, but the jet, blocking locations, and available cold-air reservoirs determine whether and where a cold outbreak follows.
Does this invalidate the strong El Niño seasonal forecast?
No. El Niño is one influence on seasonal probabilities. A major stratospheric event can modify circulation within that background. The two mechanisms can compete or reinforce one another, which is why regional outcomes need separate tests.
11 · NEXT DATA CHECKS
What the next data should settle
The next several days can answer the immediate circulation question. I'll track the daily 60°N, 10-hPa wind crossing zero against the newer six-hourly model analyses; whether the polar temperature anomaly holds; the evolution of wave-1 versus wave-2 geometry and potential-vorticity boundaries; and whether the weakened circulation penetrates downward through 30, 50, 70 and 100 hPa.
After that, the question becomes geographic. I'll compare the lower-stratospheric changes against Arctic Oscillation, 500-hPa height patterns, blocking and regional temperature anomalies. That is the chain of evidence needed to connect an upper-atmosphere event with actual winter conditions on the ground.
The measured result today is already extraordinary: eight consecutive date-matched low-wind records, a new same-date Arctic polar-temperature high and a preceding six-day wave-flux record sequence. Whether a formal reversal occurs on November 10 or November 11 is the immediate threshold. Whether it changes the coming weeks of weather depends on what happens in the layers beneath it.
12 · PATTERN NEXUS SYNTHESIS
The Circulation Is Already Exceptional. The Surface Response Is the Remaining Test.
The measurements do not depend on the appearance of a dramatic wind map. NASA recorded eight consecutive date-matched Arctic wind minima, exceptional polar-cap warming, and an earlier burst of upward planetary-wave activity. The wind anomaly extends through multiple pressure levels, although it is concentrated most strongly at 10 hPa.
The next question is not whether the upper stratosphere has been disturbed; that is established. The tests are whether the zonal-mean winds reverse, how long any reversal lasts, and whether the response propagates through the lower stratosphere into regional blocking and cold-air delivery.
Pattern Nexus assessment: The high-altitude disruption is confirmed by multiple observed diagnostics; a formal vortex split, observed easterly reversal, and a specific surface cold outbreak are separate claims requiring separate evidence.
SOURCES
Research Continuity and Primary Data
Earlier Pattern Nexus polar-vortex research:
- September 1 — The Early Organization Signal, Measured
- October 22 — Winter 2026–27 Polar Vortex, El Niño, QBO and Regression
- October 29 — Historic November Disruption Forecast
- November 1 — November Record, Reversal, Planetary Waves and Cold Delivery
- Complete Pattern Nexus polar-vortex research archive
Primary observations and forecasting references:
- NASA Ozone Watch — 2026 Arctic 60°N, 10-hPa wind and date-matched climatology (NASA file's
Fcst=0rows distinguished from positive forecast leads). - Polarvortex.earth — ECMWF-based Arctic vortex index, temperature, wave forcing and ensembles and dataset/method documentation.
- NASA — 60–90°N polar-cap temperature at 10 hPa.
- NASA — 45–75°N eddy heat flux at 100 hPa.
- NASA Ozone Watch 60°N wind files: 30 hPa, 50 hPa, 70 hPa, 100 hPa.
- NASA — 2026 Antarctic 60°S, 10-hPa wind and climatology.
- NOAA/NASA — 2026 Antarctic ozone hole measurements and southern-vortex context.
- UK Met Office — November 4 stratospheric disturbance analysis and November 5 vortex explainer.
- NOAA Climate Prediction Center — November 10, 2026 6–10/8–14-day forecast discussion.
- Pattern Nexus October 22 2026 forecast and regression report, linked above.
This is an update on the current Arctic stratospheric circulation and the evidence required to connect an upper-atmosphere event to surface weather. The extended seasonal models and previous calls are linked in the sources above.
What's Your Reaction?
 Like
0
 Dislike
0
 Love
0
 Funny
0
 Wow
0
 Sad
0
 Angry
0

Nexus (Christopher)
Founder of Pattern Nexus. I research markets, macro, geopolitics, AI, history, ancient systems, and the patterns most people overlook. I’m also building Market Radar, a trading scanner designed to read pressure, risk, confirmation, and setup quality before ch…
Related research
The Polar Vortex Reversal Is Confirmed: Fourteen Records, the October Wave Transition, and the Thanksgiving Forecast Conflict
NASA now confirms fourteen consecutive date-matched Arctic 10-hPa wind lows and an early-November reversal, following five September high-w…
6 shared topics.
The Polar Vortex Reversed on November 10. NASA Has Confirmed It—Now We Track the Cold Delivery
NASA has confirmed an exceptionally early 60°N 10-hPa easterly reversal. This report separates analyzed observations from forecasts and tra…
5 shared topics.
The Polar Vortex Is Breaking Down. Now ECMWF Is Modeling a Major Midwest Storm.
Nine consecutive date-matched Arctic wind records, a forecast 10-hPa reversal, and ECMWF maps depicting an extraordinary late-November Midw…
5 shared topics, same research avenue.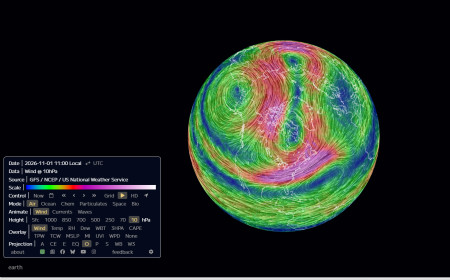
The Polar Vortex Is Approaching a November Record: From September Extremes to an Early Reversal Forecast
Five September wind records have given way to an exceptionally weak Arctic circulation. PN checks 47 NASA autumns, the 1952 and 1968 warmin…
6 shared topics.
The Polar Vortex Is Stretching: A Historic November Forecast, and the Cold Outbreak That Hasn't Happened
polar vortex, November 2026, Arctic polar vortex, sudden stratospheric warming, NASA Ozone Watch, ECMWF, vortex collapse, planetary waves, …
8 shared topics.
The Polar Vortex Test: Winter 2026–27, El Niño, the QBO and the Limits of Prediction
Five record-setting September polar-vortex wind days, an October shift below normal and a potentially historic El Niño set the stage for No…
6 shared topics.
Polar Vortex Watch 2026–27: The Sun Quieted, the Vortex Hit a Record — Now the Real Test Begins
The early-season Arctic vortex has now crossed from unusual into a verified date-matched record at 10 hPa. At the same time, NOAA reports v…
7 shared topics.
Polar Vortex Watch 2026–27: Early Arctic Organization Is Now Pressing Historical Extremes
What started as an unusual late-August structural signal is becoming something much harder to dismiss. The 10-hPa Arctic winds have moved a…
6 shared topics.
Comments (0)
Security Check
Please complete the captcha to verify you are human.