

The Polar Vortex Test: Winter 2026–27, El Niño, the QBO and the Limits of Prediction
Five record-setting September polar-vortex wind days, an October shift below normal and a potentially historic El Niño set the stage for Northern Hemisphere winter 2026–27. Pattern Nexus reconstructs 36 winters of ENSO/QBO/Arctic Oscillation records and 32 seasons of Chicago snowfall, runs rolling out-of-sample…
Five record-setting September polar-vortex wind days, an October shift below normal and a potentially historic El Niño set the stage for Northern Hemisphere winter 2026–27. Pattern Nexus reconstructs 36 winters of ENSO/QBO/Arctic Oscillation records and 32 seasons of Chicago snowfall, runs rolling out-of-sample…
Jump to a section
I have been following the Arctic vortex and its possible connections to solar activity, planetary waves and cold delivery for more than 15 years. September delivered five date-matched wind records; by October 20, upper-level winds were below normal. Strong El Niño and a westerly QBO complicate the winter setup. I tested 36 historical winters of ENSO/QBO against winter AO and 32 Chicago snowfall seasons. The simple models did not show dependable improvement over climatology. This is a preliminary Northern Hemisphere outlook, not a call for a specific cold or snowy winter. The next formal assessment will be at the end of November.
NASA analyzed wind
18.32 m/s · Oct 20
September record days
5 verified
Historical tests
36 AO winters · 32 snow seasons
Forecast revision
Late November 2026
01 · PATTERN NEXUS RESEARCH
Executive assessment
I have spent much of the past year following the Arctic polar vortex, solar activity, planetary-wave behavior and the way cold air eventually moves into the inhabited parts of the Northern Hemisphere. The question has never been as simple as whether the vortex is strong or weak. What matters is whether the structure changes, what forces those changes, whether an anomaly descends into the lower atmosphere and, finally, where the tropospheric jet and pressure systems carry the cold.
The September record sequence is verified. The late-October weakening is forecast. A forecast for the stratosphere is not the same thing as a forecast for temperature or snowfall at the surface.
The early 2026–27 season has already produced something worth documenting. NASA's 60°N, 10-hPa analyzed zonal winds exceeded their date-matched historical maxima on five consecutive days in September. By October 20, the same wind series was about 10% below its historical seasonal mean. At the same time, a powerful El Niño is influencing the tropical Pacific, the equatorial stratosphere has moved into a westerly QBO phase, and forecasts for late October and early November suggest further stretching and weakening of the Arctic vortex.
None of that adds up to a guaranteed cold winter. The official seasonal baseline still favors warmer-than-normal conditions across much of the northern United States. What the additional data reveal is a distinction that deserves more attention: seasonal mean conditions and individual high-impact cold events are different forecasting targets. A warm winter can contain a significant Arctic outbreak, while a disturbed stratospheric vortex can fail to produce surface cold in the region being monitored.
To avoid building a conclusion around one unusual autumn, I reconstructed 36 completed winters of ENSO, QBO and Arctic Oscillation data and separately tested 32 seasons of Chicago snowfall. The simple predictive regressions were disappointing: none beat a climatological baseline for winter AO in a rolling historical test. The snowfall result was only marginally better with ENSO alone, and the fitted association did not meet conventional significance thresholds. That negative result is part of the forecast, not something to omit.
The October issue is therefore a preliminary Northern Hemisphere systems assessment. It gives the most defensible direction now, identifies where the evidence is thin and establishes what will determine the late-November update. It is not a declared probability of a vortex split, a precise snowfall estimate or a claim that solar forcing controls regional winter weather.
02 · PATTERN NEXUS RESEARCH
What a polar vortex measurement actually means
The Arctic stratospheric polar vortex is a high-altitude circulation of westerly winds around the cold polar stratosphere, developing as sunlight retreats in autumn. The tropospheric polar jet is a different circulation much closer to the surface. The two can interact, but they are not interchangeable. People often see a disturbed jet-stream map and describe it as a broken polar vortex, even when the stratospheric circulation remains intact.
NASA's long-running Ozone Watch series tracks the zonal-mean zonal wind at 60°N and 10 hPa—roughly 30 kilometers above Earth's surface. Zonal mean means the wind is averaged along a circle of latitude. Positive values indicate westerlies. This makes the series a useful standardized measure of stratospheric wind strength. It cannot tell us where the vortex is centered, how elongated it is, whether two vortices exist or how far a lobe extends across Siberia or North America. Those questions need geopotential-height and potential-vorticity fields.
A major sudden stratospheric warming (SSW) is normally identified in midwinter when 10-hPa zonal-mean winds at 60°N reverse from westerly to easterly, accompanied by the characteristic stratospheric warming event. A wind weakening that never reverses is not automatically an SSW. And even an established SSW is not a guaranteed cold outbreak at the surface.
The relevant pressure levels in this report are 10 hPa (upper stratospheric circulation), 70 and 100 hPa (lower stratosphere and upward-wave interaction), 250 hPa (upper-tropospheric jet), 500 hPa (midlevel ridges and troughs), and near-surface temperature and pressure. A physical connection must be demonstrated across levels and through time, rather than assumed from two visually similar maps.
Core distinction: Zonal-mean wind measures circulation strength averaged around a latitude. It cannot, by itself, locate a displaced vortex, confirm a split, or establish surface cold delivery.
03 · PATTERN NEXUS RESEARCH
The September 16–20 record sequence
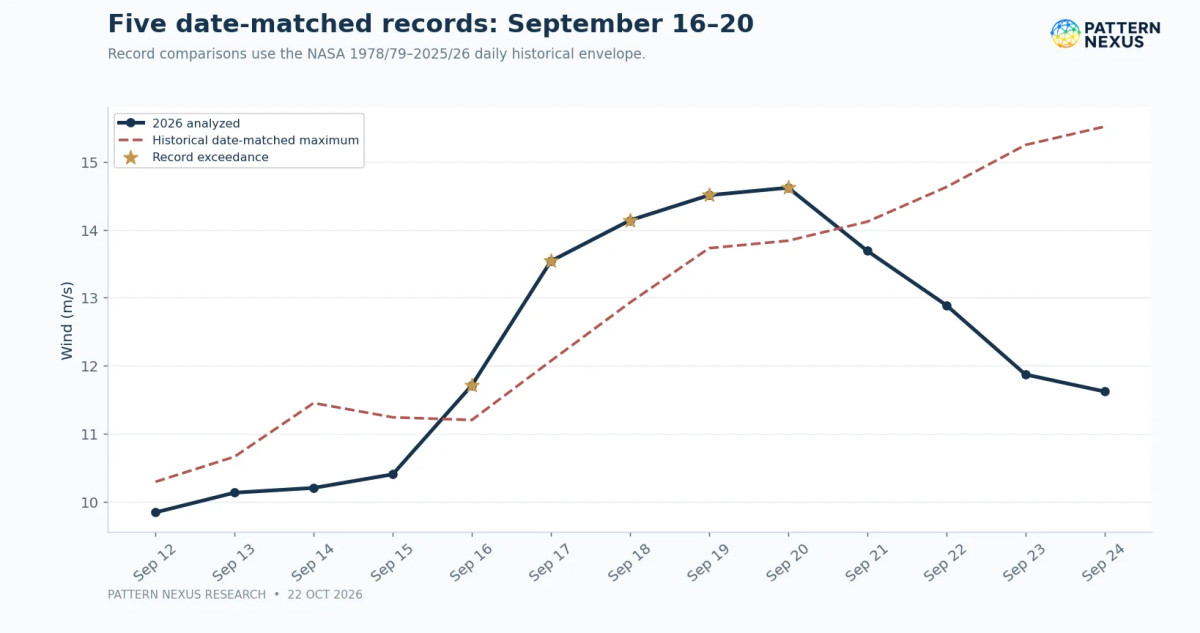
The first part of the record is now firm. NASA's 2026 data identify September 16–20 as five consecutive days when the analyzed zonal wind exceeded the previous historical maximum for the same calendar date. On September 17 the wind was 13.54 m/s, compared with a historical maximum of 12.07 m/s. On September 20 it was 14.62 m/s, compared with 13.84 m/s. The full five-day sequence is listed below; the graph shows the continuation into October.
| Date | Analyzed wind | Prior date-matched maximum | Difference |
|---|---|---|---|
| September 16 | 11.71 m/s | 11.20 m/s | +0.51 m/s |
| September 17 | 13.54 | 12.07 | +1.47 |
| September 18 | 14.14 | 12.93 | +1.21 |
| September 19 | 14.51 | 13.73 | +0.78 |
| September 20 | 14.62 | 13.84 | +0.78 |
The record is specific: date-matched daily wind, not the strongest vortex ever observed at any time in winter. September is a transition season, so the historical baseline is low and rising. Records at that point in the year document unusually early strengthening; they cannot by themselves establish an unusual December–February outcome.
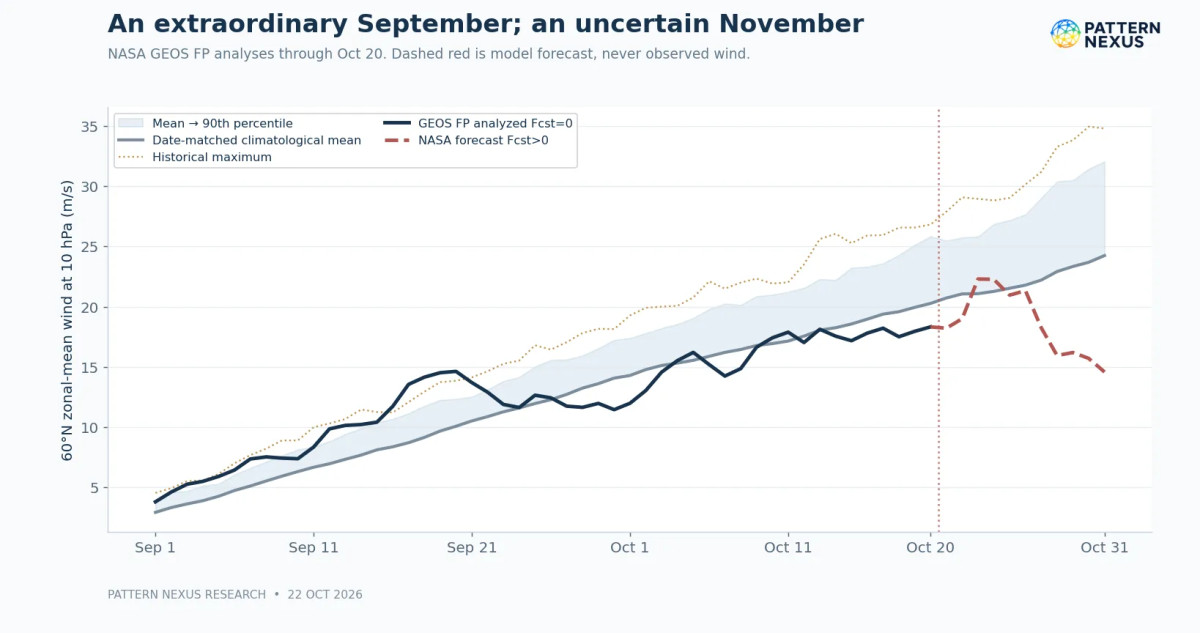
The latest NASA analyzed row available for this report is October 20 (Fcst=0), with 18.32 m/s, up 0.37 m/s from October 19. The date-matched historical mean is 20.27 m/s, the 90th percentile 25.86 m/s and the historical maximum 26.83 m/s. The analyzed wind is 1.95 m/s below the mean, 7.54 m/s below the 90th percentile and 8.51 m/s below the historical maximum. The October observation is not close to either an unusually high or unusually low record.
NASA notes that the 2026 file uses GEOS FP analyses from August 1 onward; this is an atmospheric analysis system, not a direct balloon measurement of the entire latitude circle. The date-matched climatology covers winters 1978/79 through 2025/26. The recent analyzed wind has risen modestly in absolute terms, but climatological winds rise rapidly through autumn too. Consequently, absolute strengthening can coexist with a persistent negative anomaly.
04 · PATTERN NEXUS RESEARCH
From exceptional September strength to October weakness
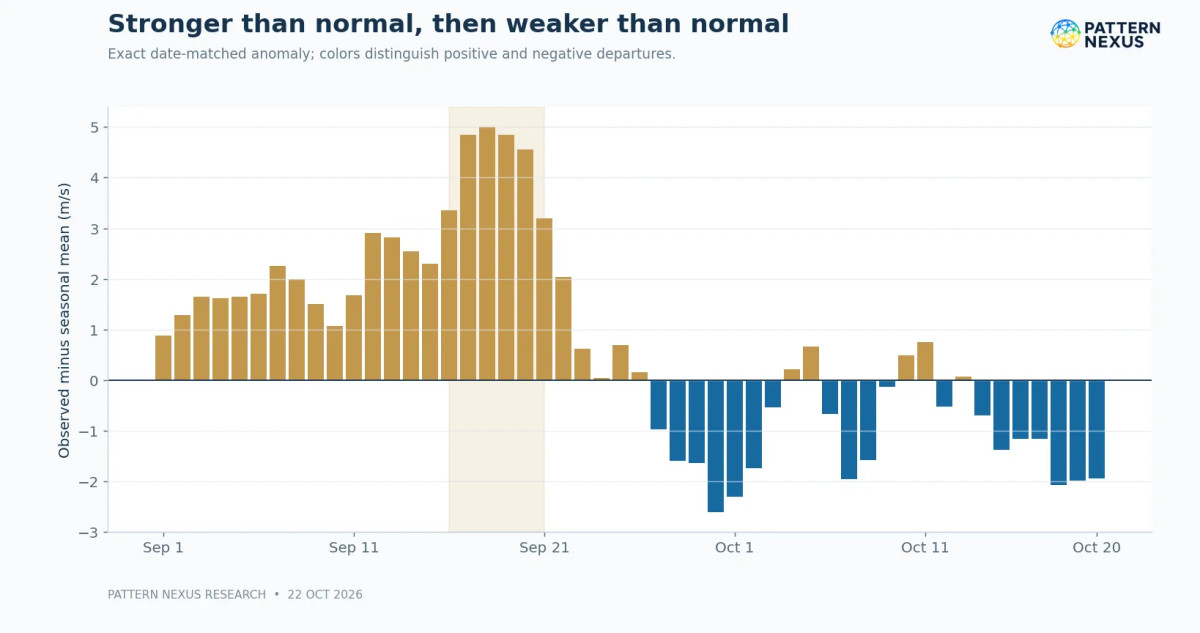
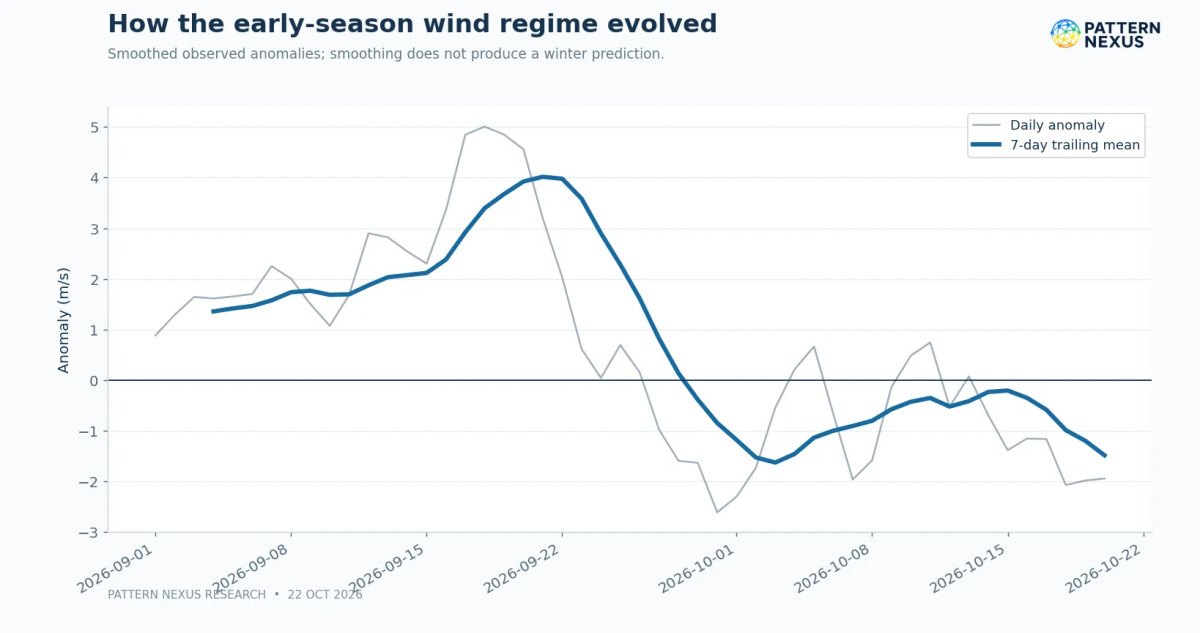
September's transition is clearer in anomalies than in the raw wind alone. Across the first 20 analyzed days of September, the average anomaly was approximately +2.52 m/s. From September 21 to October 20, the average was approximately −0.60 m/s. The later span includes recovery attempts, notably in early October; it is not 30 uninterrupted days of weakening.
The important interpretation is not that the vortex suddenly became historically weak. The seasonal norm accelerated away from it. As autumn progressed, winds that looked strong in isolation became ordinary or modestly weak for the date. This is exactly why comparisons with the same calendar day matter.
Our earlier October watch identified elongation and wave-2 activity around October 13–14, followed by a more compact configuration and renewed wave-1 growth. That is a different question from the zonal-mean trend. The daily series cannot validate the geometry; both must be examined separately.
Separate wind strength from vortex shape
A simple descriptive regression on 50 successive daily anomalies from September 1 through October 20 produces a slope of approximately −0.093 m/s per day. Its autocorrelation-adjusted standard errors still indicate a downward descriptive trend over these dates. However, those 50 data points are not 50 independent winters. Seasonal evolution and serial dependence are built into the record. This regression describes what happened in one autumn; it cannot be used as a winter temperature forecast. I am retaining it as a transparent description rather than using its small p-value to imply predictive certainty.
05 · PATTERN NEXUS RESEARCH
October 22 forecast: a possible early-November disturbance
The October 22 NASA file includes modeled daily values from October 21 through October 31. Every one of these rows has a positive Fcst lead label. They must be distinguished from Fcst=0 analyzed rows. In this forecast cycle the mean wind recovers to 22.30 m/s on October 23, then falls to 14.57 m/s by October 31. The October 31 date-matched climatological mean is 24.25 m/s, leaving a projected anomaly of −9.68 m/s, below the date-matched 10th-percentile threshold of 17.63 m/s.
This is significant as a forecast. It is not an October 31 observation and it is not evidence of a major SSW. Model uncertainty grows with lead time, and successive forecasts have already revised the rate of weakening and the amount of deformation.
The October 22 ECMWF-based vortex analysis reports current 10-hPa wind of about 19 m/s, vortex aspect ratio 1.43 and centroid at 83.1°N. This represents increasing elongation and displacement compared with the previous day's diagnostics, but not a confirmed split. At 100 hPa the reported instantaneous upward eddy heat flux is 10.8 K·m/s, while the 10-day average is 8.0 K·m/s. The model projects a peak aspect ratio of 2.72 near November 2, and roughly 82% of its 50 ensemble members lie below the date-matched 10th-percentile wind by November 5. None project a wind reversal by that horizon.
Those ensemble fractions are raw model-member frequencies, not calibrated probabilities that an event will occur. They measure a specific forecast diagnostic at a specific lead time. The October 22 forecast does not justify calling a sudden stratospheric warming inevitable or even underway.
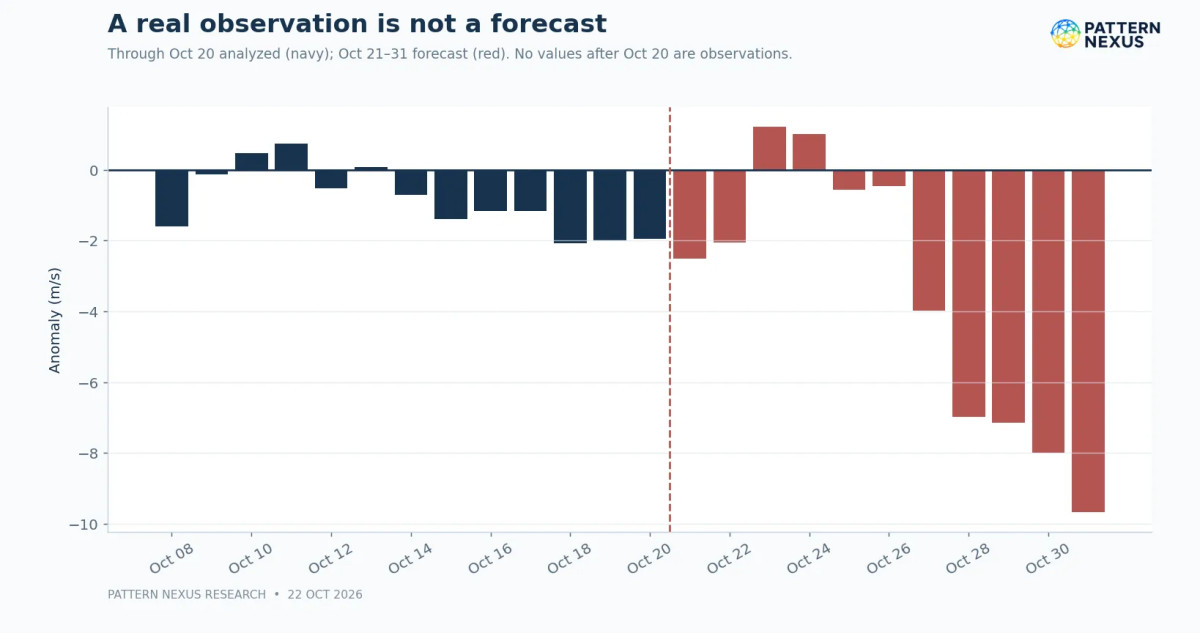
Forecast boundary: NASA rows labeled Fcst=0 are analyzed values. All positive-Fcst rows describe model projections, not observed records.
06 · PATTERN NEXUS RESEARCH
Vortex shape, planetary waves and vertical coupling
To understand where the vortex goes, we have to follow its wave structure. Planetary wave 1 has one broad longitudinal ridge/trough pattern and often contributes to pushing the vortex off the pole. Wave 2 can stretch the circulation into two lobes; under sufficiently strong forcing and the right background state, a split may occur. But elongation, displacement and split are not synonyms. Distinguishing them requires contour topology, potential vorticity and vortex-centered diagnostics.
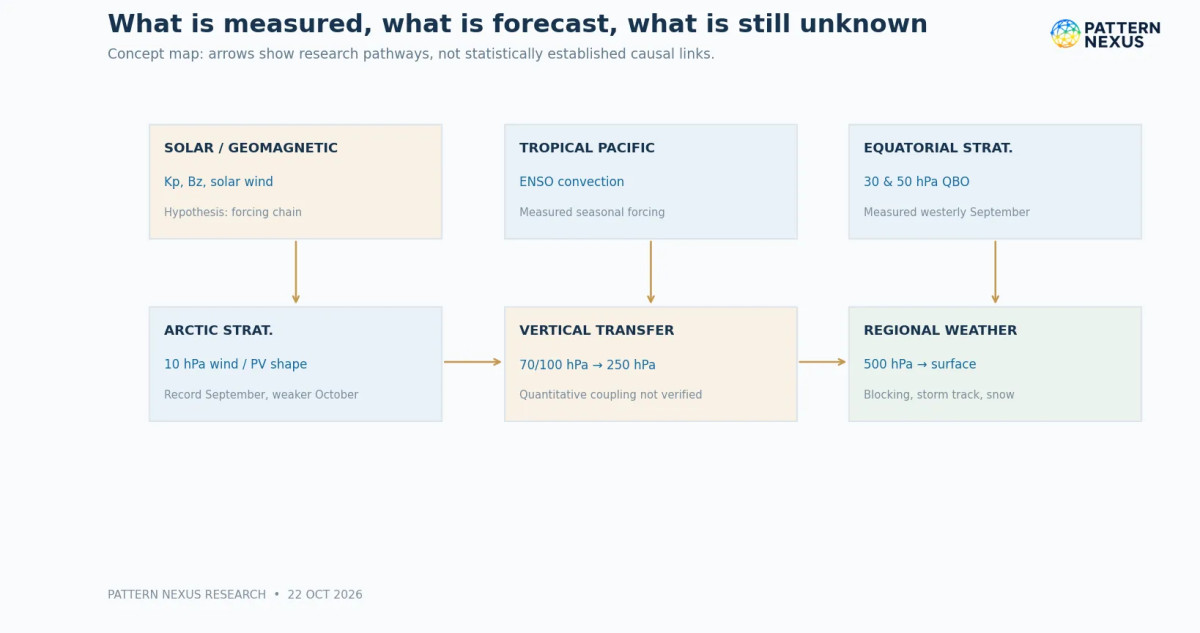
Without synchronized 70/100/250/500-hPa fields showing the sequence through time, a downward-propagating disturbance remains a hypothesis rather than a confirmed mechanism.
The October 22 analysis reports wave-1 amplitude around 276 m and wave-2 around 149 m at 10 hPa. Its 100-hPa upward heat flux is near the middle of the seasonal distribution, with a higher wave-forcing peak projected around October 29. The present configuration therefore shows an active but not yet extreme observed planetary-wave state, while some larger changes remain predicted for the end of October and beginning of November.
The central unresolved question is the vertical structure. We have upper-stratospheric wind and wave diagnostics, and we have separate NOAA forecasts for tropospheric ridges and troughs. We do not yet have a validated, date-aligned 70/100/250/500-hPa reconstruction showing coherent anomalies descending from the 10-hPa region toward North American surface pressure. It would be inaccurate to draw a line between these separate data products and call it confirmed downward coupling.
What would establish downward coupling?
In established winter research, circulation anomalies associated with some SSW events can propagate into the lower stratosphere and be followed by changes in the surface Arctic Oscillation for several weeks. But other events have limited tropospheric impact. Wave activity can also be generated by the troposphere itself. In many situations, the troposphere is the driver of the stratospheric disturbance, not merely a downstream receiver. Both directions of influence must remain in the causal interpretation.
07 · PATTERN NEXUS RESEARCH
El Niño: the tropical Pacific is now a major seasonal driver
NOAA's October 8 ENSO Diagnostic Discussion reports that the equatorial Pacific has developed a strong-to-very-strong El Niño. The September Niño-3.4 sea-surface temperature departure was +2.1°C, with Niño-3 at +3.0°C and Niño-1+2 at +3.9°C. NOAA also notes anomalously warm subsurface water and an atmospheric convection pattern consistent with ocean–atmosphere coupling. This is more than a warm patch of water; the tropical circulation has responded.
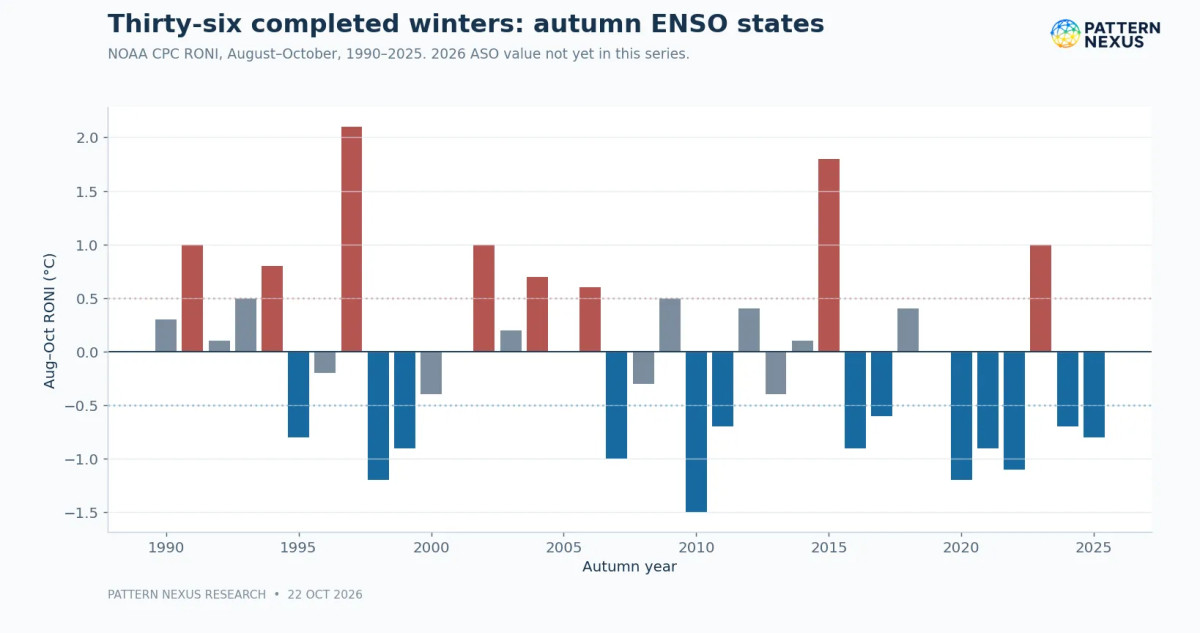
NOAA assessed an 83% probability of the three-month Relative Oceanic Niño Index (RONI) exceeding +2.5°C during October–December, and a greater-than-83% chance that strong-to-very-strong El Niño conditions persist through January–March 2027. Those statements refer to different event windows. RONI subtracts the tropical-mean background warming signal and rescales the index. It should not be substituted numerically for the single-month Niño-3.4 value.
The climatic relevance comes from altered tropical rainfall, convection and planetary-scale atmospheric wave trains. For the United States, El Niño often shifts and strengthens parts of the subtropical jet, increases the odds of wetter weather in portions of the southern tier, and tilts winter temperatures warmer across parts of the northern tier. But seasonal teleconnections have geographical variability. They do not say whether northern Illinois gets a 10-day Arctic outbreak, whether a specific lake-effect band develops or whether Europe has a blocked February.
Our 36-winter reconstruction includes historical August–October RONI values because those are known before the following winter. The 2026 ASO RONI entry is not yet populated in the current NOAA historical table as of the report cutoff, so I have not invented a value to plug into the regression. Current ENSO conditions and NOAA's strength forecast are treated separately from that historical predictor series.
08 · PATTERN NEXUS RESEARCH
The QBO: which altitude, which month, which phase?
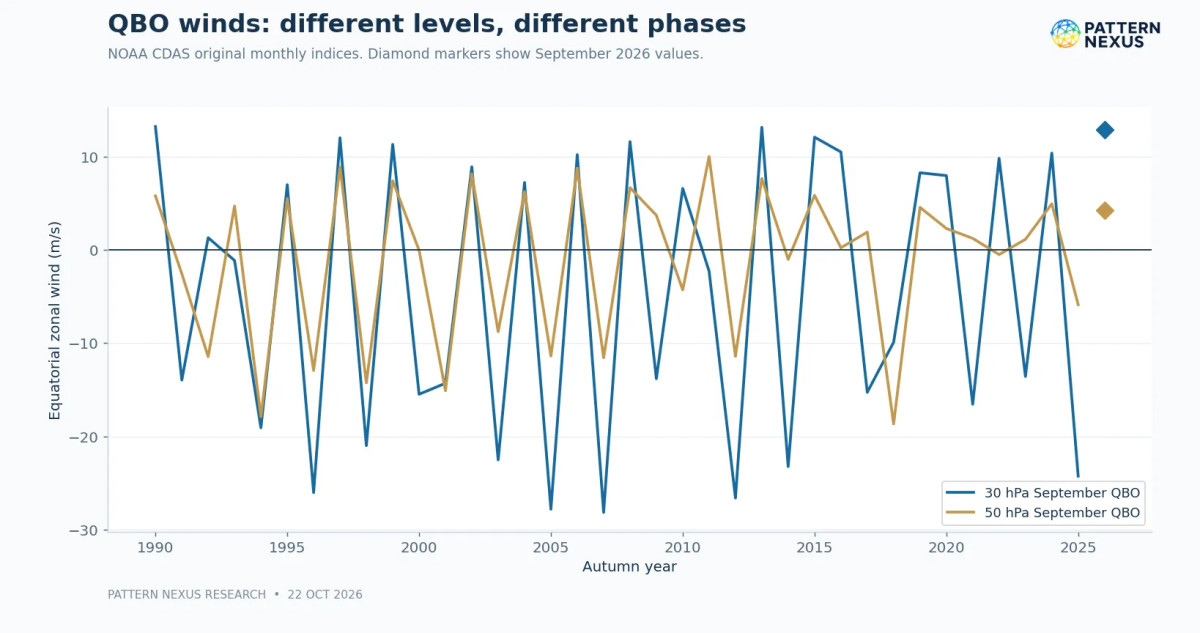
The quasi-biennial oscillation (QBO) is a succession of alternating easterly and westerly zonal winds in the equatorial stratosphere. It normally takes about 2–3 years for a full cycle. Because phases propagate downward and change with height, the same month at 30 hPa and 50 hPa need not show the same value or even the same sign. A one-number QBO label hides that vertical structure.
NOAA's September 2026 original CDAS monthly wind indices are +12.90 m/s at 30 hPa and +4.21 m/s at 50 hPa: both westerly by the conventional positive-zonal-wind sign. The 50-hPa phase only recently crossed from easterly into westerly, so the transition itself matters. It would be misleading to assume that September's values remain fixed throughout December–February.
The proposed Holton–Tan relationship connects equatorial QBO phase with planetary-wave propagation and the polar stratosphere. In broad historical composites, easterly QBO winters may have a greater tendency toward a disturbed polar vortex or SSW than westerly winters. But this association is not a switch. It varies with timing, the particular pressure-level index, solar cycle, ENSO and other background circulations, and not every study finds a stable effect in every era.
The regression later in the report deliberately starts with the simpler question: does September QBO alone add out-of-sample skill for the following DJF-mean Arctic Oscillation? It does not in the 36-winter sample. That is evidence against this simple forecasting shortcut, not evidence that the physical QBO mechanism is false.
09 · PATTERN NEXUS RESEARCH
Arctic sea ice, Eurasian snow and ocean patterns
The cryosphere matters because the surface is not a passive boundary. Arctic sea-ice extent, the speed and geography of autumn freeze-up, Siberian snow cover and associated continental cooling can influence the thermal gradients and wave patterns that help shape winter circulation. None is a sufficient winter predictor on its own.
The September 2026 Arctic sea-ice extent was reported by the National Snow and Ice Data Center at approximately 4.81 million square kilometers, substantially below the 1981–2010 mean but not near the lowest September values on record. The relevant question is not simply how many square kilometers were ice-free: where was the open water, how did it influence lower-atmospheric heat fluxes, and did subsequent Eurasian snow advance and Ural blocking favor greater upward planetary-wave activity?
For this report we have not incorporated a fully standardized historical snow-cover-extent series, sea-ice concentration fields by sector, autumn snow-advance index or a spatially resolved October ice-growth analysis into the regression. These remain research priorities, not hidden inputs to a model. Their inclusion requires explicit measurement definitions and lagged validation because published claims about snow-cover precursors have shown sensitivity to sample period and statistical methods.
The North Pacific sea-surface temperature pattern and the Pacific Decadal Oscillation are also relevant to North American winter tracks. In the Atlantic, the NAO and Greenland blocking matter to Europe and the eastern United States; in the Pacific, PNA, EPO and WPO-like circulation patterns can determine whether Arctic air pours south or remains bottled near the pole. Their influences change across weeks and regions. A broad ENSO outlook must not be confused with a fully specified blocking forecast.
10 · PATTERN NEXUS RESEARCH
Solar activity: observations, mechanisms and falsifiable claims
The Pattern Nexus solar-forcing hypothesis remains worth testing carefully. I have followed coronal-hole growth, recurring high-speed streams, geomagnetic changes and the atmosphere's early-season response because they offer a potentially measurable sequence—not because their causal link to this autumn's vortex has already been demonstrated.
The first distinction is physical. A coronal-hole high-speed stream can change solar-wind speed and magnetic-field conditions. A corotating interaction region can compress fields ahead of a stream. A coronal mass ejection (CME) is a different kind of disturbance. The IMF Bz component indicates the north–south orientation of the solar magnetic field; sustained negative Bz often makes geomagnetic coupling more efficient. The Kp and Ap indices measure geomagnetic disturbance, but neither tells us directly how many energetic particles precipitated into the middle atmosphere over the polar cap.
NOAA's October 22 discussion confirms minor G1 geomagnetic storm conditions occurred during the positive-polarity coronal-hole stream. Solar wind peaked near 525 km/s on October 21, with sustained Bz excursions around −5 to −7 nT. NOAA also identified two CMEs from October 21; its model indicated a possible weak glancing encounter with the first around October 25–26, at low confidence. The greater-than-10-MeV proton flux remained near background, while high-energy electron flux was normal to moderate. These are meaningful space-weather observations, not evidence of a measured ozone or vortex response.
Mechanism is not proof of attribution
The proposed atmospheric path runs from geomagnetic forcing into energetic-particle precipitation (EPP), production of odd nitrogen and odd hydrogen (NOx/HOx), ozone changes and possible dynamical feedbacks. Some parts of that chain have strong observational and chemical foundations in the literature. But the size, altitude, season and spatial coverage of the effects matter. A global or Southern Hemisphere result cannot simply be transferred to the 2026 Arctic without the correct observations.
The sequence of events also constrains attribution. October's geomagnetic activity cannot cause the September record winds. The October 20–22 coronal-hole event cannot cause the October 13–14 deformation because it came afterward. An event-study model would need time-stamped particle precipitation, ozone/NOx, lower-stratospheric temperature and wind anomalies, meteorological controls and a predefined lag window. Even positive correlation could reflect common timing or selection effects. This is a live, falsifiable research question—not an established conclusion.
11 · PATTERN NEXUS RESEARCH
Methodology: 36 winters rather than 50 daily points
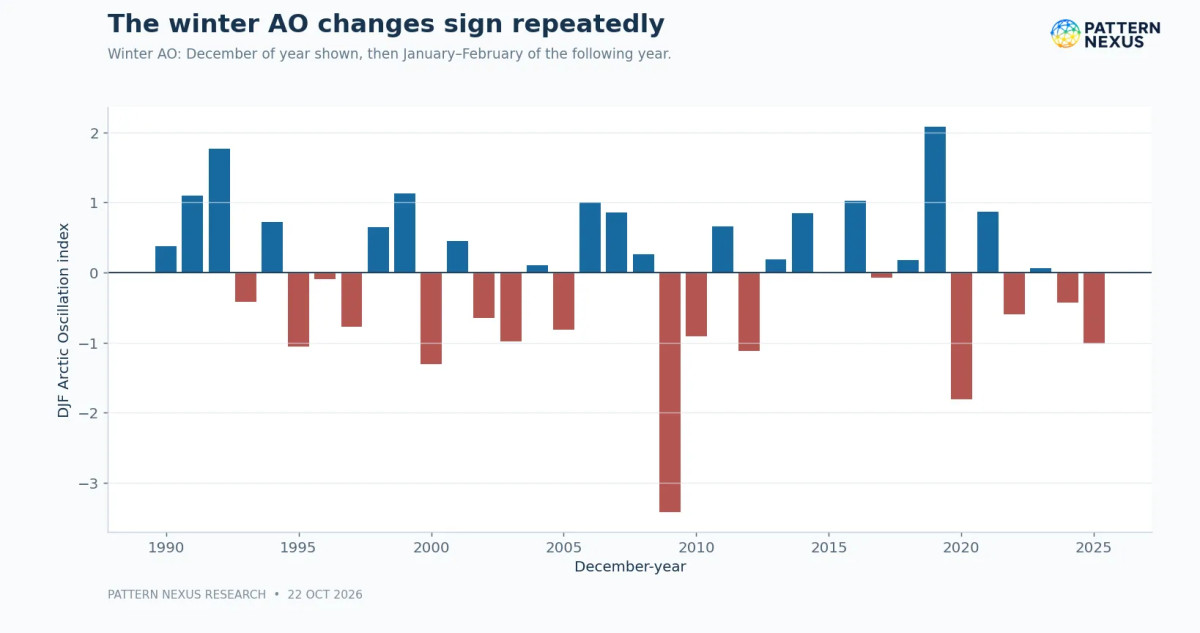
Before building a complicated model, I wanted a basic question answered: how much of the following winter can we predict from the conditions we already know in September and October? To avoid treating serially correlated days as independent winters, I constructed a table with one row per completed winter.
The first experiment covers 36 winters from 1990–91 through 2025–26. Predictors were the August–October RONI, the September 30-hPa QBO, and, in an expanded model, the September 50-hPa QBO. The outcome was the mean Arctic Oscillation index for December, January and February, with January and February belonging to the next calendar year. The AO describes the tendency for pressure anomalies between polar and midlatitude regions; a negative AO often supports a more exchange-friendly circulation, but is not itself a local temperature reading.
Historical backtesting instead of in-sample fit
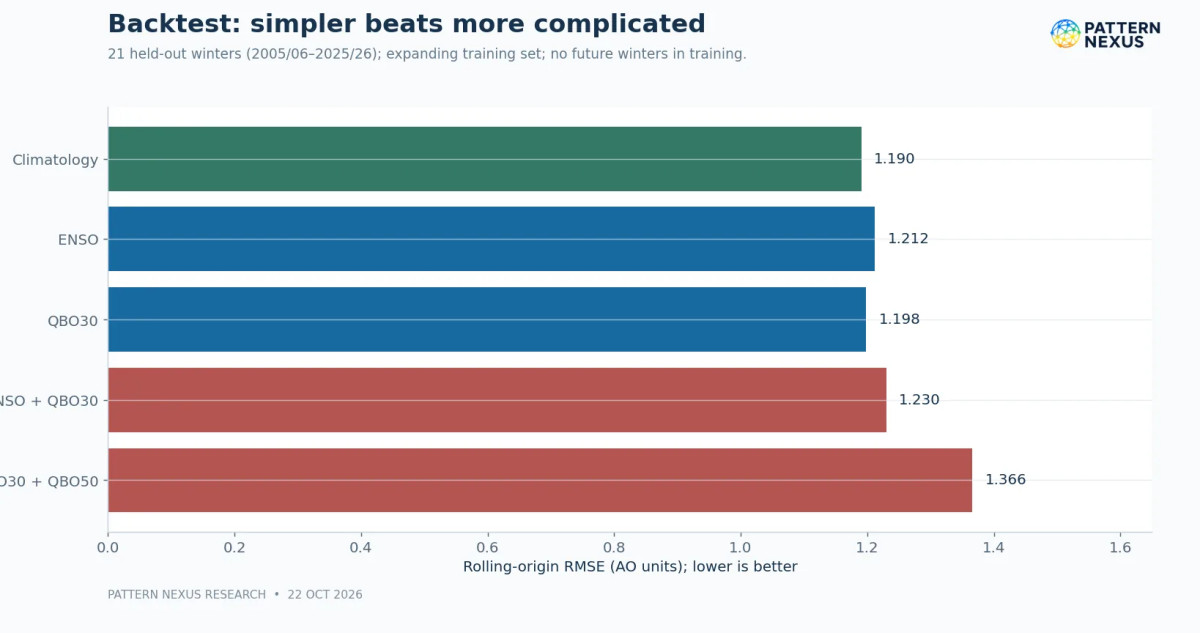
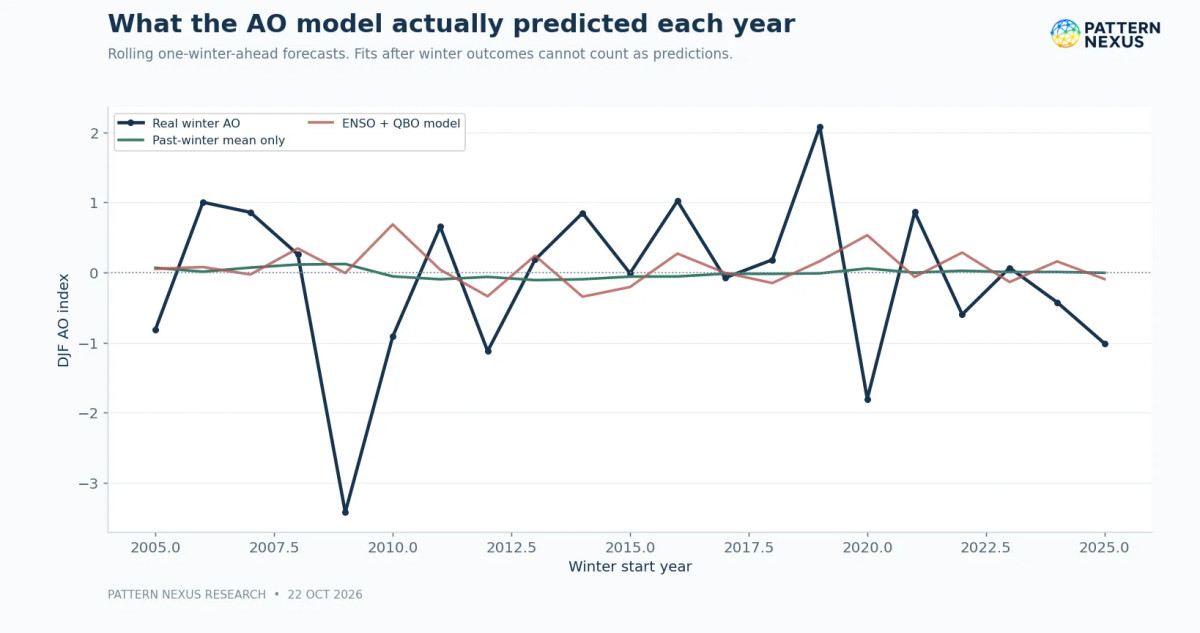
I fitted simple ordinary least-squares linear regressions and compared them with a model that does nothing more than use the previous winters' mean. The important test was rolling-origin validation: train on the first 15 completed winters, forecast the next winter, add that year to the training data, forecast the following winter, and continue. This yields 21 genuinely held-out one-winter-ahead predictions. Forecast errors are summarized with root-mean-square error (RMSE), in which large misses count more heavily. A model is useful only if its held-out error improves on the baseline; fitting the historical points closely is not sufficient.
I deliberately did not search dozens of indices or hundreds of lags to find an attractive p-value. With 36 winters, such a procedure could easily produce false discoveries. Our test does not contain 2026 autumn geometry, 100-hPa wave flux, AO/NAO monthly transitions, MJO, regional surface temperature, sea ice sectors or solar EPP as numerical regressors. It is a defensible baseline model, not a complete physics-based winter prediction system.
12 · PATTERN NEXUS RESEARCH
Regression result I: predicting the winter Arctic Oscillation
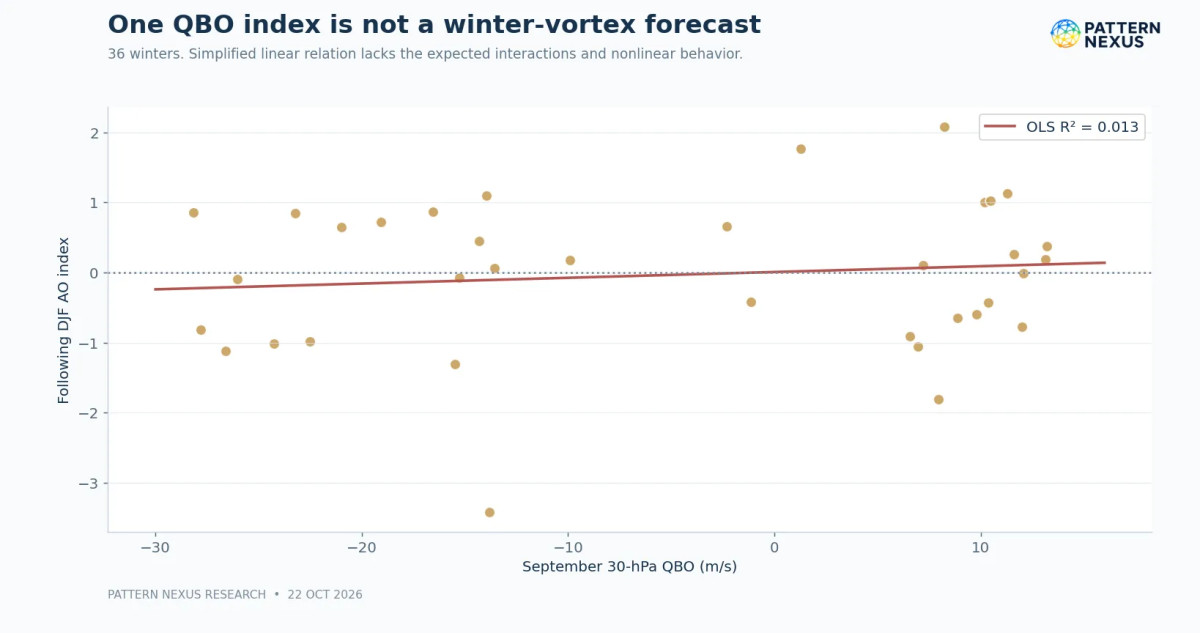
The out-of-sample results were clear enough to change my assessment. In this sample, ENSO and September QBO do not provide reliable improvement over simply forecasting the long-run winter AO mean.
An apparently better in-sample fit did not translate into better predictions of winters the model had not seen. Additional predictors alone do not make a winter forecast more accurate.
| Model | In-sample R² | Rolling test RMSE (AO units) | Relative to baseline |
|---|---|---|---|
| Historical mean only | — | 1.190 | Baseline |
| August–October RONI | 0.000 | 1.212 | Worse |
| September QBO, 30 hPa | 0.013 | 1.198 | Worse |
| RONI + 30-hPa QBO | 0.014 | 1.230 | Worse |
| RONI + QBO at 30 and 50 hPa | 0.062 | 1.366 | Much worse |
R² is the proportion of variability explained inside the data used for the fit; RMSE is the error when predicting winters left out of that fit. Notice the larger model: its in-sample R² improves from the smaller specifications, but its independent forecast error gets substantially worse. That is a classic sign that added complexity can capture noise rather than improve forecasting.
The ENSO-only fitted R² is effectively zero. September QBO's linear relationship with the whole-winter AO is also weak. The point is not that the seasonal climate system has no structure. The point is that one autumn ENSO number and one or two September QBO measurements do not adequately predict a complex, evolving winter circulation index.
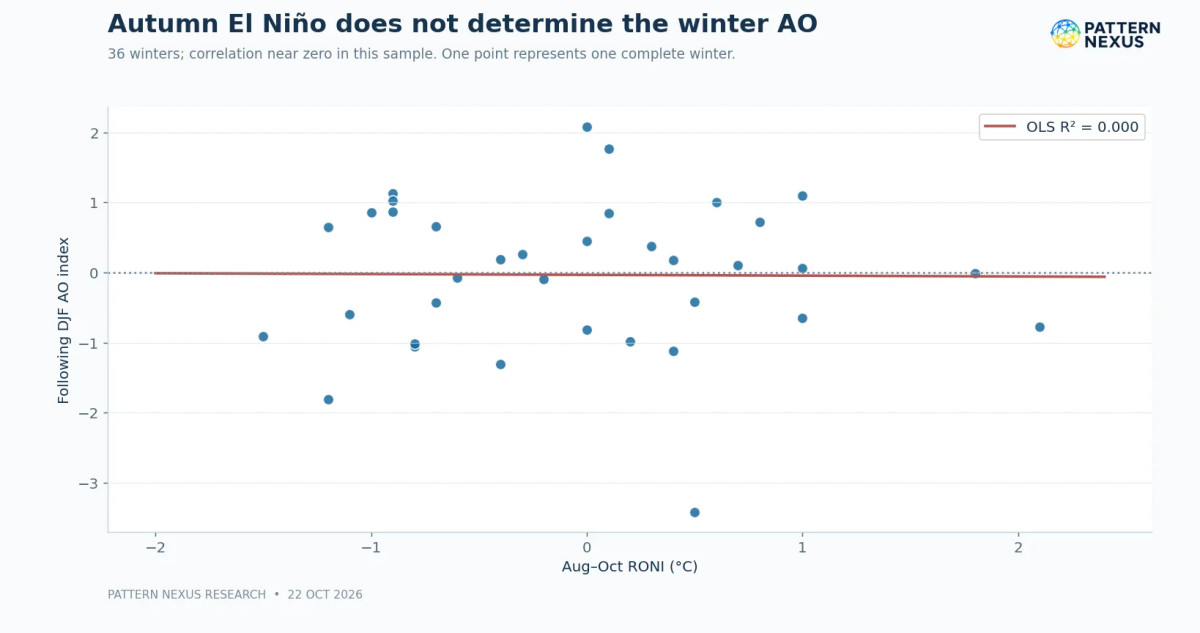
Two much-discussed strong El Niño years illustrate the limitations of analogs. In this specific historical index, 1997–98 entered with an August–October RONI of +2.1°C and finished with a DJF AO around −0.78. 2015–16 entered with RONI +1.8°C and had a DJF AO close to 0.00. Those are two cases, not a distribution broad enough to estimate a reliable winter probability. Adding a handful of memorable analog winters does not fix a small-sample forecasting problem.
The practical result is a stronger research standard for PN: an atmospheric relationship must improve out-of-sample predictions of a defined outcome before it earns a role in our seasonal probability estimates. A negative result does not end the investigation; it prevents us from issuing numbers we cannot defend.
What the historical test says: The ENSO/QBO regressions did not reliably improve held-out prediction of full-winter AO relative to the simple historical-mean baseline. Greater model complexity is not proof of forecasting skill.
13 · PATTERN NEXUS RESEARCH
Regression result II: Chicago snowfall across 32 seasons
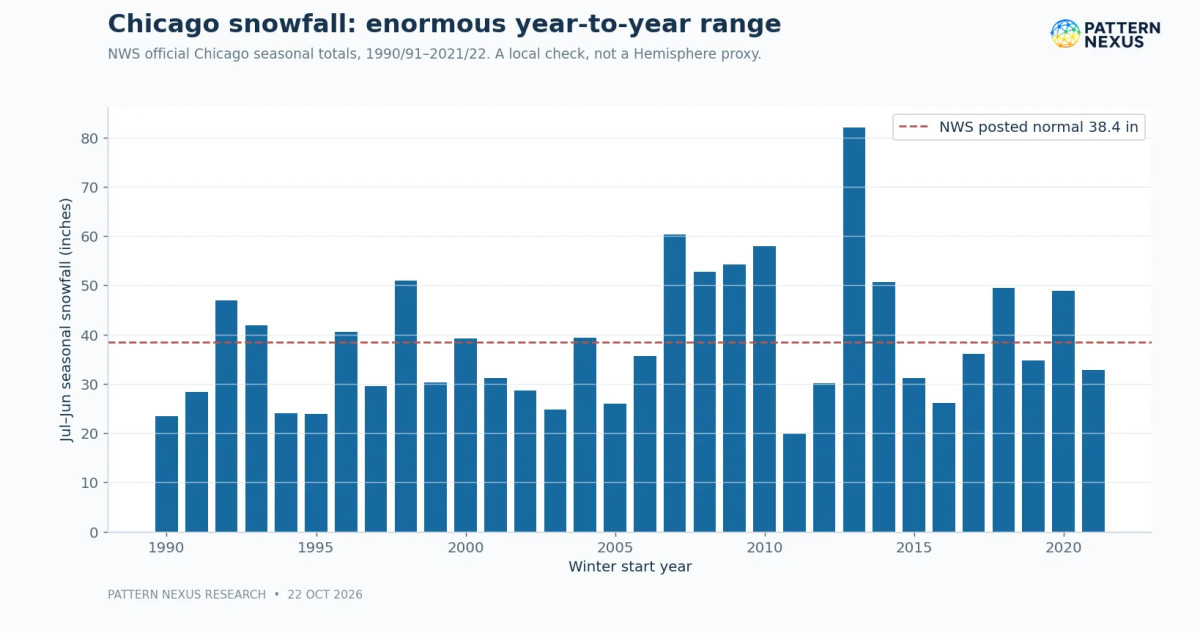
To test a more concrete outcome, I used the National Weather Service's historical Chicago July–June seasonal snowfall totals, which are available in the official ranking table through 2021–22. The matched sample contains 32 seasons, 1990–91 through 2021–22. This is a useful Great Lakes-region example, not a proxy for all of northern Illinois, the entire Great Lakes basin, or the Northern Hemisphere.
The raw data themselves caution against simple analog forecasting. Snowfall in the sample ranges from under 20 inches to 82.0 inches in 2013–14. A large lake-effect or synoptic storm season can overwhelm a broad seasonal climate tendency. Snow totals also depend on moisture, storm track, near-surface thermal structure and where precipitation bands actually set up.
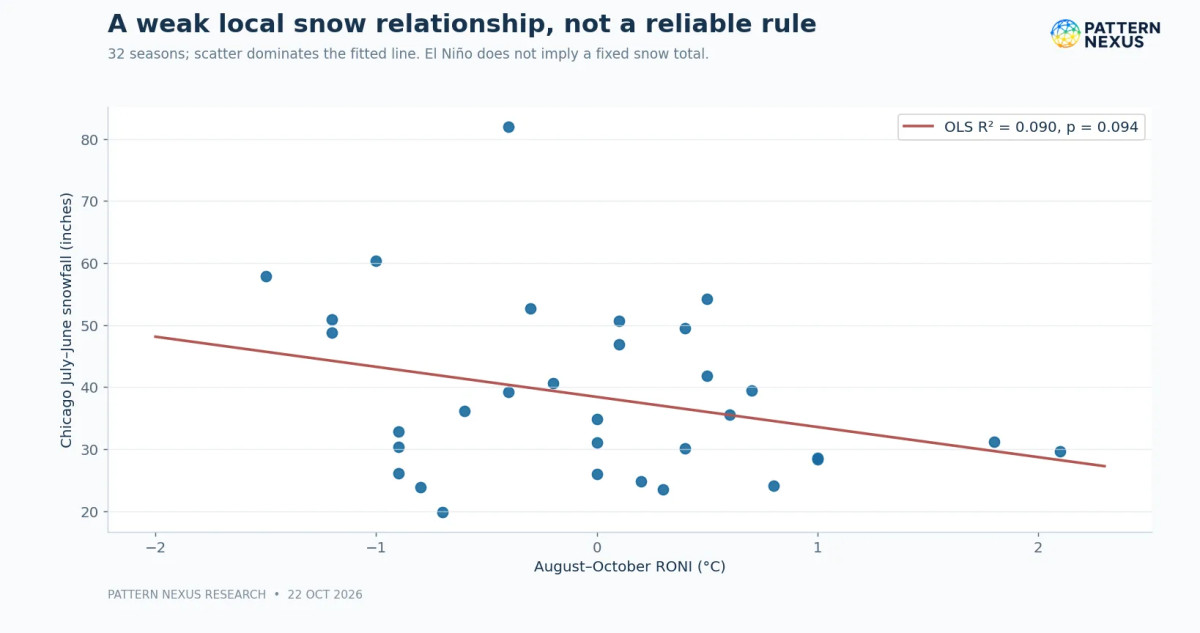
A simple in-sample OLS regression of Chicago seasonal snowfall on autumn RONI had a slope of approximately −4.85 inches per +1°C RONI and R² ≈ 0.09, with p ≈ 0.094. That is a weak association, and the conventional 5% significance threshold is not met. A non-significant result is not proof of zero physical effect, but neither is it support for a precise snowfall forecast.
What the held-out test actually predicted
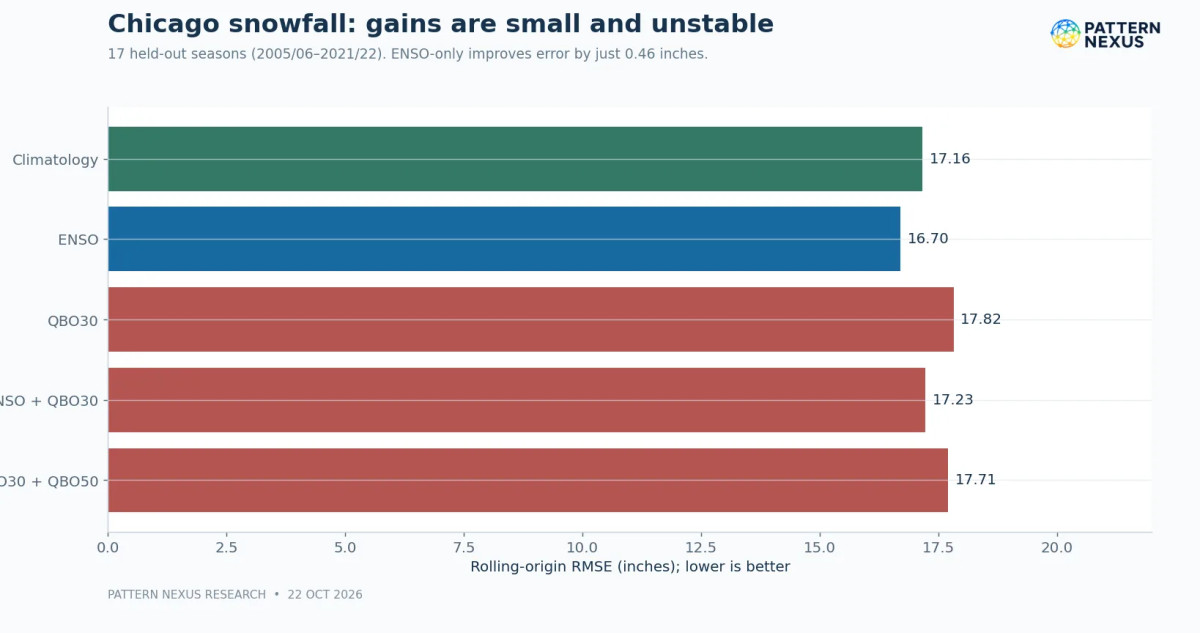
Using the same rolling-origin approach, with 15 training seasons and 17 one-season-ahead tests, the climatological mean gave a 17.16-inch RMSE. ENSO alone improved that to 16.70 inches, only about a 2.7% reduction. Adding September QBO reversed the apparent gain: ENSO plus 30-hPa QBO returned 17.23 inches; the three-predictor version performed worse still. With such a small sample and large outcome volatility, that tiny ENSO-only gain is not robust enough to use as an operational Chicago snowfall model.
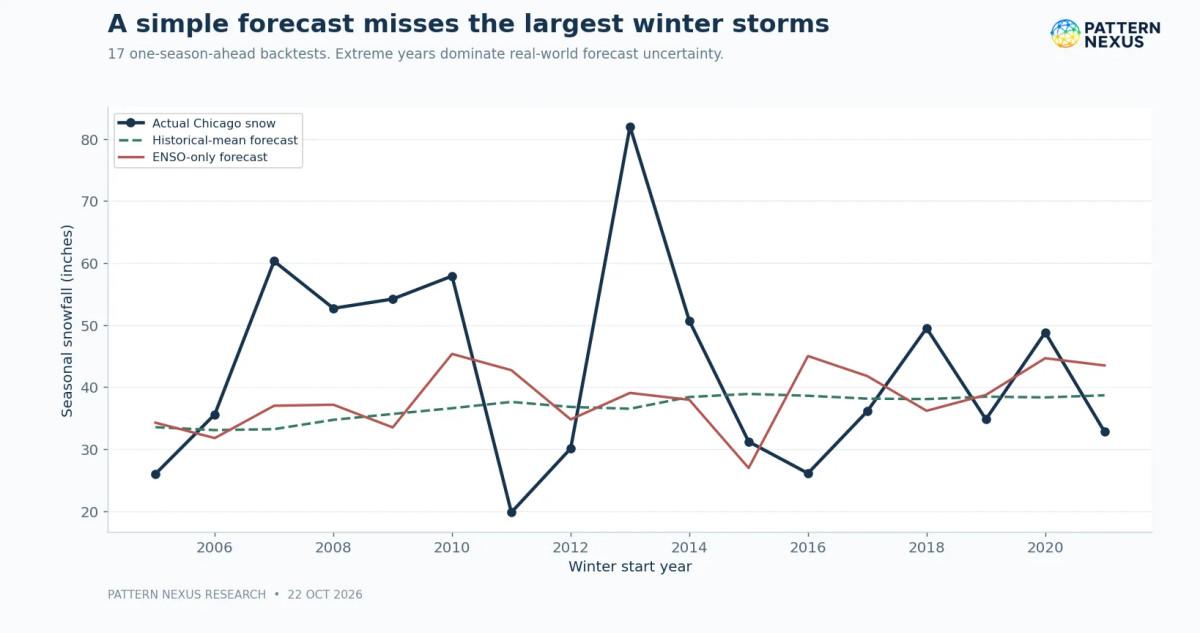
The Chicago test also helps answer a broader PN question: is the Arctic Oscillation the same as snowfall? No. In this sample the same-season average AO and full July–June Chicago snowfall showed little simple linear association. That is not surprising. Full-season mean AO smooths over the very events that matter for snowfall, and the snowfall window is longer than DJF. For cold delivery we should model extreme-cold days, multi-day blocking episodes and specific event windows, not only December–February averages.
Local outcome limitation: Chicago snowfall is one geographic outcome. Its large storm-to-storm variability prevents this regression from supporting a precise 2026–27 snowfall total.
14 · PATTERN NEXUS RESEARCH
Cold-delivery geography across the Northern Hemisphere
The Northern Hemisphere cannot be assigned one winter outcome. Its major populated sectors respond differently to the same large-scale background. North America is strongly influenced by the Pacific jet, Alaskan/West Coast ridging, the EPO/PNA patterns, Great Lakes moisture and Arctic air pathways through western Canada. Europe depends heavily on Atlantic blocking, the NAO and the position of the North Atlantic storm track. East Asia responds to Eurasian high pressure, Siberian snow and the East Asian winter monsoon, among other regional factors.
A displaced vortex can concentrate its most important anomalies over one sector. Europe might experience a blocked cold period while eastern North America stays relatively mild; East Asia might see cold surges while a strong Pacific jet brings wet weather to the southern United States. The same 10-hPa zonal mean cannot distinguish these possibilities.
Why regional delivery can diverge
For northern Illinois and the Great Lakes, the practical issue is whether a high-latitude block or Pacific ridge organizes the tropospheric flow so Arctic air travels south and persists. That requires 500-hPa ridges/troughs, 250-hPa jet geometry, lower-tropospheric thickness, surface pressure and temperature forecasts—and then adequate moisture for heavy snow. A weak stratospheric vortex may create an opportunity, but cold delivery is a separate process that must verify.
For energy and infrastructure stakeholders, this distinction is not academic. Seasonal warmth can coexist with a short, extreme heating-load spike, high natural-gas or power prices, frozen infrastructure, transportation disruption or unusually large regional snow totals. A forecast should specify whether its target is the winter average, the probability of a multi-day outbreak or the worst single event. They have different lead times and uncertainty levels.
15 · PATTERN NEXUS RESEARCH
What this adds to earlier Pattern Nexus winter work
Last winter's PN work focused on vortex deformation, jet-stream transitions, natural-gas exposure and the possibility that an apparently stable seasonal background could give way to regional cold. This year's research extends that monitoring rather than restarting it. The central method is still to distinguish the atmospheric precursor, the forecast mechanism and the surface outcome.
But there is an important standard for evaluating earlier calls. A published concern about a cold outbreak does not count as a successful prediction unless we define its date, location, threshold and verification source in advance. Nor should a seasonal forecast be counted as correct simply because one cold front eventually occurred. For the November follow-up I want to compare the 2025–26 PN articles against archived NWS and reanalysis outcomes, including false alarms, missed events and forecast lead times.
The unusual September 2026 record sequence has strengthened my interest in the early vortex, not increased my confidence in any particular winter temperature outcome. The October 13–14 geometry work adds a potentially useful predictor, but until we can reconstruct matching historical vortex shape, wave forcing and regional winter outcomes, it remains a hypothesis about predictive value rather than a validated predictor.
16 · PATTERN NEXUS RESEARCH
What the statistical model still does not contain
The next version of this model should incorporate several datasets not yet fully joined in the current package:
- ERA5 or comparable reanalysis of 10-, 70-, 100-, 250- and 500-hPa geopotential, wind and potential vorticity on a shared daily grid, with quantitative wave-1/wave-2 amplitudes, polar-cap temperatures and centroid displacement.
- 100-hPa eddy heat flux and lower-stratospheric wave diagnostics for autumn, computed using a consistent method across multiple decades. Upward wave activity may have different forecast value from a single-day 10-hPa zonal mean.
- Regional temperature and extreme-event targets across Canada, the northern U.S., Europe and East Asia, with 1981–2010 or 1991–2020 climatology specified and multiple event-duration thresholds.
- AO/NAO/PNA/EPO/WPO indices, Greenland/Ural/Alaskan blocking and MJO phases, with correct forecast availability and lead times. Including an AO measured during the winter to predict that same winter would be leakage.
- Snow and surface boundary conditions, including Eurasian snow-cover extent, Arctic ice concentration by sector, Barents–Kara heat flux, North Pacific SST structure and actual freeze-up progression.
- Solar and geospace event data: 1-hour solar-wind speed, IMF Bz/Bt, Kp/Ap, CME catalog, electron and proton precipitation measurements, NOx/ozone observations and lagged controls.
- Proper predictive validation: rolling or blocked out-of-sample seasons, penalized models with limited predictor counts, benchmark comparisons, calibration, regional error maps and sensitivity testing to the small number of strongest El Niño winters.
The dataset is too short to responsibly fit every one of these signals in a single conventional regression and assign strong probabilities. More variables can make a model look sophisticated while making it worse. The next phase should begin with physically justified, pre-declared predictor groups and a small number of interpretable regional outcomes, then expand only when held-out forecast skill improves.
17 · PATTERN NEXUS RESEARCH
Preliminary winter 2026–27 assessment
Northern United States and Great Lakes — seasonal temperatures: The most defensible current baseline follows NOAA's October seasonal outlook: above-normal winter temperatures are favored across much of the northern tier. This is a probabilistic seasonal tilt, not a claim that every month will be warm or that the Great Lakes cannot experience an Arctic outbreak. The added autumn ENSO–QBO regressions do not justify narrowing NOAA's temperature probabilities.
The seasonal baseline favors a warmer northern United States. Significant cold episodes remain possible, but the present evidence does not support a specific timing, magnitude, or snowfall total.
Southern United States — precipitation and storm track: A strong El Niño provides a meaningful background reason to monitor a more active subtropical jet and wetter-than-normal conditions in parts of the southern tier. The exact storm corridors and precipitation phase remain uncertain. A powerful storm can produce snow where cold air overlaps the precipitation shield, regardless of the whole-season temperature tendency.
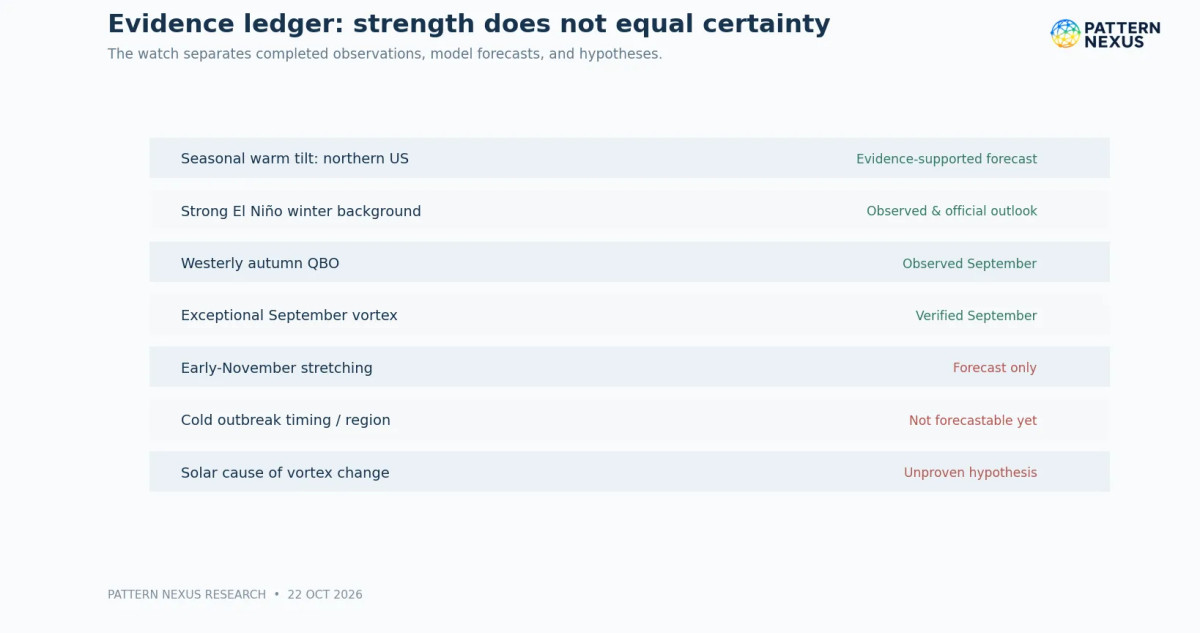
Arctic stratospheric vortex: The September record strength is verified. Moderately below-normal October analyzed winds are verified. Renewed weakening and substantial stretching near early November are currently forecasts. No observed major wind reversal or verified sustained downward-coupling episode has been demonstrated by the sources analyzed here.
Conditional risk, not a deterministic outcome
Northern Hemisphere cold outbreaks: The possibility of regional cold-air displacement in North America, Europe and Asia is real, but we cannot responsibly provide calendar dates, a guaranteed vortex split or specific regional probabilities now. The data support targeted monitoring, not a high-confidence outbreak announcement. The same regional warnings will need their own 500-hPa and surface verification.
Solar hypothesis: The October geomagnetic observations warrant a dated entry in the research timeline. They do not establish that solar forcing caused the stratospheric progression. Both a null result and a positive lagged association should remain possible as further data are assembled.
Overall PN assessment, October 22: The winter's dominant seasonal background is unusually strong El Niño, while the Arctic stratosphere has moved from exceptional September strengthening toward below-normal winds and an interesting early-November deformation forecast. The strongest defensible conclusion is heightened monitoring with broad seasonal probabilities unchanged, not escalation to a severe-winter forecast.
18 · PATTERN NEXUS RESEARCH
What will change by the late-November update
I will publish the next formal update around November 30, 2026. That window is useful because we will have more analyzed November wind observations, better evidence of whether the late-October/early-November wave-activity forecast verified, and updated ENSO and longer-range atmospheric guidance. Waiting gives us a real comparison between what the models predicted and what actually happened.
We will revisit the NASA analyzed record, observed vortex displacement and waves, the lower-atmosphere circulation, updated ENSO/QBO conditions, and regional cold-delivery indicators. Forecast errors will remain part of the published record.
The November review will answer five direct questions. First, did 10-hPa winds fall below the date-matched lower decile, and for how long? Second, did the vortex become meaningfully displaced or elongated in potential-vorticity/geopotential fields, rather than only on a wind map? Third, did coherent anomalies extend through 70 and 100 hPa toward the troposphere, with identifiable upward wave forcing and timing? Fourth, did the Pacific, Atlantic and Eurasian circulation patterns actually create cold-delivery pathways? Fifth, did new historical comparisons improve out-of-sample skill enough to adjust any regional outlook?
We will also review NOAA's November 12 ENSO discussion and the next seasonal outlook, plus 30/50-hPa QBO updates and contemporaneous solar activity. For regional forecasts, the outputs should be separate: December–February seasonal temperature terciles, temperature-anomaly ranges, cold-outbreak indicators and snowfall-risk conditions. If the predictors do not improve the baseline, the model should say so.
The objective has not changed: understand the system, identify where the signal begins, test whether it survives into the real atmosphere, and separate what we know from what we think might happen. The record September vortex, the October transition and the very strong El Niño give us an excellent starting case. They do not give us permission to overstate what winter 2026–27 will do.
Next formal update: Late November 2026, when the late-October forecast window has passed and newly analyzed November observations can be evaluated alongside updated circulation and seasonal guidance.
Questions this report should answer
Does a record-strength September vortex mean a cold January?
No. September records document early-season wind strength, not a validated multi-month temperature forecast.
Does El Niño mean winter will be warm everywhere in the Northern Hemisphere?
No. ENSO changes the odds of certain large-scale circulation patterns; Europe, Asia and different parts of North America can respond differently.
Does a westerly QBO prevent a sudden stratospheric warming?
No. It can influence the background odds in historical studies, but SSWs and substantial vortex disturbances can still occur under either QBO phase.
Is a negative Arctic Oscillation the same thing as a split vortex?
No. The AO is an annular circulation index, generally relating to surface or tropospheric pressure patterns; a vortex split is a structural diagnosis of the stratospheric circulation.
Can solar storms affect the stratosphere?
Energetic particle precipitation can affect polar middle-atmospheric chemistry under suitable conditions. The question in this report—whether the specific 2026 geomagnetic sequence has a demonstrable effect on Arctic vortex dynamics—remains open.
Why isn't there a specific 2026–27 Chicago snowfall number?
The historical backtest did not demonstrate dependable predictive skill and major snowfall seasons are highly sensitive to storm placement, lake effects and temperature at the time of precipitation. A single number would suggest precision the data do not support.
When will the picture be clearer?
Around the end of November, when we can replace much of the current early-November forecast with analyzed stratospheric evidence and update the regional circulation assessment.
SOURCES
Sources and research provenance
Historical predictors were selected using information known by the autumn preceding each completed winter. NOAA/NSIDC/NASA and official NWS tables provide primary physical observations; the AO historical monthly series is cross-referenced against a separately reproduced CPC monthly index. Dates and all forecast statuses are explicit in the article and companion tables.
- NASA Ozone Watch: 2026 60°N, 10-hPa daily wind and date-matched percentiles
- NASA GMAO MERRA-2 atmospheric reanalysis description
- ECMWF-based Arctic vortex diagnostics, Oct. 22, 2026 model cycle
- NOAA CPC October 8, 2026 ENSO Diagnostic Discussion
- NOAA CPC Relative Oceanic Niño Index (RONI), historical table
- NOAA CPC September monthly QBO original 30-hPa winds
- NOAA CPC September monthly QBO original 50-hPa winds
- NOAA CPC October 15 prognostic long-lead seasonal discussion
- NOAA October 2026 winter-season outlook announcement
- NOAA SWPC October 22 space-weather discussion and solar-wind observations
- NOAA/NSIDC October 7 2026 Arctic sea ice monthly analysis
- NWS Chicago official seasonal snowfall totals, July–June
- NWS La Crosse winter 2026–27 ENSO/QBO discussion
- NOAA CPC monthly Arctic Oscillation index (historical source)
- CPC Arctic Oscillation index, reproduced searchable monthly table
- Baldwin et al.: Sudden Stratospheric Warmings, Reviews of Geophysics (2021)
- NOAA/CPC seasonal ENSO probability products
- NOAA CPC North Atlantic Oscillation and other circulation indices
NASA source: date-matched 1978/79–2025/26 climatology, MERRA-2 historical system with 2026 GEOS FP analysis from August onward. `Fcst=0` is an analyzed row; positive `Fcst` rows are modeled forecasts. Chart 1 and Chart 5 show that boundary explicitly.
Research conventions: One row per completed winter in the regression, August–October RONI (autumn year), September QBO at 30 and 50 hPa, December–February AO (Dec of autumn year; Jan–Feb of next year), and July–June NWS Chicago seasonal snowfall. Rolling-origin splits train on the first 15 winters and forecast each following held-out winter in calendar order. Reported p-values are exploratory unadjusted OLS significance values, not evidence of causal effects. No 2026–27 observed winter outcomes enter the historical training dataset.
Scope and uncertainties: No synchronized reanalysis reconstruction of 70/100/250/500 hPa and no historical solar–chemical lag model are included. The NOAA RONI archive is periodically revised, and the searchable CPC AO reproduction is a secondary access point. Coefficients depend on chosen dates, windows, sample, index versions and outcome geography.
Our conclusion is preliminary. September records are confirmed, the October transition is measured, and El Niño and the QBO provide important background conditions. The historical regression results do not establish a reliable forecast for any particular cold outbreak or snowfall total.
The next formal update is planned for late November 2026, when newly analyzed vortex observations, changes in wave activity and additional tropospheric evidence can be compared with this baseline.
What's Your Reaction?
 Like
0
 Dislike
0
 Love
0
 Funny
0
 Wow
0
 Sad
0
 Angry
0

Nexus (Christopher)
Founder of Pattern Nexus. I research markets, macro, geopolitics, AI, history, ancient systems, and the patterns most people overlook. I’m also building Market Radar, a trading scanner designed to read pressure, risk, confirmation, and setup quality before ch…
Related research
Polar Vortex Watch 2026–27: The Sun Quieted, the Vortex Hit a Record — Now the Real Test Begins
The early-season Arctic vortex has now crossed from unusual into a verified date-matched record at 10 hPa. At the same time, NOAA reports v…
9 shared topics, same research avenue.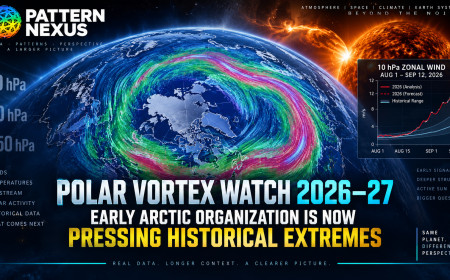
Polar Vortex Watch 2026–27: Early Arctic Organization Is Now Pressing Historical Extremes
What started as an unusual late-August structural signal is becoming something much harder to dismiss. The 10-hPa Arctic winds have moved a…
7 shared topics, same research avenue.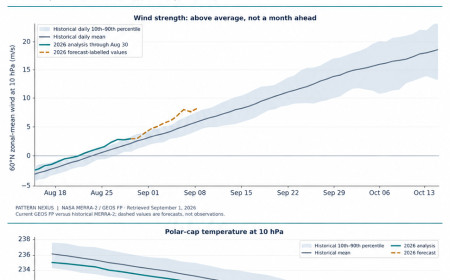
Polar Vortex Watch 2026–27: The Early Organization Signal, Measured
The wind-speed test and the geometry test give different answers. Pattern Nexus compares 48 autumn wind series and 744 historical height fi…
8 shared topics, same research avenue.
They Put a Fly Brain in Minecraft. The Mind-Uploading Pipeline Is No Longer Hypothetical.
A complete fruit-fly central nervous system can now be mapped at synaptic resolution, instantiated as a computational network and wired int…
3 shared topics, same research avenue.
The Vacuum Program: Zero-Point Energy, UAP Disclosure, and the Physics Hiding in Plain Sight
NASA studied quantum-vacuum propulsion. DIA commissioned papers on vacuum-energy extraction, negative energy, wormholes, and spacetime engi…
3 shared topics, same research avenue.
The Moon Is Not Just a Rock: The Lunar Anomaly Stack, Apollo UAP Files, and the Far-Side Base Question
The Moon has been normalized because it is always there, but the actual anomaly stack is hard to ignore: its strange proportion to Earth, i…
3 shared topics, same research avenue.
NASA’s Moon Base, MoonFall, Nuclear Missions, and the Drone Layer of Mars
A Pattern Nexus analysis of NASA’s 2026 surface-first lunar architecture, MoonFall hopper drones, lunar nuclear power, nuclear-electric Mar…
3 shared topics, same research avenue.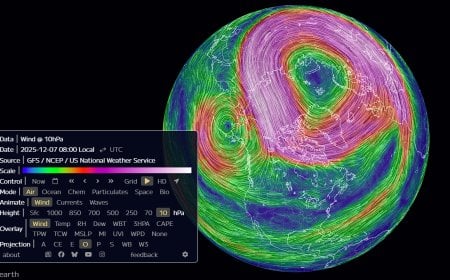
The Polar Vortex Is Stretching to the Breaking Point: Why Late December Could Turn Brutal
The polar vortex is undergoing rapid deformation between December 7–11, 2025, with stratospheric winds elongating into a classic pre-collap…
3 shared topics.
Comments (0)
Security Check
Please complete the captcha to verify you are human.