
Week Ahead: Markets, Data & Macro Risks (Nov 24–30, 2025)
A forward-looking Pattern Nexus walkthrough of the week of November 24–30, 2025, covering key economic data, market markers, and structural risks around AI, rates, and global macro.
Week Ahead: Markets, Data & Macro Risks (Nov 24–30, 2025)
Looking ahead through a shortened holiday week as investors juggle inflation data, rate-cut hopes, and an overstretched AI trade.
Between key U.S. inflation and growth prints, fragile tech valuations, and thin holiday liquidity, small surprises can trigger outsized moves.
The week of November 24–30, 2025 drops into a structurally awkward zone for markets: a U.S. holiday week, delayed data from the recent government shutdown, and an investor base that is simultaneously betting on Fed rate cuts and questioning whether the AI trade has already outrun reality.
What follows is a forward-looking map of the week: the economic data that matters, the market markers to watch, the bigger themes in play, and how these pieces fit together for anyone thinking in systems rather than headlines.
Key Economic Data & Calendar Markers
Even with U.S. markets closed Thursday and shortened Friday, a cluster of releases early in the week could reset expectations for growth, inflation, and the Fed.
U.S. data: inflation, demand, and growth
The U.S. calendar is compressed but important. After weeks of partial data due to the shutdown, investors are hungry for clearer signals:
- Producer Price Index (PPI) – Fresh input on pipeline inflation and corporate cost pressures.
- Retail Sales – A direct read on the consumer, which drives roughly 70% of U.S. GDP.
- Conference Board Consumer Confidence – A sentiment gauge that often leads spending trends.
- Durable Goods Orders – Insight into business investment and demand for big-ticket items.
- Advance International Trade in Goods – External demand, supply-chain health, and trade dynamics.
- Second estimate of U.S. GDP – A refinement of the growth story with updated components.
- Personal Income & the PCE Deflator – The Fed’s preferred inflation gauge and the income backdrop that supports or undermines spending.
Because many of these prints were partially delayed or distorted by the shutdown, they carry extra weight: they help resolve whether the U.S. is decelerating smoothly, stalling, or re-accelerating in uncomfortable ways.
Global releases: Japan, Europe, and commodity economies
Outside the U.S., the data mix fills in the global macro backdrop:
- Australia CPI and New Zealand rate decisions – Useful barometers for commodity-linked, rate-sensitive economies.
- Japan Tokyo CPI – A live read on whether Japan’s long-awaited inflation regime shift has staying power.
- Canada GDP – Links into North American demand, energy exposure, and housing dynamics.
- Germany and Euro-zone inflation & retail data – Critical for understanding whether Europe is stuck in stagflation, disinflation, or a fragile recovery.
These releases won’t drive U.S. markets alone, but they reinforce or challenge the global narrative: are we in a synchronized slowdown, or a patchwork of divergent regimes where policy paths increasingly decouple?
Market Context: What the Tape Is Already Telling You
AI and tech heavyweights are under pressure even when earnings beat, while rate-cut hopes creep higher into year-end.
Equities: AI fatigue and valuation gravity
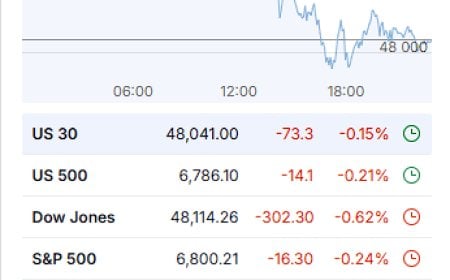
The major U.S. indices have pulled back, with the Nasdaq Composite down roughly 7% from its October high. Tech and AI-linked names have sold off even in the face of strong earnings, a classic sign that expectations were priced too aggressively.
In practice, this looks like:
- Companies such as Nvidia posting robust numbers but seeing their stocks fall anyway.
- A slow rotation toward more defensive sectors, including large-cap healthcare names like Eli Lilly, which have held up better amid volatility.
- A market increasingly selective: it is no longer enough to simply say “AI” to justify multiples.
Fed expectations: rate cuts vs. reality
Futures markets are now assigning roughly 70–73% odds of a rate cut at the December Federal Reserve meeting. That is a meaningful shift from earlier in the year and sets up the week for asymmetric reactions:
- Hot inflation or strong demand data (PPI, retail sales, PCE) could force those odds lower, pushing yields up and pressuring growth stocks.
- Softer data could confirm a cooling economy and reinforce the case for cuts, compressing yields and supporting a relief bid in risk assets.
Either way, the key markers to monitor are the yield curve, 10-year Treasury yields, and the U.S. dollar. They will tell you whether the market is leaning toward growth fear, inflation fear, or a fragile Goldilocks in between.
Holiday structure: low liquidity, high noise
The U.S. Thanksgiving week injects structural quirks that matter:
- Markets are closed Thursday and operate on a shortened schedule Friday.
- Trading volumes tend to be lower, particularly Friday afternoon.
- Thin liquidity can amplify price moves off otherwise modest data surprises or headlines.
This can produce air pockets: sharp intraday swings that are more about positioning and liquidity than fundamentals. For tactical traders, this is opportunity and risk; for longer-horizon investors, it is noise to filter, not chase.
Big Themes & Structural Risks in Play
Valuations, AI, and “fatalistic” sentiment
When strong AI earnings get sold, the issue is not growth—it’s expectations and price.
Commentary across the institutional landscape is sharpening around a single tension: elevated valuations vs. a more fragile macro backdrop. Tech and AI names have been priced as if growth would be linear and smooth; reality is messier.
Current sentiment shows three overlapping strands:
- AI fatigue – The easy phase of “everything AI goes up” appears to be over. Investors are demanding clearer, sustainable earnings power.
- Macro unease – Sticky inflation in some regions, weak data in others, and a sense that policy tools are constrained.
- Growing fatalism – A tone among some investors that the system is too complex to model cleanly, leading to higher risk premiums and defensive postures.
Global macro: not one cycle, but many
Global data this week reinforces a broader reality: the world is not moving in a single synchronized cycle.
- Japan is still negotiating its escape from decades of deflation, with Tokyo CPI data under the microscope.
- Europe is balancing weak growth with stubborn pockets of inflation, particularly in services and energy-sensitive sectors.
- Commodity and energy-linked economies (Australia, Canada) are navigating the twin forces of global demand shifts and the early stages of AI-driven industrial build-outs.
For markets, that means policy paths will diverge. As they do, relative FX moves and cross-border capital flows matter as much as headline GDP prints. The U.S. dollar, in particular, tends to strengthen when global stress rises, not when everything is fine.
After the shutdown: data gaps and fiscal shadows
The recent 43-day U.S. government shutdown still casts a shadow. Data delays created a “fog of war” environment where models were running on stale inputs. As that fog clears, the risk is that the updated picture looks less benign than markets hoped.
On the fiscal side, questions remain about how the shutdown and subsequent funding resolutions will shape spending trajectories, Treasury issuance, and the long-term path of debt dynamics. These are slow-burn variables, but they feed directly into long-horizon expectations about rates, inflation, and growth.
Strategic Lens: How to Read This Week
The interplay between data, Fed expectations, and stretched sectors will say more than any headline alone.
Recognize that risk is skewed, not symmetrical
With rate-cut odds already elevated and AI valuations still rich, the balance of risk leans toward disappointment. Strong data can undercut the rate-cut narrative; weak data can reinforce growth fears. Either outcome can pressure crowded trades.
Watch markers, not just headlines
More important than the exact decimal on PPI or PCE is how markets digest it. Key tells include:
- Does the 10-year yield move sharply relative to the surprise in the data?
- Do AI and high-beta tech names sell off on “good” news, suggesting positioning exhaustion?
- Do defensive sectors quietly gain relative strength?
- Does the dollar strengthen, hinting at global stress and flight to safety?
Treat the AI trade as being at a crossroads
At this stage, AI is no longer a novel story—it is a crowded one. When companies beat and the stocks fall, it is a sign that the market is debating not whether AI matters, but how much of that future is already priced in.
This week’s moves in AI-linked names will help clarify whether the market is merely consolidating after a strong run, or beginning a deeper repricing of expectations.
Respect holiday liquidity
Because of the Thanksgiving schedule and lighter participation, short-term moves can be exaggerated. For traders, that is a reason to size carefully and avoid chasing emotional spikes. For longer-term investors, it is a reminder to separate structural signals from holiday noise.
Use the week as a year-end checkpoint
As the last full month of the year approaches, this week is an ideal moment to ask:
- Is positioning aligned with a world of slower growth and more selective risk-taking?
- Have sector exposures drifted into being overly dependent on the AI complex?
- Are you monitoring the right markers—yields, spreads, FX, sector rotations—rather than just reacting to headlines?
Whether the coming months bring relief rallies or deeper volatility, the underlying game is the same: tracking how a complex system responds to pressure, not just reading the scoreboard after the fact.
Sources
Hyperlinks are provided here only, with no in-text external linking per Pattern Nexus style.
- Reuters — Investors eye holiday season turbulence amid AI and rate cut doubts
- Investopedia — What to Expect in Markets This Week: Retail Sales; Earnings; and Thanksgiving
- Investor’s Business Daily — Dow Jones Futures: Nvidia, Apple, Eli Lilly In Focus; Bitcoin Bounces
- The Economist — Why investors are increasingly fatalistic
- Trading Economics — Global economic calendar
- New York Fed — National Economic Indicators Calendar
- Wikipedia — 2025 United States federal government shutdown
Apa Reaksi Anda?
 Suka
0
Suka
0
 Tidak Suka
0
Tidak Suka
0
 Cinta
0
Cinta
0
 Lucu
0
Lucu
0
 Wow
0
Wow
0
 Sedih
0
Sedih
0
 Marah
0
Marah
0

Founder of Pattern Nexus. I research markets, macro, geopolitics, AI, history, ancient systems, and the patterns most people overlook. I’m also building Market Radar, a trading scanner designed to read pressure, risk, confirmation, and setup quality before chasing a move. Pattern Nexus is where I connect the dots between data, history, technology, and the bigger system playing out around us.











Komentar (0)